Some time ago, a customer asked whether it was possible, in M-Files, to have dashboards with KPIs and a global overview of what was happening in their vault. It was a topic I had in my radar for a few years already, but I never had – or took – the time to really work on it. I jumped on the occasion to start building a solution in parallel of my daily-job at dbi services. Several evenings (who said nights?), weekends and some holidays later, here we are.
The starting point was a real observation: the views of M-Files are powerful, the metadata model is flexible, the workflows are solid, but getting an at-a-glance picture of the business is still a clicking exercise. You open a view, you count, you open another view, you count again, you switch to the search, you start building an Excel with what you found… However, you might still not have the chart you wanted to present in the management meeting that starts in ten minutes.
This blog post introduces what I called the Business Dashboard module, a custom M-Files extension designed and built to fill that gap. This is the first post of a series that will walk through the module. From the end-user experience, to the authoring side, and finally to a complete worked example. I will use the M-Files Sample Vault for this series since it contains test data. You can quickly and easily deploy that vault via the M-Files installer.
1. The problem to solve
As you might know, M-Files ships with a few visualization features (views, search facets, the right-hand Metadata and Preview panes). With these, you can answer one of the following questions, but never all at once and never at a single glance:
- How many contracts are currently active in the vault?
- How many of them expire in the next 30 days?
- What is the distribution of our contracts by agreement type?
- What is the total amount of invoices waiting to be approved, broken down by customer?
- How many documents was each employee responsible for last quarter?
These are not exotic questions. They are the kind of things you might face every week. And the honest answer, today, is “I will get back to you later”. Sometimes there is a Power BI dashboard plugged into the vault SQL backend that answers some of them, but that is a second tool, a second login, often a second team to involve, and usually a permission/access story that does not match the per-user M-Files context.
I wanted something simpler. Something that lives inside M-Files, that integrates with the M-Files access model, that an administrator can configure without writing any code, and that the end user can open with one click from within M-Files.
2. What the Business Dashboard module is
The Business Dashboard is an additional panel that appears on the right-hand side of M-Files (alongside Metadata and Preview). It works in both M-Files Web and Desktop (latest UI). End users pick a dashboard to render, which contains widgets (tiles) that display live business data from the vault using KPIs, donut, bar, line, area, tables or gauges. Data is fetched live from M-Files and it can refresh itself. It provides multiple other features such as export to PDF or CSV, favorites, links, even object navigation, etc… From a security point of view, the access control will be in Post 7.
For administrators, dashboards are defined as JSON documents edited inside a dedicated tab in M-Files Admin. The editor offers both a JSON editor and a Visual Designer that lets you build dashboards without any knowledge of what JSON is. Definitions are stored in the vault, so a backup includes them automatically and there is no extra database to provision or manage.
Two design choices are worth pulling out here, because they shape everything else in the series:
- The engine is fully generic. There is no hardcoded business concept anywhere in the code. The same module works for contracts, invoices, customers, employees, projects, or whatever objects is contained within your vault. The JSON tells the engine how to query (which object type, which class, which property to group by, which filter to apply), not what values to expect.
- The wire format is frozen. Once the dashboard JSON is saved, the calls between the UI and the server speak a fixed shape. This means that when/if I ship a new widget type or a new aggregation, existing dashboards will keep working with no migration.
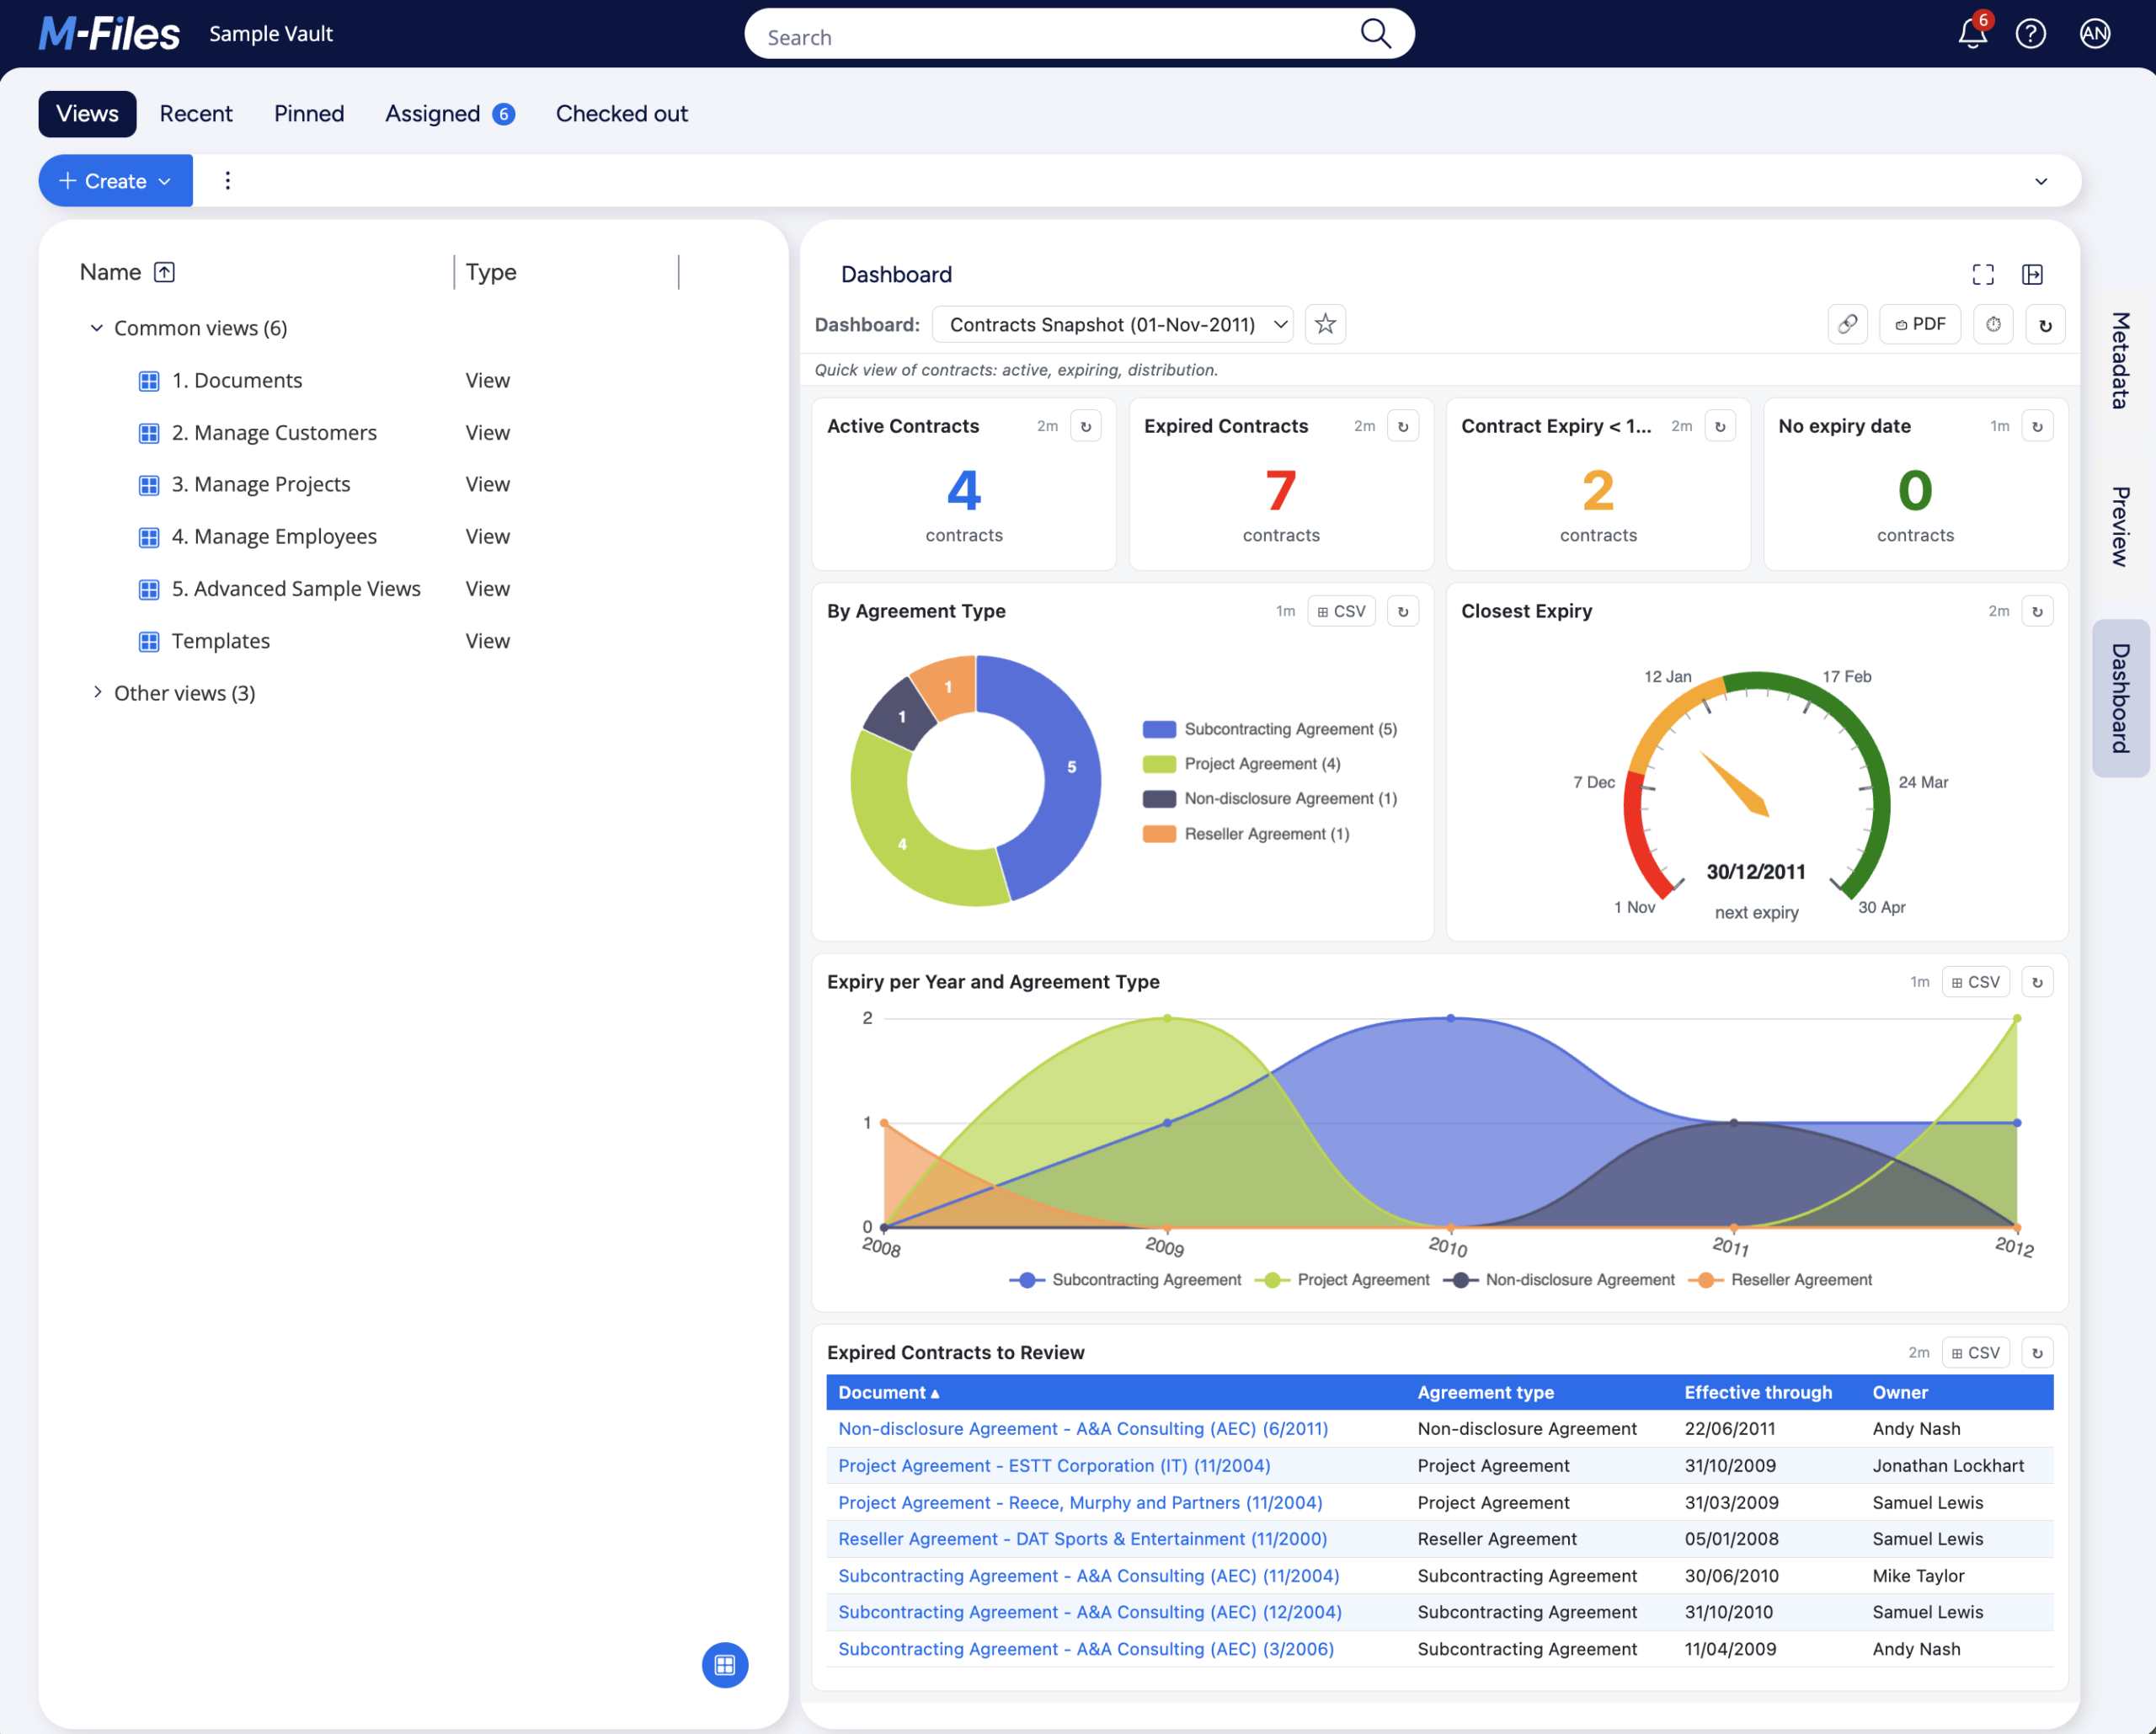
This is what the Business Dashboard looks like, from end-user point of view (click to enlarge the image):
3. Concrete use cases
Rather than list features, let me describe four concrete scenarios where the Business Dashboard could shine:
- Contracts overview. A KPI tile showing the number of active contracts, another showing those expiring in the next 30 days, a donut chart by agreement type, a bar chart showing expiries per month for the next year (e.g. until end of year or next 365 days), and a list of contracts to review this week. One panel, no clicking, refreshed automatically.
- Purchase invoices. Total amount waiting for approval, oldest invoice still pending, distribution by customer/countries/regions, a gauge of overdue invoices against a target of zero.
- Employees and responsibilities. A list of employees by department, with the count of documents worked on by each one in the past week. Possibly the list of people in holidays with their substitute. Useful for capacity planning and for the “who is on vacation, who covers what” conversation.
- Customer activity. Documents by customer in the last quarter, broken down by document class. Quickly spot the customers who went quiet and the ones who suddenly became very active.
None of these are hardcoded in the module. They are examples of what an administrator can configure, once, using the Visual Designer or the JSON editor. The same engine produces all of them and any number of variations.
Note: Whatever the widget used, with at most one more click, you can get the details of which objects correspond to what you are looking for. For example, if you have a KPI for the number of active contracts, if it shows 25, then simply clicking on that 25 will open a drill-through with the list of all 25 objects in that specific situation, with optional additional details. See the follow-up posts for more details on that (and all other features).
4. Where it runs
The module contains two parts:
- BusinessDashboard – the server-side, which contains the query engine, the validator, the persistence layer, etc.
- BusinessDashboard.UIX – the client-side, which contains all the display part for the end-users.
Both are installed, independently, in the M-Files Admin, via the standard application installation process. In regards to compatibility, it should technically supports all recent versions of M-Files that uses the new UI. I personally tested it extensively on M-Files 26.3 / 26.4 / 26.5.
No external service is contacted; everything runs inside the vault. This makes the module a good fit for both on-premises and cloud deployments (though for cloud, the module would need to first be validated by M-Files), or for any deployment where adding a second tool (Power BI, Grafana) is not desirable (too complex to setup, too much for the actual need, or simply for security reasons).
5. What this module is not
I think it is fair, before closing this introduction, to flag what the Business Dashboard module is not trying to do.
- It is not a BI tool. No SQL access, no data warehouse, no cross-vault joins. The engine only queries the M-Files vault it is deployed on and that’s it. If you need to combine data from a vault and an ERP, a dedicated BI stack might still be the right answer. UNLESS you are already merging the ERP data in M-Files (external repository or database connector). In that case, the Business Dashboard would be able to query it as well.
- It is not (really) a reporting engine. No scheduled report, no email delivery. However, you can export a dashboard as PDF and you can export a widget (or its drill-through) to CSV (Excel-compatible).
- It is not (really) designed for very large aggregations. The engine fetches up to a configurable amount of objects per widget (500 by default – can be increased, decreased or disabled completely…). Then aggregates it in memory, which is fine for any reasonable business question. Though it is not fine for things such as “list all 50 million objects that were created in the last 10 years”… If the limit is hit, the user knows about it with the help of a special badge.
- It is not a replacement for M-Files views (or is it…?). Depending on use-cases, views can still be a better starting point. The Business Dashboard sits next to them, not in front of them.
If your need fits inside those boundaries, the module might make your life easier, irrespective of whether you are a decision maker, a power user, a simple user or an administrator. If it does not, please get in touch and I will be happy to discuss what would!
6. What comes next in the series
This series is going to cover, in order:
- Post 2 – The end-user experience: opening the panel, switching dashboards, drill-through, exports, favorites, sharing.
- Post 3 – The anatomy of a dashboard definition: the JSON structure that drives everything.
- Posts 4a, 4b, 4c – The widget catalog, split by type family: scalar widgets (kpiNumber, gauge), trend widgets (line, area), and distribution / tabular widgets (donut, bar, table).
- Post 5 – Writing queries: objectType, class, filters, date tokens.
- Post 6 – Aggregations and reducers.
- Post 7 – The Admin tab: actions, Visual Designer / JSON editor, validation, import / export, access control.
- Post 8 – Building a dashboard with the Visual Designer.
If you have a specific question or a use case you would like to see covered in the series, don’t hesitate to reach out, and I might be able to add it to my to-do list.
In the meantime, the next post will be a tour of what an end user sees the first time they click on the new Dashboard tab. See you there.
![Thumbnail [60x60]](https://www.dbi-services.com/blog/wp-content/uploads/2022/08/MOP_web-min-scaled.jpg)
![Thumbnail [90x90]](https://www.dbi-services.com/blog/wp-content/uploads/2022/08/GME_web-min-scaled.jpg)
![Thumbnail [90x90]](https://www.dbi-services.com/blog/wp-content/uploads/2022/08/ATR_web-min-scaled.jpg)