So far in this series I have covered what an end user sees, the anatomy of a dashboard definition, the seven widget types (scalar, trend, and the rest), the query side, including the aggregations. Time to look at the surface where the administrator actually spends time: the Dashboard tab in M-Files Admin.
This is also where the Visual Designer lives. Some administrators write JSON directly, others stay in the visual canvas, others switch back and forth. All three workflows are supported, and the two modes are kept in sync at every moment.
1. Where to find the Admin tab
Once it has been installed (e.g. via Vault -> Right click -> Applications -> Install…), the Business Dashboard will be present in the M-Files Admin configuration page:
- Open M-Files Admin (the desktop management application).
- Connect to your server and open the target vault.
- In the left tree, navigate to Configurations -> Other Applications.
- Find dbi services Business Dashboard and click it.
- You should end up on the Dashboard tab.
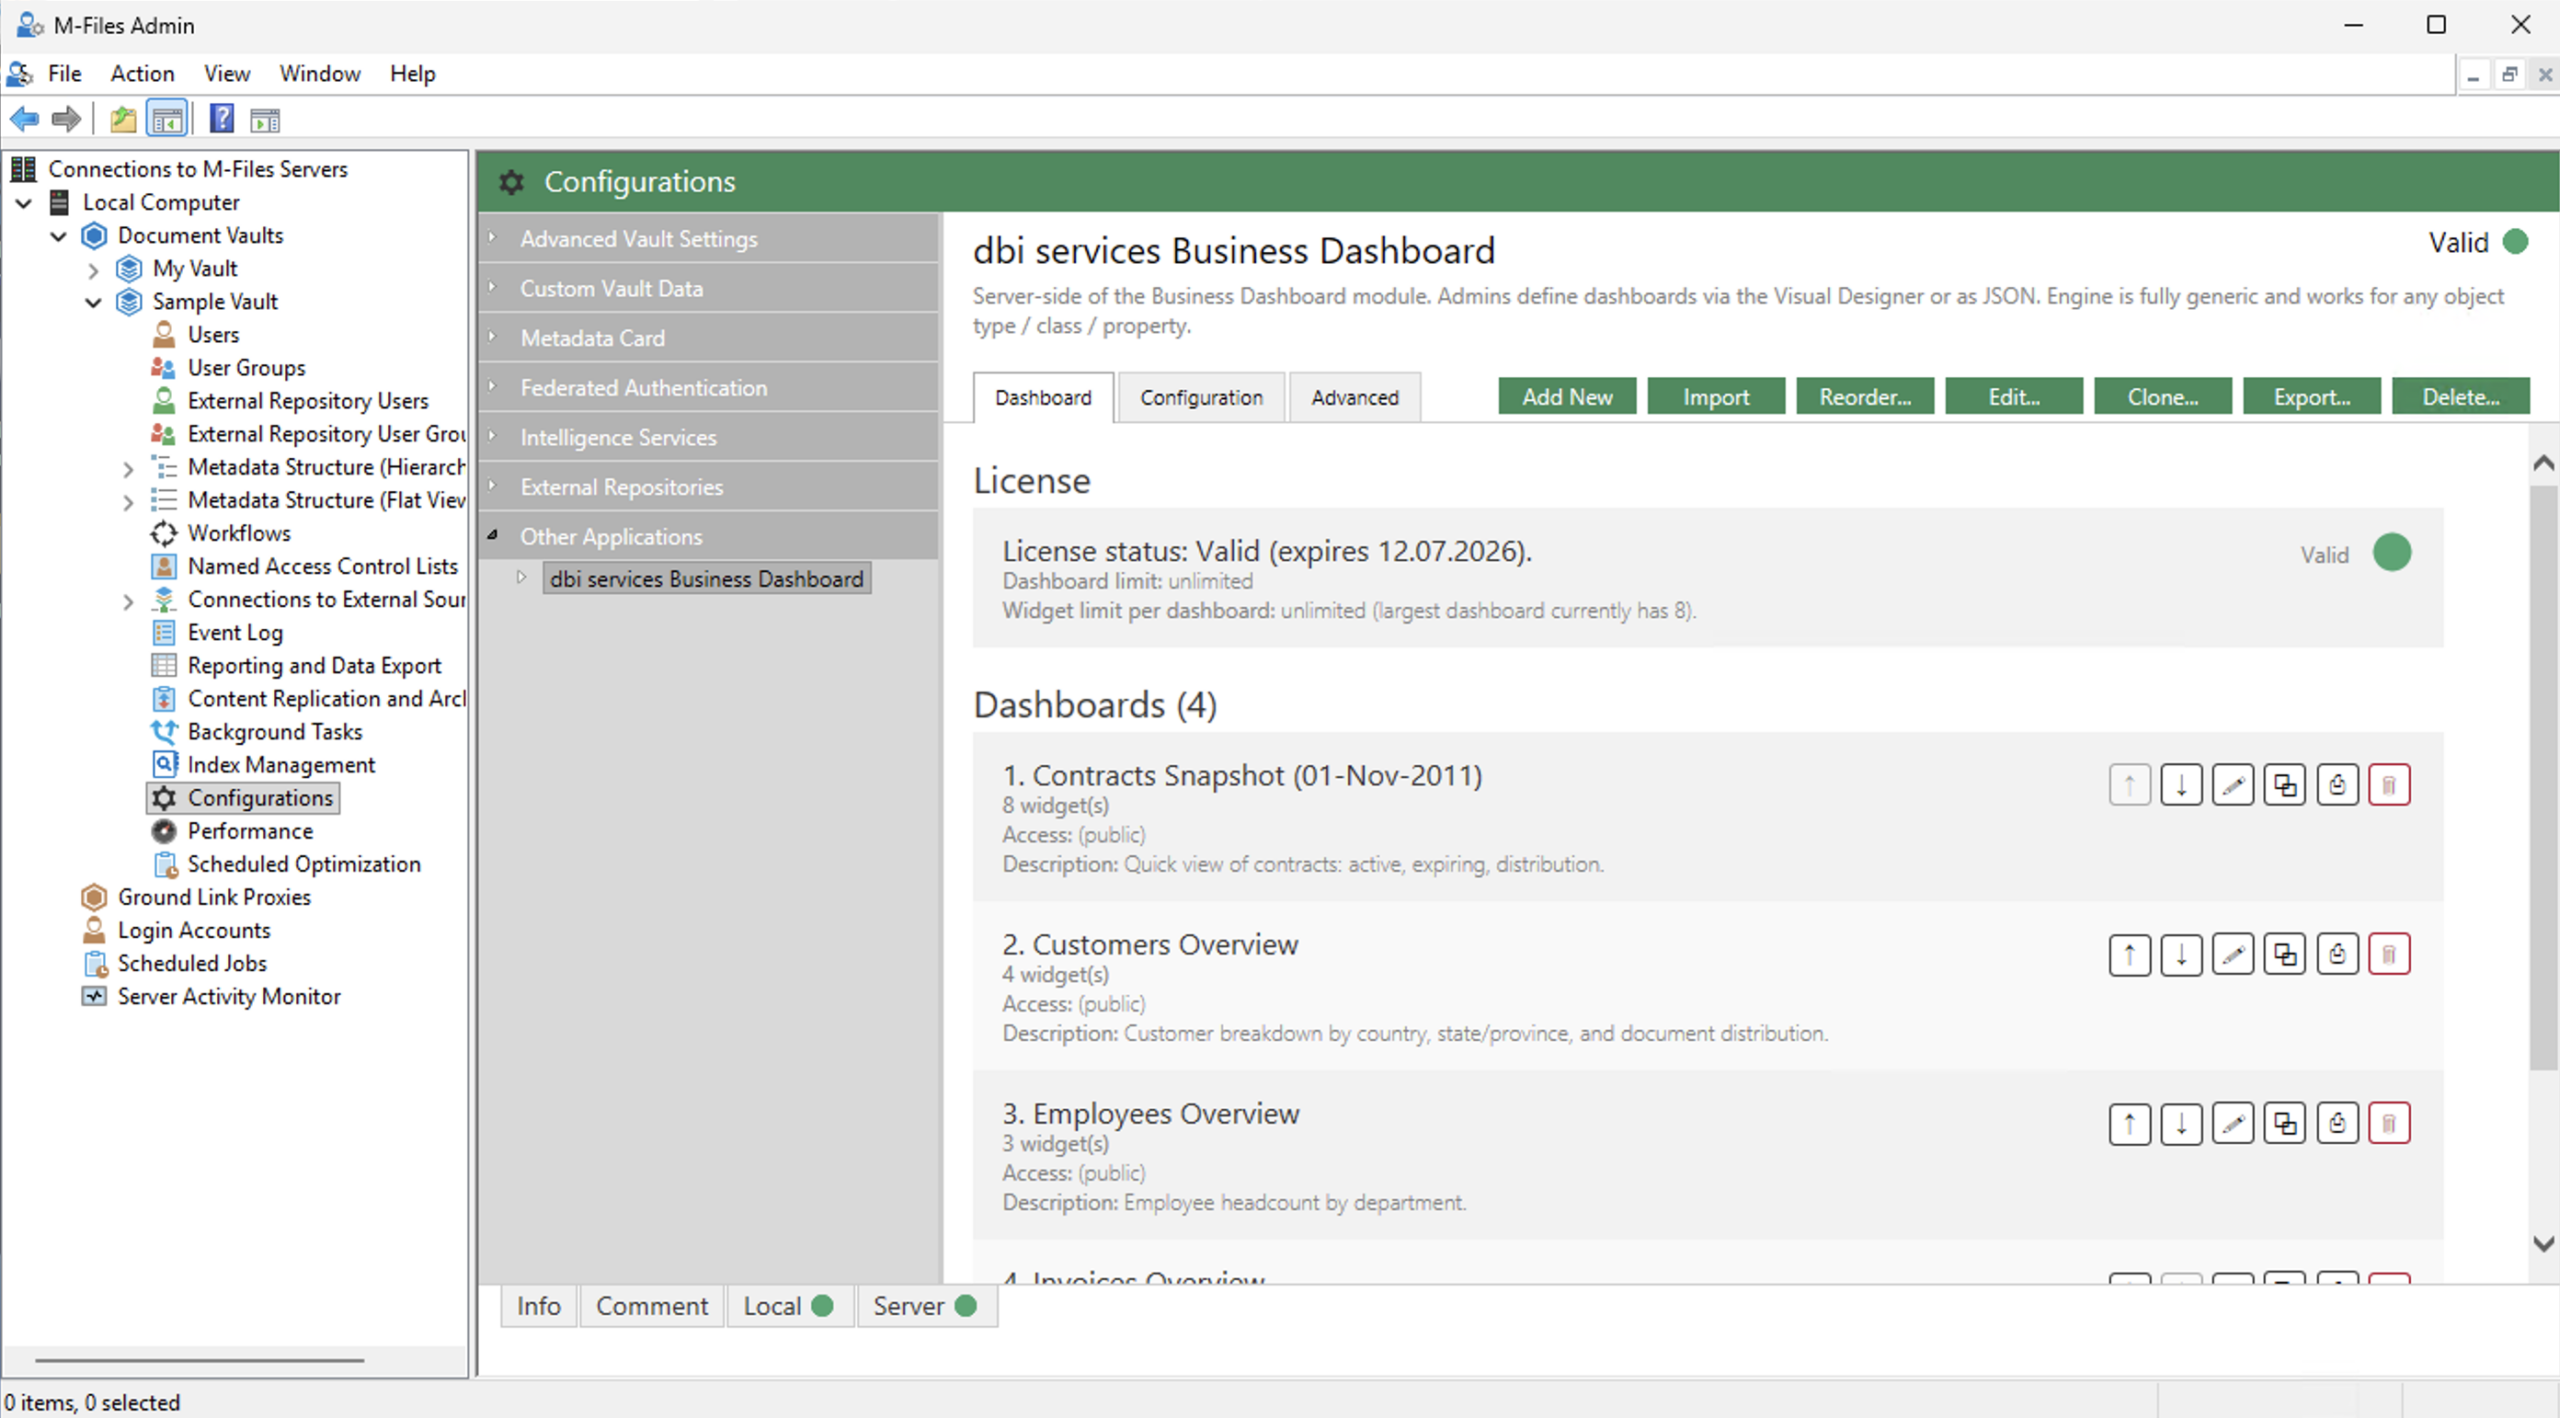
The first thing you will probably want to do is to look at the Configuration tab, that sits right next to the Dashboard one. This is where you can configure the Business Dashboard as needed.
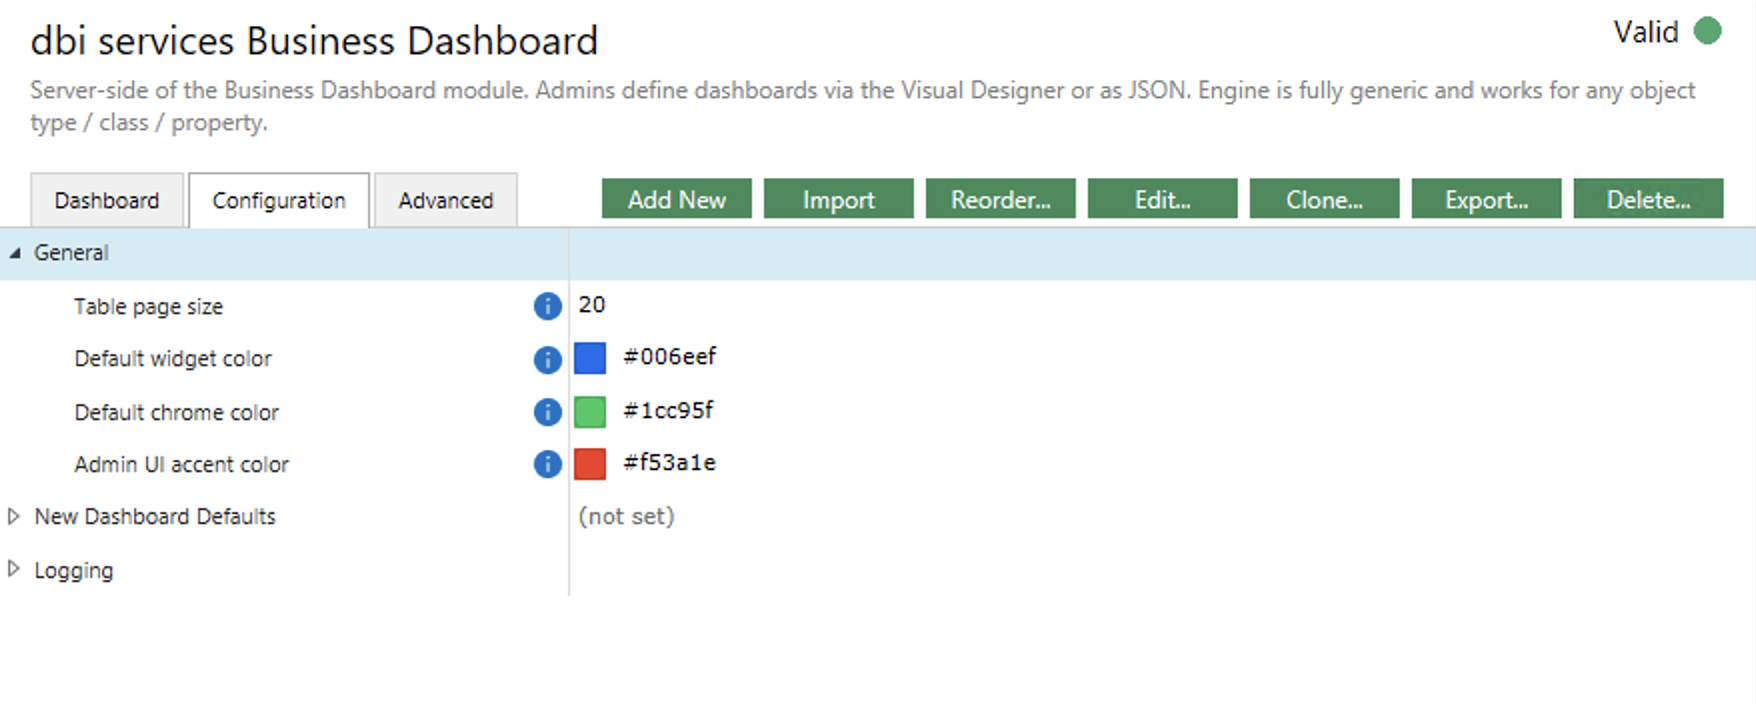
1.1. The Configuration tab – “General” settings
At the time of writing this blog, the General section of the configuration is rather short. It only contains 4 settings:
- Table page size: controls the pagination of all tables (list & drill-through modals), i.e. the maximum number of rows that can be displayed before a new page is required. (default: 15).
- Default widget color: controls the base color of the widgets (end-user side), like the number inside the kpiNumber, the gauge and its pointer, the table header, the line and area. It’s only the base color, so it still gets updated/overwritten by the display.thresholds parameter of each widget. (default: #006eef – the M-Files “standard” blue).
- Default chrome color: controls the base color for the “chrome” things (end-user side), for example the links shown inside the tables, to navigate to objects, as well as the spinner when dashboards/widgets are loading. (default: #006eef).
- Admin UI accent color: controls the base color for the buttons (admin side), like Save, Test Queries, etc. (default: #006eef).
Exactly like any other M-Files configuration items, as soon as you modify one of these values, the “Save” and “Discard” buttons appear so you can either persist and remove what you just changed.
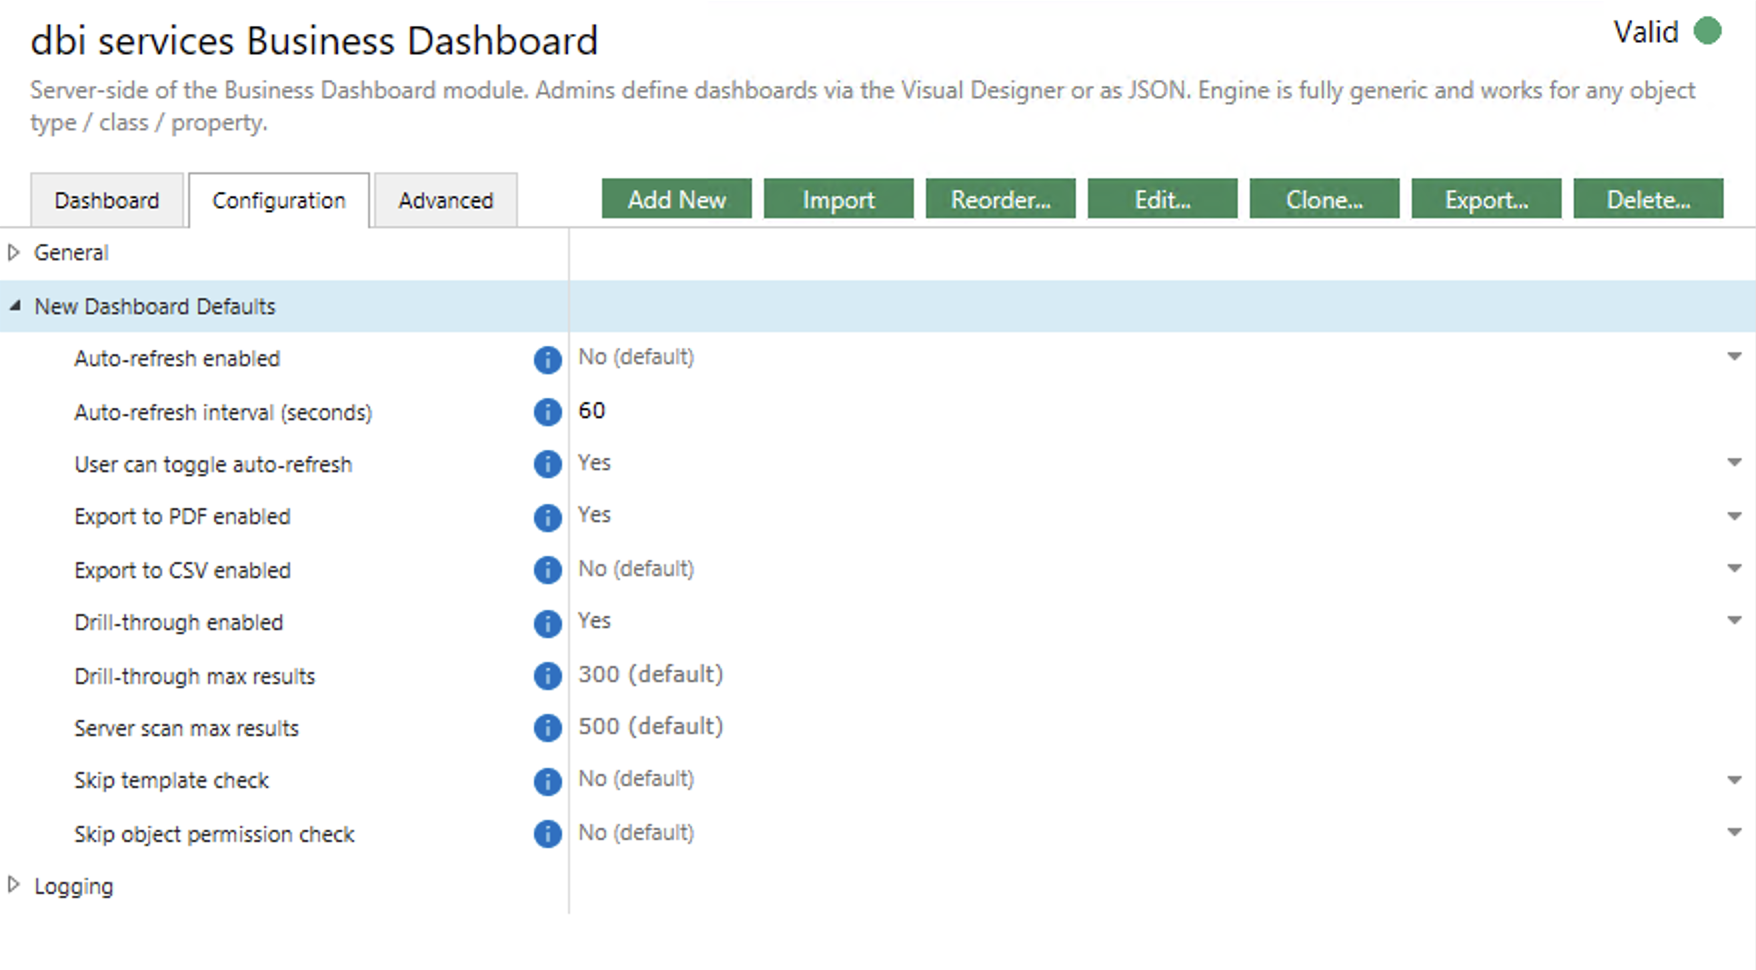
1.2. The Configuration tab – “New Dashboard Defaults” settings
The second section inside the configuration tab allows to overwrite the default settings for new dashboards. As I mentioned in previous blogs, a dashboard has around 10 configurable parameters, that controls things like which features are allowed, whether users can refresh or if it should be automatic, etc. All these parameters have a default value, which is usually “No” (disabled / do not bypass important checks).
This section will make it so that all dashboards created in the future will use your own personalized default values, so you don’t have to configure the same things over and over again. It doesn’t have any impact on already configured dashboards AND it doesn’t force anything. It is simply a replacement of default values, which means that you can still overwrite these settings inside each dashboards as required (because specific dashboards might have different needs).
- Auto-refresh enabled: controls whether the automatic refresh is enabled. (default: No).
- Auto-refresh interval (seconds): controls the interval between two automatic refresh. (default: 300).
- User can toggle auto-refresh: controls whether users can enable the automatic refresh. (default: No).
- Export to PDF enabled: controls whether the PDF export is enabled. (default: No).
- Export to CSV enabled: controls whether the CSV export is enabled. (default: No).
- Drill-through enabled: controls whether the drill-through is enabled, which also controls the navigation to target objects. (default: No).
- Drill-through max results: controls how many results will be paginated on drill-through modals. (default: 300).
- Server scan max results: controls how many results we can return when looking for objects. (default: 500).
- Skip template check: controls whether the “template check” are skipped. More on that later in this post. (default: No).
- Skip object permission check: controls whether the user’s ACLs are respected. More on that later in this post. (default: No).
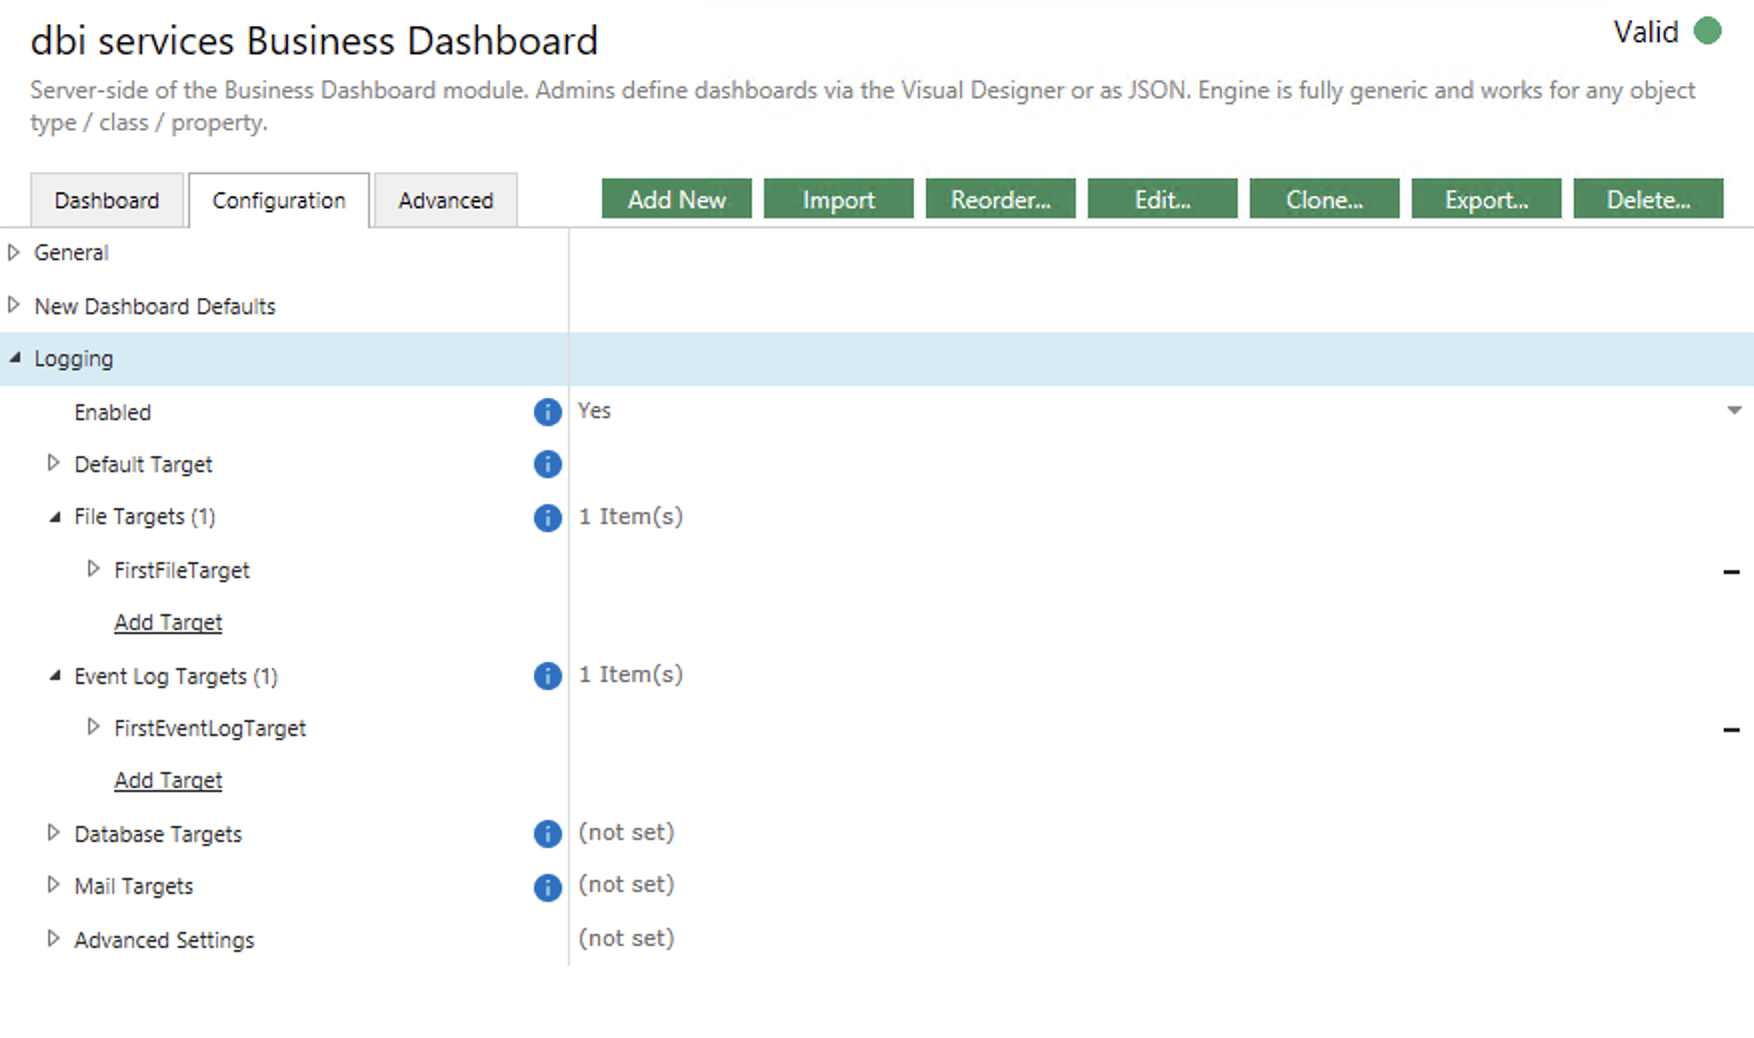
1.3. The Configuration tab – “Logging” settings
The third section contains all the standard M-Files logging configurations. In there, you can enable the global logging, then create some specific targets, like a file target (writing to a log file on the local file system), event log target (writing to the Windows Event Log), database target (writing to a specific DB), etc…
These are usual M-Files configurations, so I won’t describe them all, but in short, you only have to enable the global logging, defining a target with the appropriate log level and target-specific details as you see fit.
2. The dashboard list and action buttons
The Dashboard tab shows all currently configured dashboards (or nothing if you have none yet) in an alternating-row list. Each row contains additional details such as the count of widget inside this dashboard, the access details (whether it can be accessed by everybody or if it’s restricted to some people/groups only) and the description.
Each dashboard row also has a compact icon button bar for quick access: ↑ ↓ 🖉 ⧉ ⎙ 🗑 (move up / move down / edit / clone / export / delete) (It took me so long to find these icons!). These per-row buttons provide faster access to the most common operations without opening a selector modal from the top-bar buttons.
Speaking of top-bar buttons, you saw them already, but at the very top, you can see global action buttons available from any of the tabs:
| Button | Action |
|---|---|
| Add New | Opens the editor pre-filled with a blank dashboard template (Visual Designer mode by default) |
| Import | Imports one or more dashboards from a .json file (merges with existing) |
| Reorder… | Opens a modal page, with the list of all dashboards to re-order them |
| Edit… | Opens a selector to choose and edit an existing dashboard |
| Clone… | Duplicates an existing dashboard with a new UUID and a ” (copy)” name suffix |
| Export… | Opens a selector to choose and export one or all dashboards, to a .json file |
| Delete… | Opens a selector to choose and delete one or all dashboards, with a confirmation message |
More on these actions lower in this blog post.
3. The editor: two modes, one source of truth
When you click Add New or Edit…, the editor modal opens. At the top of the toolbar, two buttons toggle between the modes:
- [Visual] (default): the “Visual Designer”, a form-based designer with a canvas of widget tiles and a side configuration panel.
- [JSON]: the “JSON Editor”, a manual code box that allows you to write JSON.
The two modes are kept in sync at all times. Switching from Visual to JSON shows the current visual state serialized, switching back re-parses the JSON so that the Visual Designer is also up-to-date.
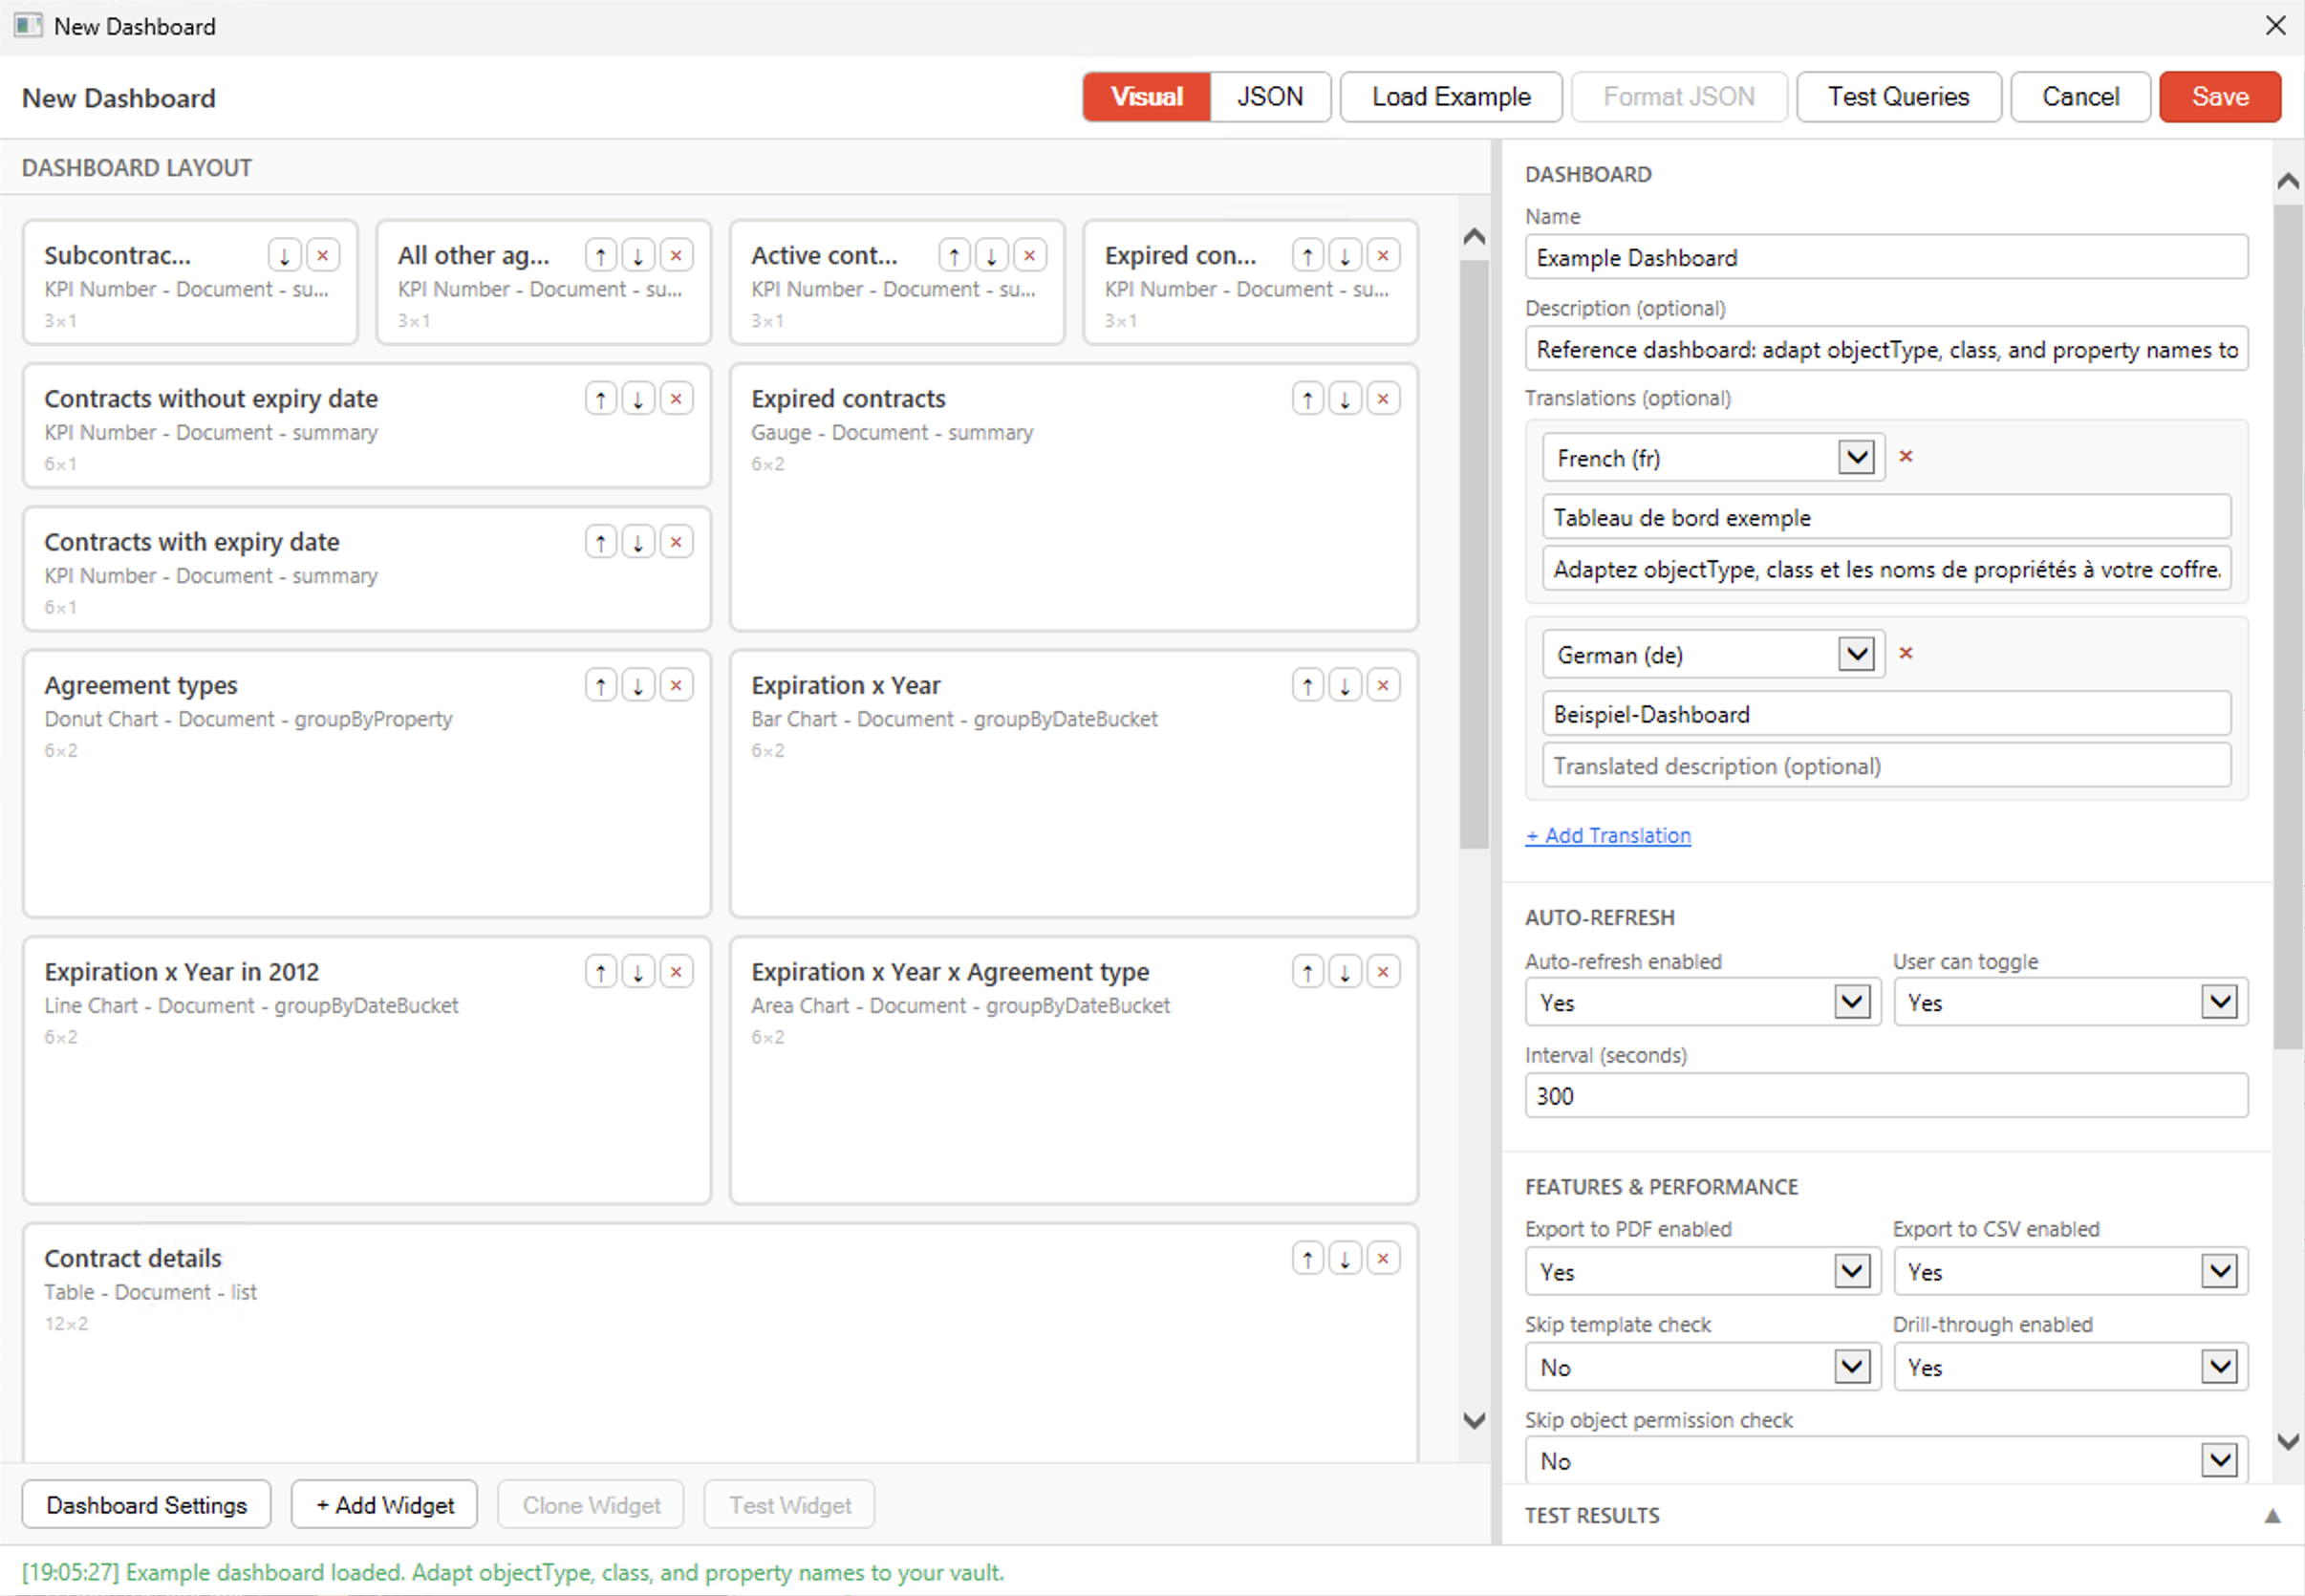
The editor is split into four regions:
- The top bar shows main buttons to switch between modes, load an example dashboard (to give you some ideas), format JSON (when in JSON Editor mode), test all widgets at once or save.
- The left panel shows either the widgets display in Visual Designer mode or the JSON code block in JSON Editor mode.
- The footer bar (anchored below the canvas) has four buttons, to show the dashboard settings, add a new widget, clone an existing widget or test a widget. There is also a small place below these buttons kept for status messages, to let you know when something was done or if there are errors, etc.
- The config panel (right panel) shows the editable fields. In Visual Designer mode, it shows dashboards and widget configurations. In JSON Editor mode, it shows the user and group pickers only. Both modes also includes the “Test Results” which contains execution/validation details.
3.1. Visual mode
As said, the left panel contains the widget display, with their title, type, aggregation, objectType. It also display quick action buttons such as up-down or delete, so you can quickly re-arrange the widgets and get the visual look&feel that you want. The right panel contains the dashboard settings by default (which we described above already). When a widget is selected, the right panel will then display these different building blocks:
| Section | Fields |
|---|---|
| Basics | Widget title, description, translations, type and size (Col Span (1-12), Row Span (1-12)) |
| Data Source | Object Type(s), Class and aggregation type |
| Filters | Add / remove filter rows, with their associated properties, operators, value type and value |
| Aggregation | The details of the aggregation, like grouping property, bucket size, reducer, reducer property, series property |
| Display | Any possible display options such as thresholds (coloring), unit, min / max, decimals (0-9), smooth or bar layout |
With this Visual Designer, you are guided by selecting things one by one. You don’t see ALL options right from the beginning, depending on what you select, only what is possible will be offered, so you can focus on what makes sense for you.
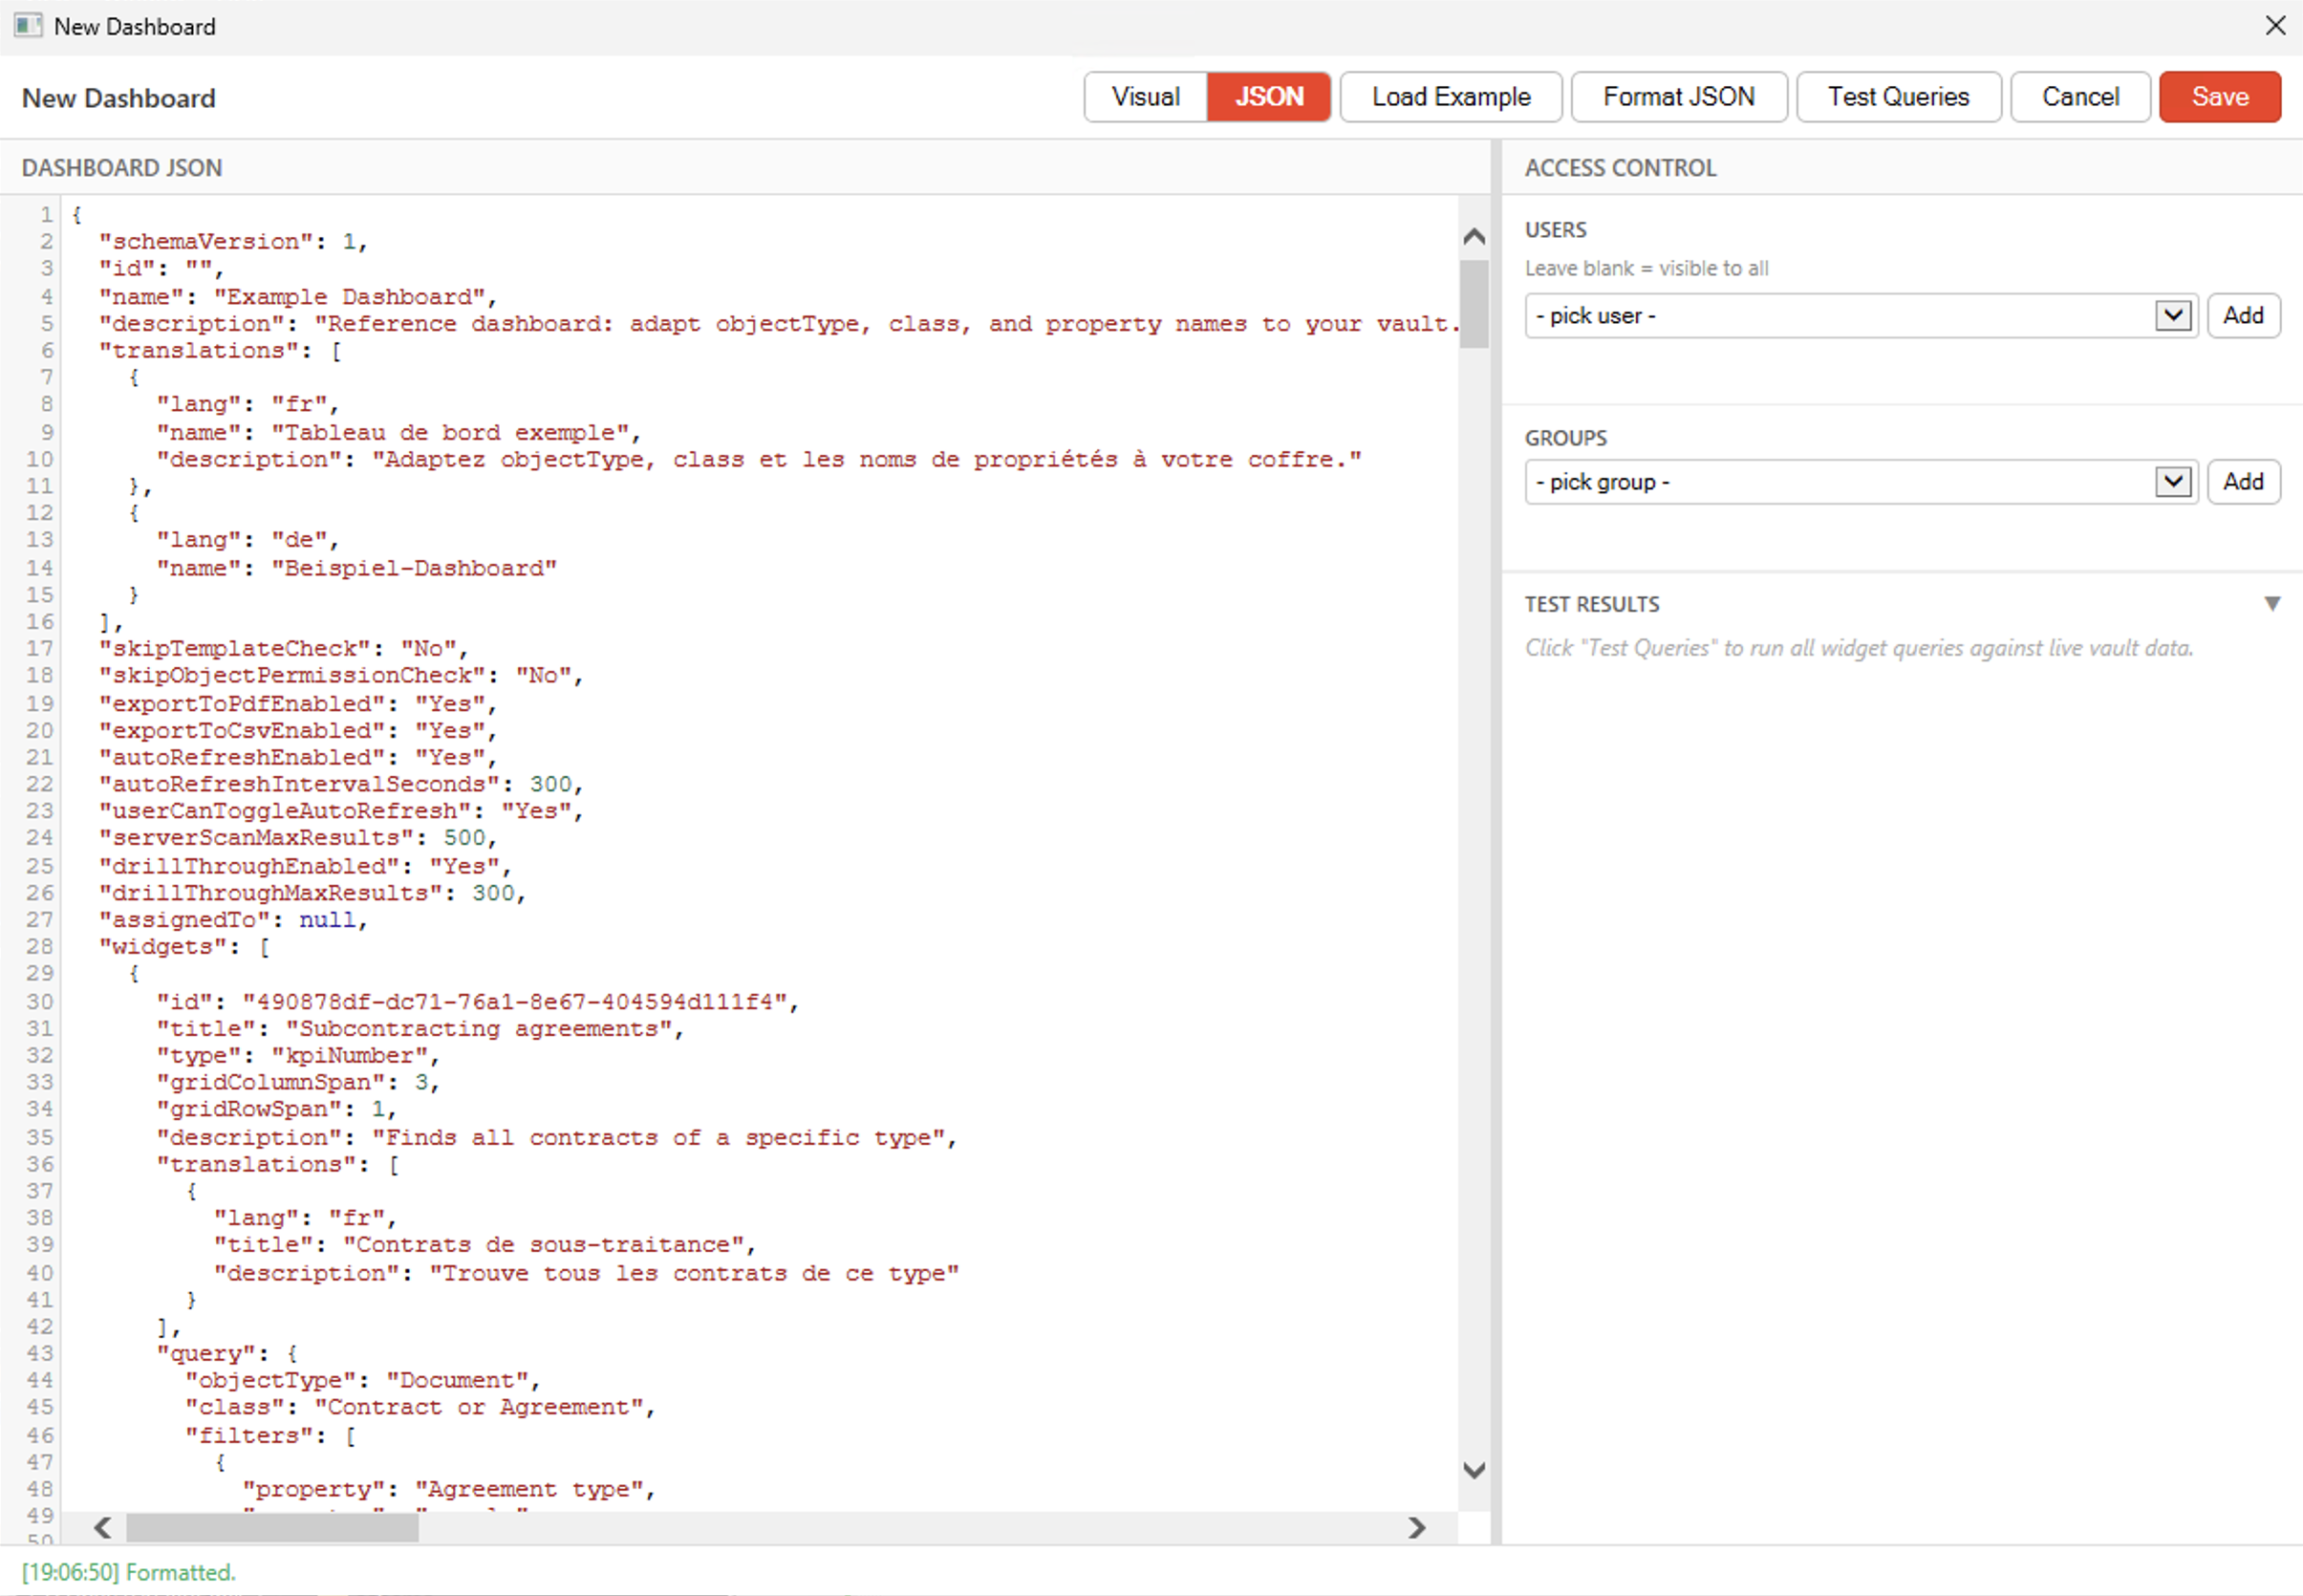
3.2. JSON mode
The JSON Editor is simply a code box which allows you to enter JSON. It shares the top-bar buttons with the Visual Designer, the only difference being the “Format JSON” one that is enabled only when in JSON mode.
I might extend this feature later, but for now there is no completion feature, it simply has a bit of highlighting so you can spot errors easily and allows for code drag-and-drop.
4. Validation
4.1. The two-stage validators
Whether you click on Test Queries (all widgets), Test Widget (1 widget) or Save and whether you are doing it from Visual or JSON mode, the engine will run a 2-stage validation of what you currently configured.
4.1.1. Stage 1
The first stage is simply a structural one. For example, are all mandatory fields present, are known values (e.g. widget types) within the accepted ones, etc. This is very fast and it doesn’t require a connection to the vault, so that we can already surface global issues.
Note: Only the “Import” feature bypasses the stage-2 validation and only performs a structural check. When using the import feature, we kinda expect that the JSON was exported from another vault and therefore if it existed inside a previous environment, it means that it is a valid dashboard. Doing the stage-2 validation on each import would considerably slow it down (especially if you import 10, 50 or even 100 dashboards at once).
4.1.2. Stage 2
The second stage is much more complex and it will verify if you made any mistakes by really checking what’s available inside the vault. This will mark typos such as wrong object types, classes or properties. It will also try to resolve value lists items that you references, to make sure they are indeed present. This is obviously slightly slower, but still completes within a couple seconds for most dashboards. It also gives you a good idea of how fast this dashboard will load for end-users, since it’s actually executing all queries.
Note: For Test Widget, the engine will only test one specific widget, as said earlier. Therefore, it automatically adds a valid dashboard structure around it so it can pass the stage-1 validation for the dashboard level. Only stage-1 validation of the widget level is tested and the query execution for the phase-2, obviously.
4.2. Errors and warnings
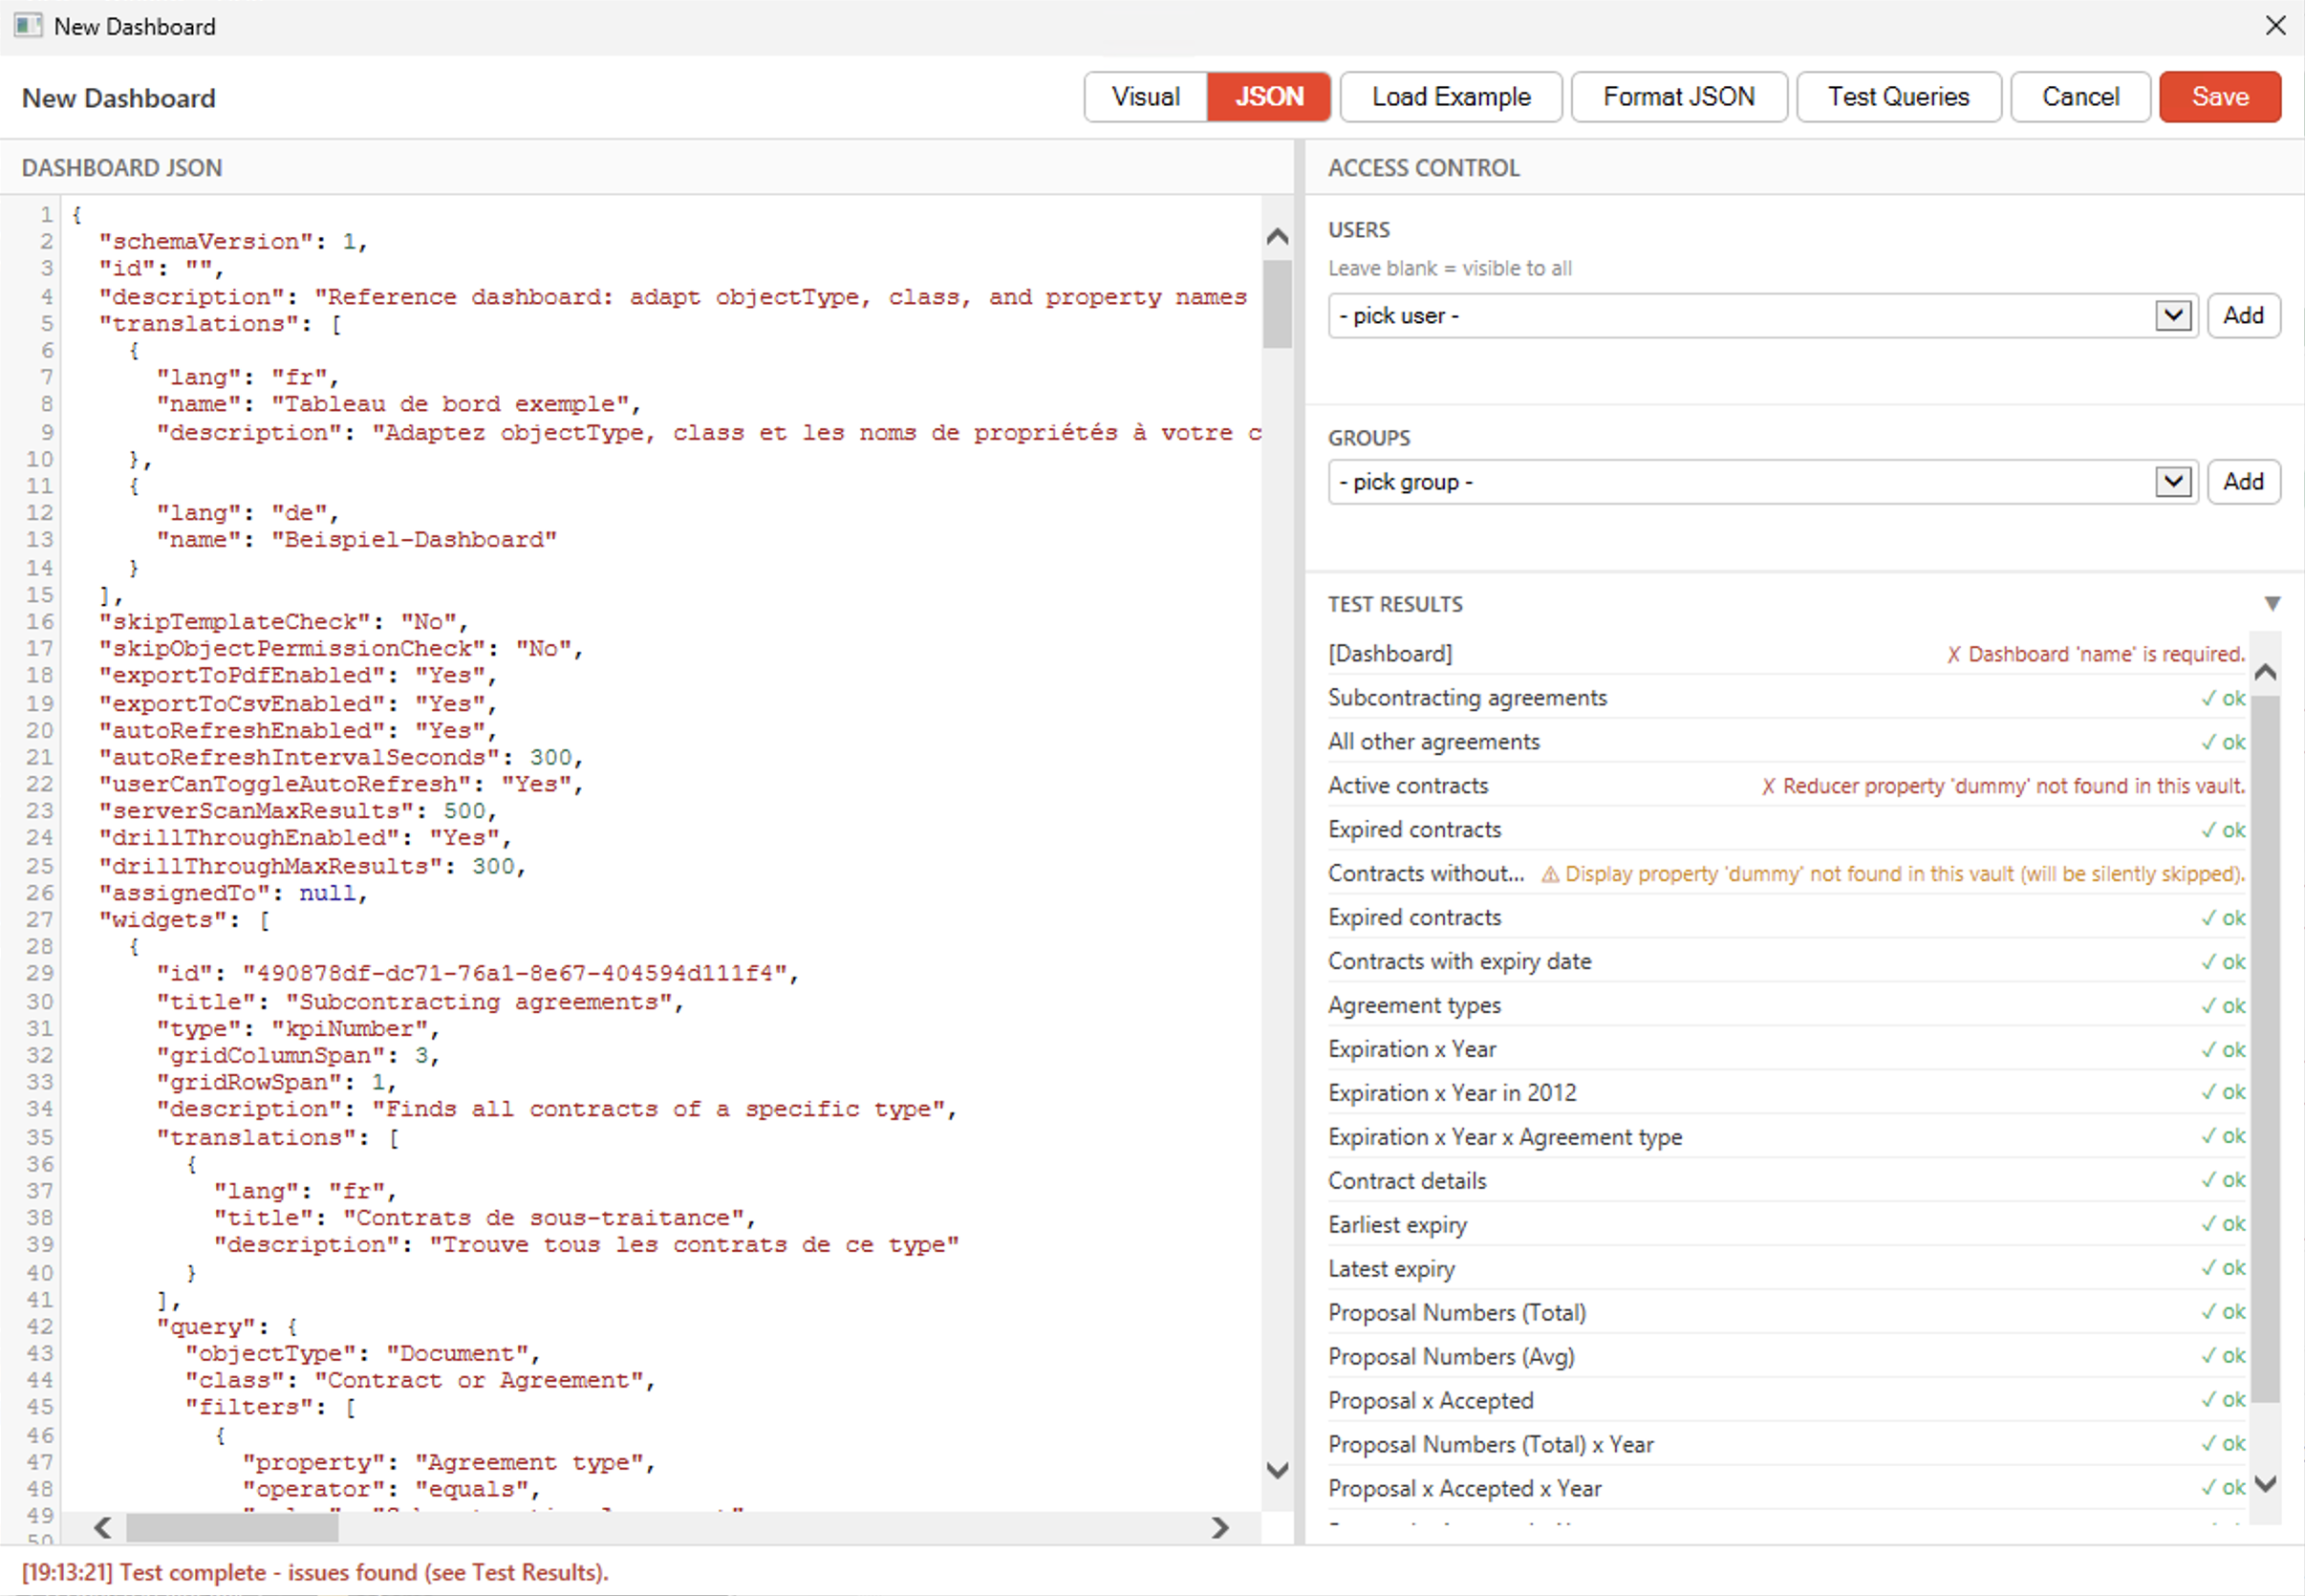
The Test Results panel shows three possible statuses per widget:
- OK: the query succeeded and the result is renderable.
- Warning (amber): the query succeeded but the result will probably not be rendered the way you would like to. A common occurrence is a date-valued reducer on a chart widget, where the message will tell you to switch to kpiNumber, table, or gauge.
- Error (red): the query failed. The message tells you which property name or class name to check or change.
Note: A warning will still allow the Save to complete, because even if it might not render, a placeholder widget will replace the expected chart. On the other hand, an error will prevent the Save operation because we shouldn’t persist something that is structurally or fundamentally wrong. Here is an example from the Example Dashboard where I specifically introduced some mistakes:
5. Import and Export
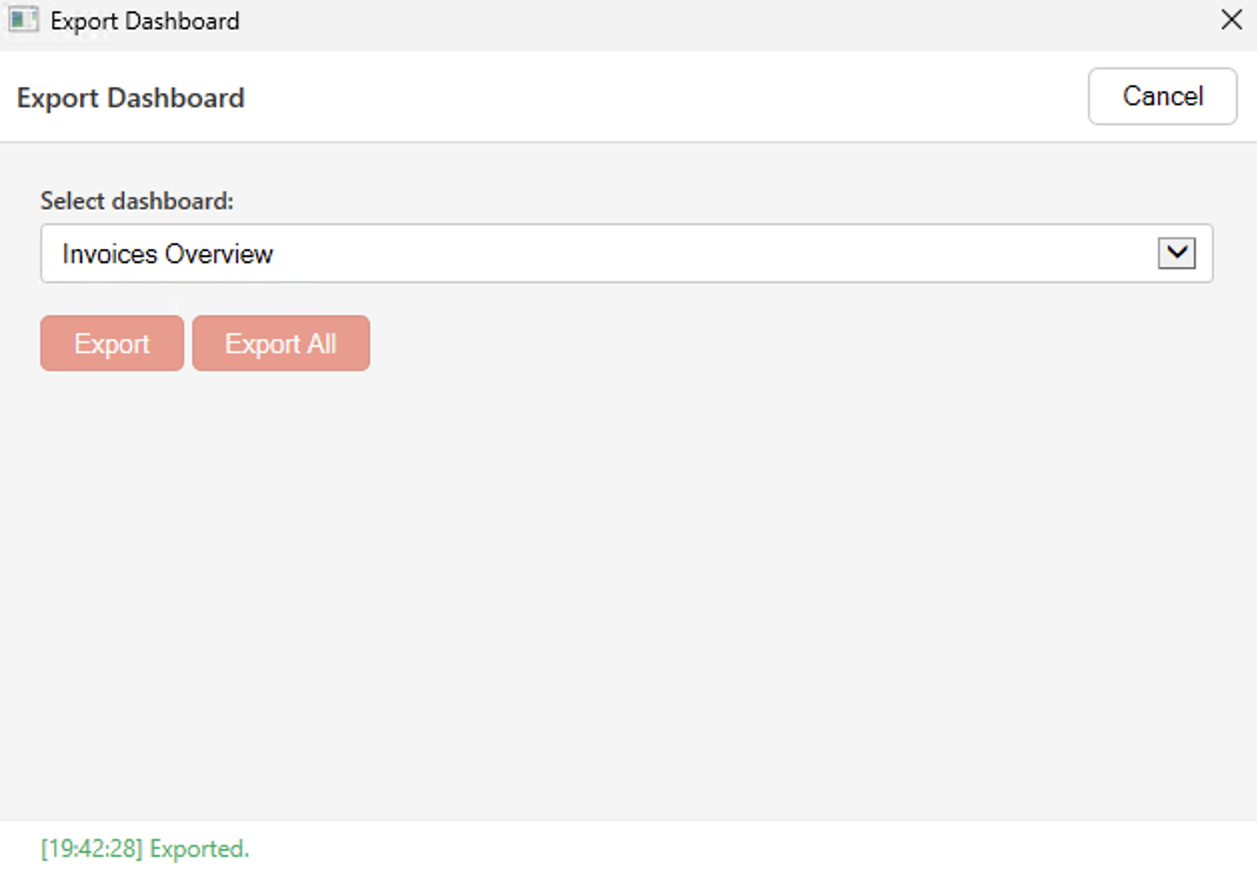
Dashboards live in the vault’s Named Value Storage (NVS). To facilitate transfer from DEV to QA/INT to PROD or any other environments you might have, an import/export feature was added on the M-Files Admin. To use it, simply click on the Import or Export… buttons.
First, the Export… one, open a prompt so you can select which dashboard you would like to export. On that prompt, there is also a button to Export All. If you select a single dashboard to be exported, the JSON file generated will have, by default, the name of the dashboard (you can set the name that you want, of course). If you chose to export all, then the name will simply be “dashboards-export.json” and inside, you will find an array of dashboard definition.
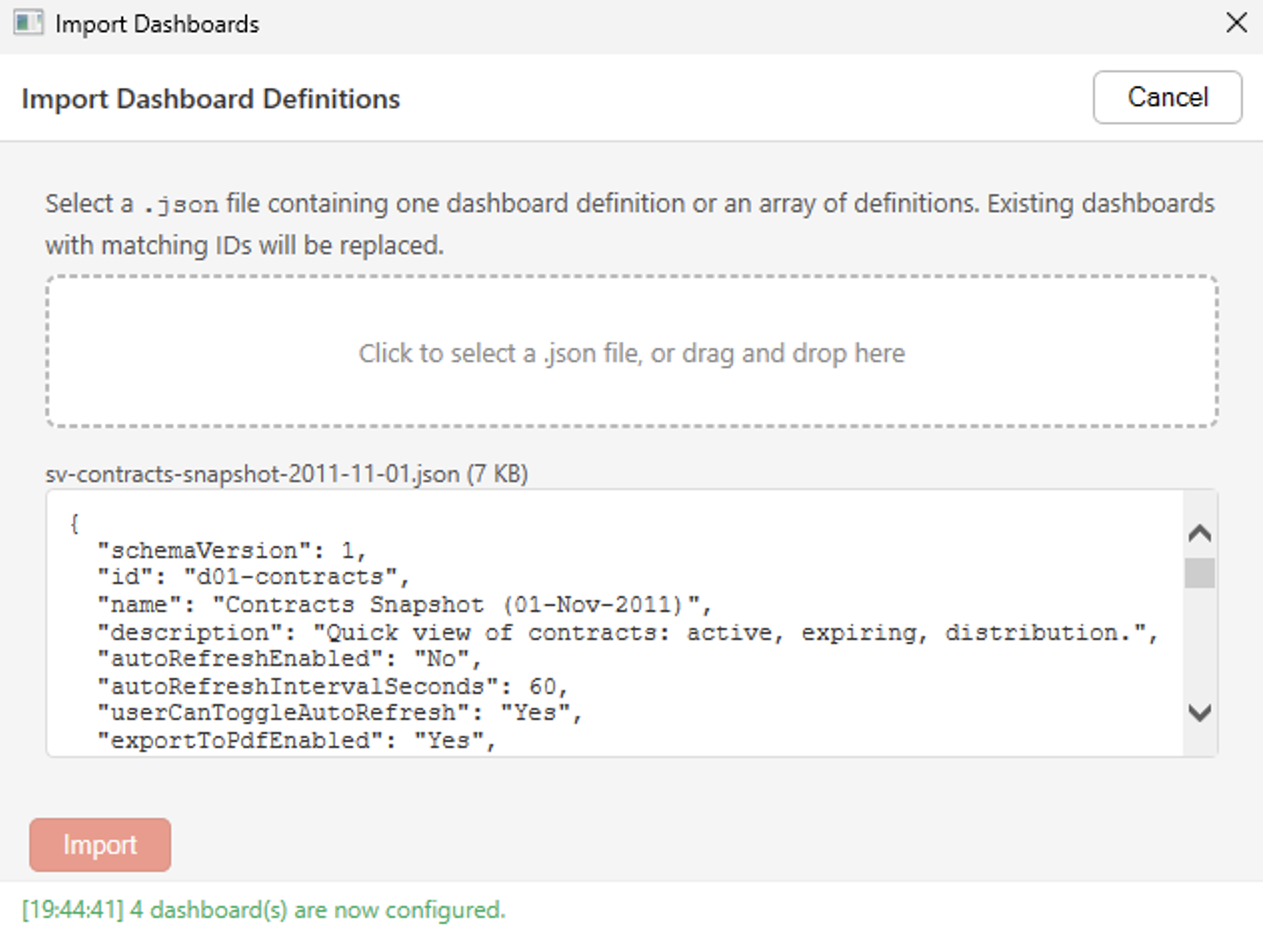
Once it has been exported, you can then Import it somewhere else (or on the same vault, it will merge it with existing dashboards – that’s why IDs are important!). Another prompt opens and you can then select a file (through Windows Explorer) or you can also drag-and-drop JSON to it. Its content is then displayed inside the prompt so you can take a look. Once you hit the import button at the bottom, it will quickly validate the dashboard definition and if everything is good, it will be imported into the vault.
6. The Reorder and Clone modals
Two smaller actions but these are still worth mentioning because they fix small but real pain points. The Reorder… one allows you to use the up-down arrows – same as from the dashboard list shown in the default Dashboard tab. But you have access to another facilitator with the global button: dashboards are numbered with a small text box that you can update. For example, if you have 5 dashboards, the last one will have a small text box with a “5” inside. If you update that value to “1”, then this dashboard will automatically become the 1st one. This allows for faster re-ordering than clicking 4 times on the arrow-up icon, especially when you have 50+ dashboards to manage.
If you have a good idea of what you want to build and you know that one of your dashboards is already pretty similar, then instead of recreating everything from scratch, you can use the Clone… feature. It allows the duplication of an existing dashboard into a new one. The new one will use new IDs for both the dashboard and all the widgets, and to be able to differentiate them, the name will have a ” (copy)” suffix. I see you coming – if you duplicate the same dashboard multiple times, it will be ” (copy 2)”, then ” (copy 3)”, etc.
7. Access control – two-level model
Access control in the Business Dashboard works on two distinct levels:
| Level | Field | Default | What it controls |
|---|---|---|---|
| Dashboard visibility | assignedTo | Public | Who can see and open the dashboard |
| Per-object data filtering | skipObjectPermissionCheck | “No” (= check = ACLs are respected) | Whether widget data respects each user’s individual M-Files object ACLs / permissions |
The two are independent. assignedTo says “you are allowed to open this dashboard”. skipObjectPermissionCheck says “once you are inside, do widgets show you everything or only what your own permissions allows you to see and read”.
7.1. assignedTo – who can open the dashboard
By default (no assignedTo field or an empty array), a dashboard is visible to everyone who has access to the vault. To restrict the access, you can define either a list of users or groups:
"assignedTo": {
  "users": ["Morgan.Patou"],
  "groups": ["Finance Team", "Management"]
}
Access is granted to any user who matches any entry (OR semantics), i.e. part of the users list or part of any of the group from the groups list.
7.2. skipObjectPermissionCheck – what data shows up
By default (“No”), M-Files permissions will be respected, so you cannot see things that you aren’t entitled to see. However, there are valid use cases where you would need to specifically bypass object-level permissions.
For example, you probably don’t want all your employees to see all the HR documents, all the contracts, etc. However, there are often KPIs that could be rendered “Public”, or at least given to a broader audience than the people that originally have access to these objects. Maybe you would like to share some executive or management reporting KPIs, some Sales Performance details, or some Security Information.
That is entirely up to you and, in addition, you control whether end-users can use the drill-through or not and what metadata the drill-through should show (if anything at all). Again, it’s not because you show KPIs that users will be able to find and read classified documents. M-Files permissions on the objects themselves (preview its content, listing all metadata, downloading the file, etc.) will always be respected. What the Business Dashboard allows is fully configurable, so there are no real security concerns.
When to use each:
- “No” (default): when different users should see different numbers based on their own M-Files ACL.
- “Yes”: when every authorized viewer should see identical numbers and performance matters (typical for overview dashboards that don’t go into details). Combine with assignedTo to restrict who can open it.
8. Performance
I already mentioned them in earlier posts, but I think it still makes sense to summarize it all again here, since we are talking about the Admin side of the Business Dashboard. There are multiple parameters that have performance impacts. Some of them are very low, some aren’t.
8.1 Performance gains
These are the things that will have either no negative performance impact or even show performance gains:
- exportToPdfEnabled / exportToCsvEnabled: these two parameters are similar in the sense that they only enable one specific feature and it has no performance impact, since it runs fully on client side. All the data is already available in the client’s dashboard, so it has no impact on the server.
- skipObjectPermissionCheck: by default, it will execute ACLs checks to ensure users only see objects they are entitled to. The way I implemented that means that whether you are doing server-level queries or user-level queries has absolutely no impact on the performance. In fact, it might be even faster to execute the ACLs checks, since you might return less objects that what the server would have access to. Therefore, the performance impact is null or slightly positive.
- objectType / class / count reducer / native filters: adding a restriction on class and adding native filters will mean less results to be fetched and processed. As previously said (c.f. Post 5), for optimal performance, make sure to restrict the objectTypes / class and apply native filters as much as possible. Therefore, adding these will definitively bring performance gains.
8.2. Potential for Medium / High performance impact
Depending on how you use them, these settings can have very low or very high impact on the performance of the Business Dashboard:
- autoRefreshEnabled / autoRefreshIntervalSeconds / userCanToggleAutoRefresh: control the refresh of widgets/dashboards. The impact depends on multiple factors, like how many users, widgets, objects fetched, etc… These will increase the “regular” load on the server, not really impact the loading speed… The performance impact can go from very low (e.g. refresh every 5 minutes with low-demanding widgets) to pretty high (e.g. refresh every 15 seconds with 10’000+ objects widgets)…
- serverScanMaxResults / drillThroughEnabled / drillThroughMaxResults: define the maximum results for the widget or the drill-through. When hit, a Partial results badge appears, to show results may be incomplete. These are basically fail-safe/lifeline, to make sure widgets do not try to retrieve the whole vault’s content. The performance impact will be important if you disable this (“0” = unlimited results) and if you try to fetch 100’000 objects.
- skipTemplateCheck / non-count reducers / post-filters: all these parameters means that there is a need to fetch additional metadata from the vault, for all objects. If you want to execute the template check, apply a non-count reducer on a property or a post-filter, you will first fetch all objects, and then, for each of them, fetch their associated metadata. As far as I culd see, M-Files doesn’t allow to return both objects and their metadata at the same time. The performance impact will be grow with the number of objects you fetch and need to process.
Note: The performance isn’t bad. There are a few tricks I implemented to make sure the performance stays pretty good, so you can load a dashboard fetching 5’000+ objects in less than 1.5 seconds, with the right configuration.
11. Wrap-up
The Admin tab is the place administrators will spend the majority of their time. The Visual Designer is there to lower the complexity of creating and managing dashboards. Even a JSON-averse administrator can build a full dashboard without ever opening the JSON editor. However, it is still available for power users that feel comfortable with it, as it gives them the flexibility, quick copy/paste, and bulk-edit comfort they can expect.
The next, and probably last, Post 8 will walk you through building a complete Contracts dashboard on the M-Files Sample Vault. I will use the Visual Designer only, so you can follow along and adapt it to your own vault.
Want to know more about this Business Dashboard? Contact us and we will be happy to showcase it on M-Files.
![Thumbnail [60x60]](https://www.dbi-services.com/blog/wp-content/uploads/2022/08/MOP_web-min-scaled.jpg)
![Thumbnail [90x90]](https://www.dbi-services.com/blog/wp-content/uploads/2022/08/GME_web-min-scaled.jpg)
![Thumbnail [90x90]](https://www.dbi-services.com/blog/wp-content/uploads/2022/08/ATR_web-min-scaled.jpg)