Skip to content

Grafana

Setting Up Prometheus and Grafana for a Patroni cluster

In today’s data-driven world, monitoring and visualizing the health and performance of your database clusters is a must. With tools like Prometheus and Grafana, you can gain valuable insights into your PostgreSQL Patroni setup, ensuring its smooth operation and proactive maintenance. In this guide, we’ll walk you through the steps of installing and configuring Prometheus and Grafana to monitor your… 

Zabbix in the Middle of Prometheus and Grafana

In this blog post, I will show you how to gather metrics from a OpenTelemetry interface from a Zabbix server and how to display Zabbix data in Grafana. Why Should I do that? First, you might wonder why should you even do that? Dashboards capabilities of Zabbix are nice and evolving but is not as complete and customizable as Grafana… 

Redis: Redis X Grafana fix the “get instance error” message

Introduction Last time, we have seen how to add a Redis plugin to Grafana in order to monitor and generate graphs and charts for your reports or analysis. During this configuration you may encounter some issues or miss some steps that will end to an error message. Today we will see some typical error message and who to fix it… 

Display Load Test Results in Grafana

Lately, I played a lot with the de facto standard for monitoring visualization (ie. Grafana). It can display your data with great dashboard capabilities. On the other side, JMeter, a highly customizable load test tool, has visualization possibilities, but with an old-school aspect and not so dynamic. So, I wondered, would there be an option to get both together to… 

Migrating Monitoring Data from Prometheus to VictoriaMetrics

Now that we know the advantages of VictoriaMetrics over Prometheus (see my previous blog post), we have to find a way to migrate data between the two. If you have the default retention set in Prometheus (ie. 15 days), it is probably not a strong requirement to keep them in a new VictoriaMetrics setup. Nevertheless, I will detail here how… 

Predict the Future with Prometheus

As I am focusing on monitoring subject, I was wondering if it is possible to set alarm based on prediction instead of simple thresholds. Dynatrace has predictive anomaly detection feature, but in this blog, I want to test if on-premises solution could help on this. We will see what Prometheus is capable of. Alarm and Threshold When we set up… 

Kafka Monitoring in Prometheus

Enabling monitoring on Kafka with Prometheus/Grafana is not more difficult than others exporters I configured in my previous monitoring in Prometheus blogs. Let’s see this together. JMX Exporter vs Kafka Exporter As Kafka is a Java based application, it would have been possible to monitor it with JMX Exporter as I did for Apache Tomcat. But this time, I will… 

Observability vs Monitoring

Both words, observability and monitoring, are often used interchangeably and without taking care of the difference. Monitoring Monitoring is alerting based on known, predefined metrics and log patterns. Events Examples of events are: Last example threshold could even be improved to consider the partition size as 10% remaining space is obviously not the same for a 1 GB partition (100… 

Nginx Monitoring in Prometheus

Following my two previous blogs about monitoring, I will now focus on Nginx. Nginx Inc provides an exporter with it’s code: https://github.com/nginxinc/nginx-prometheus-exporter As Nginx cannot run a web application as WebLogic or WildFly can, exporter will be another process. Nginx Configuration To enable metrics for Nginx, we must use stub_status directive in a server or location context of the configuration.… 

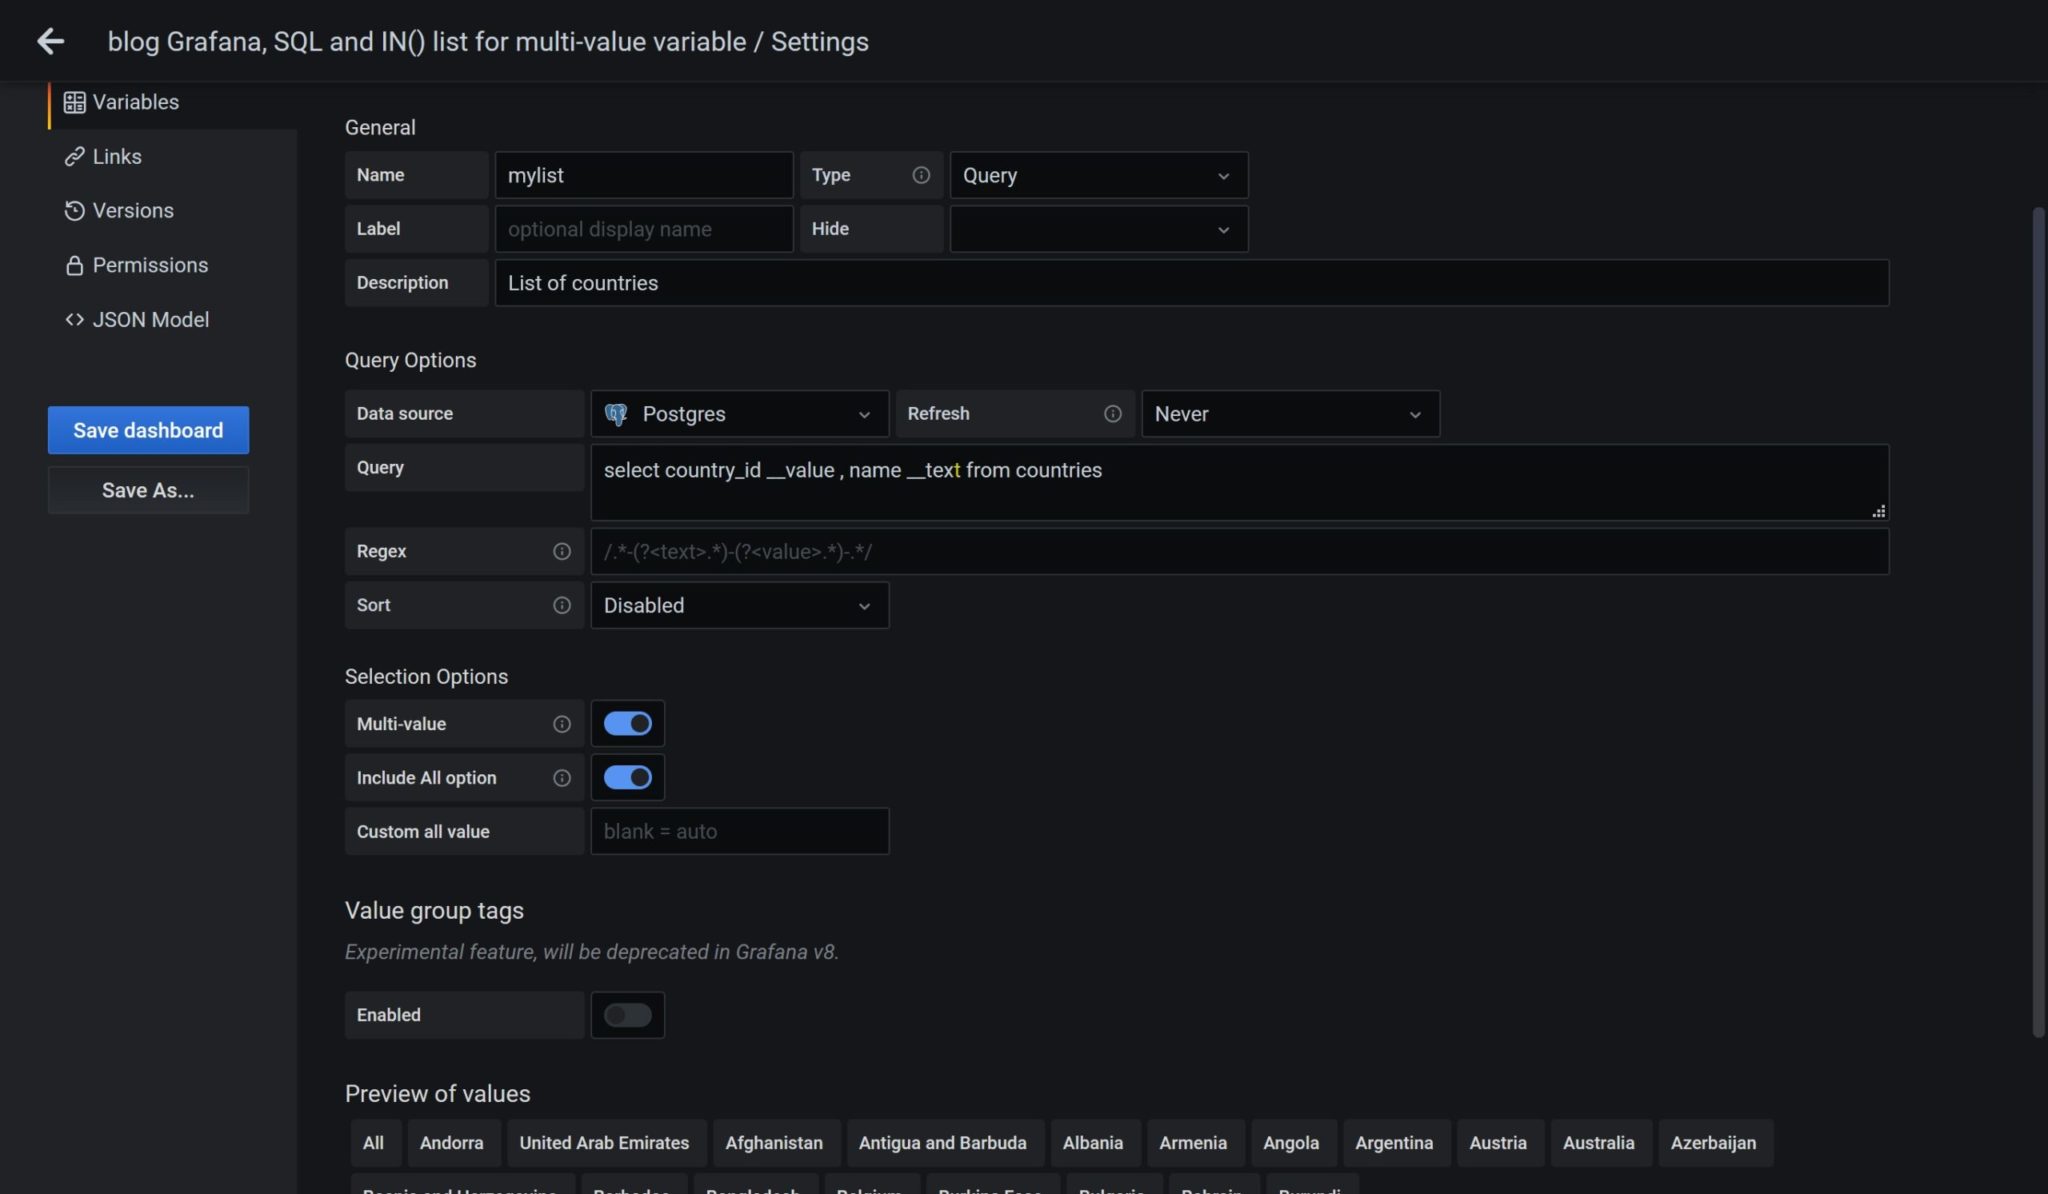
Grafana, SQL and IN() list for multi-value variable

By Franck Pachot . I’ve recently looked at Grafana. Pros: it is really nice, I mean aesthetically. If you want to build a dashboard for your boss, or put it on a large screen in the open space, that’s beautiful. Cons: not mature. I’m working for years with technology that works. When I have a problem, I find the solution…