Now that we know the advantages of VictoriaMetrics over Prometheus (see my previous blog post), we have to find a way to migrate data between the two. If you have the default retention set in Prometheus (ie. 15 days), it is probably not a strong requirement to keep them in a new VictoriaMetrics setup.
Nevertheless, I will detail here how to proceed.
Note that I will keep Grafana for the display part as it is compatible with both monitoring solutions.
Overview
I will proceed as follow:
- Take a snapshot on Prometheus
- Import data in VictoriaMetrics with vmctl
Snapshot
To be able to trigger a snapshot of Prometheus data, I have first to enable admin API. This is done by adding --web.enable-admin-api flag to startup command. Once that’s done, triggering a snapshot is as easy as a curl command with POST http method:
$ curl -XPOST http://<PrometheusIP>:9090/api/v1/admin/tsdb/snapshot
{"status":"success","data":{"name":"20230608T150754Z-7c864ce21dbb79c5"}}
Result is json formatted which includes status and the name of the folder created inside data/snapshots subfolder of Prometheus:
/prometheus $ ls -1 data/snapshots/
20230608T150254Z-3466e689e07d12cd
20230608T150754Z-7c864ce21dbb79c5
20230608T152459Z-66050f91e5b82015
20230608T153146Z-2b08c6e61aa9ef66
Each snapshot is named with date and time of the snapshot and a random number.
vmctl
vmctl is tool provided by VictoriaMetrics which will help us to read the snapshot and write it into VictoriaMetrics TSDB. I was looking for this tool inside VictoriaMetrics container. Unfortunately, it is not in it, but this is to make server image lighter. vmctl has its own docker image.
Command looks like this:
docker run --rm \
  -v ./data/snapshots:/snapshots/ \
  -it victoriametrics/vmctl:stable \
   prometheus \
  --prom-snapshot=/snapshots/20230608T153146Z-2b08c6e61aa9ef66 \
  --vm-addr http://<VictoriaMetricsIP>:8428
As it is a container image I have to provide few parameters:
- Line 2: Map the volume where snapshots (line 2) are
- Line 3: -it is required as vmctl requires confirmation if it must proceed with import or not
- Line 4: Is the type of import
- Line 5: Path to the snapshot inside the container
- Line 6: I have to provide the VictoriaMetrics URL to import data
Running the command shows content of the snapshot and waits for user confirmation:
Prometheus import mode
Prometheus snapshot stats:
  blocks found: 1;
  blocks skipped by time filter: 0;
  min time: 1686227907429 (2023-06-08T12:38:27Z);
  max time: 1686238305983 (2023-06-08T15:31:45Z);
  samples: 1306417;
  series: 3591.
Found 1 blocks to import. Continue? [Y/n]
After confirming:
VM worker 0:→ 644619 samples/s
VM worker 1:→ 645300 samples/s
Processing blocks: 1 / 2 [██████████████████████▒▒▒▒▒▒▒▒▒▒▒▒▒▒▒▒▒▒▒▒▒] 50.00%
2023/06/08 15:56:58 Import finished!
2023/06/08 15:56:58 VictoriaMetrics importer stats:
  idle duration: 332.185307ms;
  time spent while importing: 1.213899228s;
  total samples: 1620207;
  samples/s: 1334712.93;
  total bytes: 31.2 MB;
VM worker 0:↘ 644619 samples/s
VM worker 1:↘ 645300 samples/s
Processing blocks: 2 / 2 [███████████████████████████████████████████] 100.00%
2023/06/08 15:56:58 Total time: 2.302315453s
From VictoriaMetrics dashboard, we can see data ingestion:

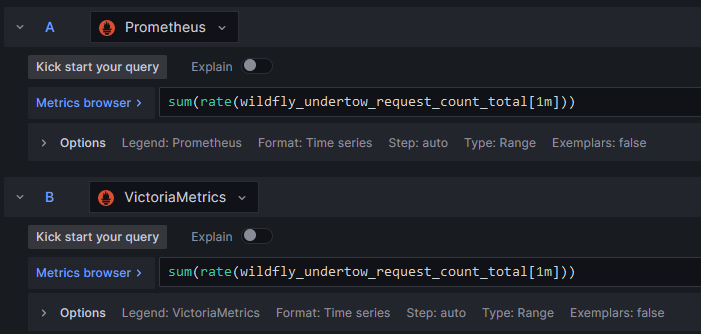
Secondly, to confirm it worked, ahead of this data copy, I have created a Grafana dashboard querying same data but from both Prometheus and VictoriaMetrics datasource:
Before import, dashboard looked like this (note the absence of label):
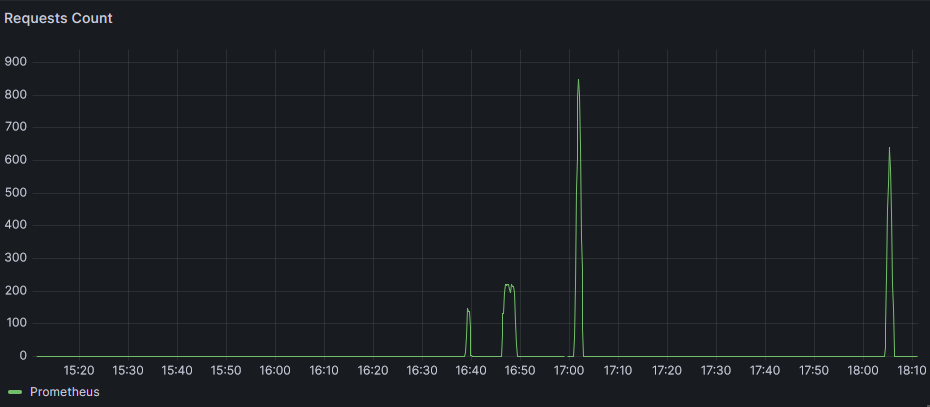
Afterwards:
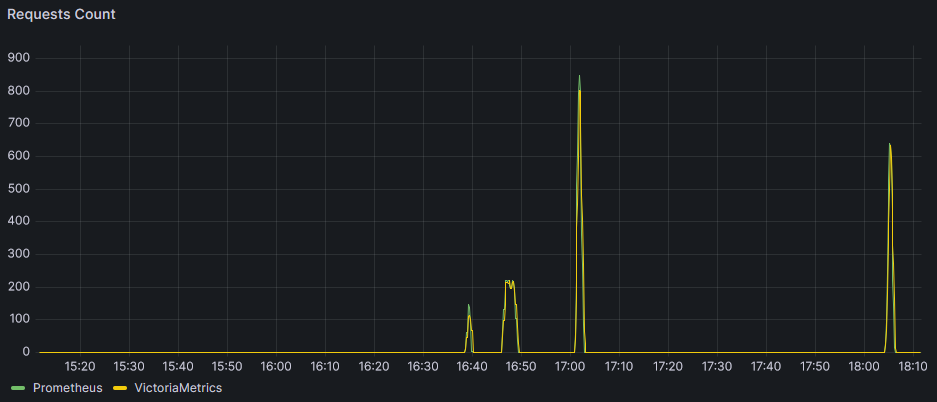
Data is there. rate function has a different behavior in Prometheus and VictoriaMetrics which explains why curves do not perfectly align.
Let’s have a look at raw data to confirm that they exactly match (Prometheus in the top array and VM in the bottom array):
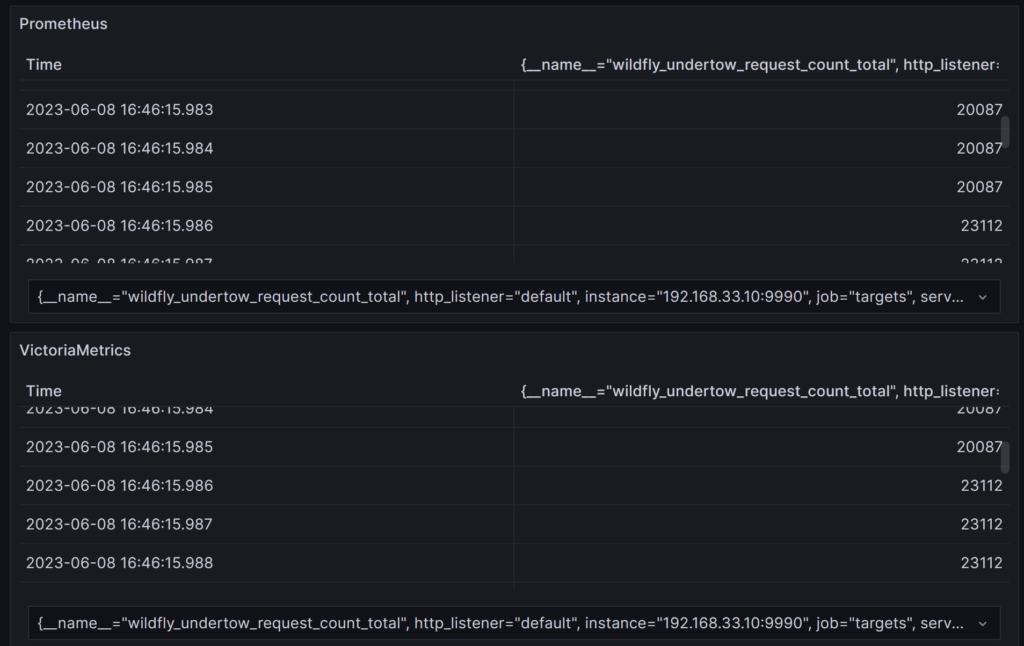
At 16:46:15.986, we can see that the counter increased from same 20087 to 23112.
Finally, for existing Grafana dashboards you might have setup, you could either change the datasource of them individually or change the connection URL parameter at the global configuration level of Grafana (in Connections => Your connections => Data sources).
![Thumbnail [90x90]](https://www.dbi-services.com/blog/wp-content/uploads/2022/08/GRE_web-min-scaled.jpg)
![Thumbnail [90x90]](https://www.dbi-services.com/blog/wp-content/uploads/2022/09/DDI_web-min-scaled.jpg)