In this blog post, I will show you how to gather metrics from a OpenTelemetry interface from a Zabbix server and how to display Zabbix data in Grafana.
Why Should I do that?
First, you might wonder why should you even do that?
Dashboards capabilities of Zabbix are nice and evolving but is not as complete and customizable as Grafana can be. Thus, Grafana is still the best choice for interactive visualization.
Also, many applications provide metrics in open telemetry format out-of-the-box, so being able to get metrics into Zabbix server for computation and storage would be nice. It can also be preferred by those who do not like black boxes like Prometheus.
Finally, having all Zabbix data stored in, for my case, PostgreSQL with TimescaleDB offers great storage reductions. From my experience of Timescale on a Zabbix database, you can expect a compression rate of x10.
This implementation divides in two chapters:
- First is for getting data from Prometheus node exporters to Zabbix.
- Second is displaying Zabbix data in Grafana dashboard.
Node Exporter
Monitoring a node exporter is very easy. On the host, simply link “Linux by Prom” template and that’s it. Of course, node exporter must be up and running.
Grafana
Plugin and Datasource
Before being able to use Zabbix as a datasource for Grafana, we must install and enable the associated plugin. Once it is installed, we can create the datasource of type Zabbix:
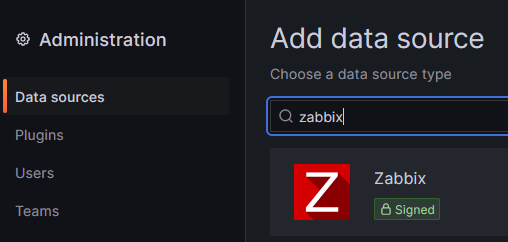
After a click on “Zabbix”, we are requested to add few parameters. Among these, we will provide:
- URL to Zabbix API
- Credentials which can be Username/Password or an API token
Be careful, as the prefilled username is admin with a small a whereas Admin is usually with a capital A.
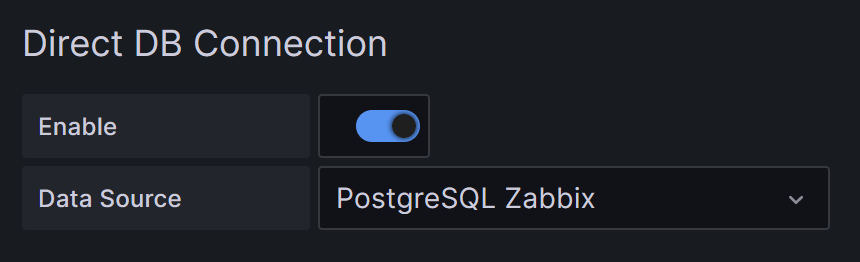
For better query performance, the plugin can also query the database used by Zabbix directly (This is optional). For that, you must create another datasource to the type of database you are using. In my case, it is a PostgreSQL database:
Dashboard
Now, it is time to create a dashboard and use that newly created datasource:
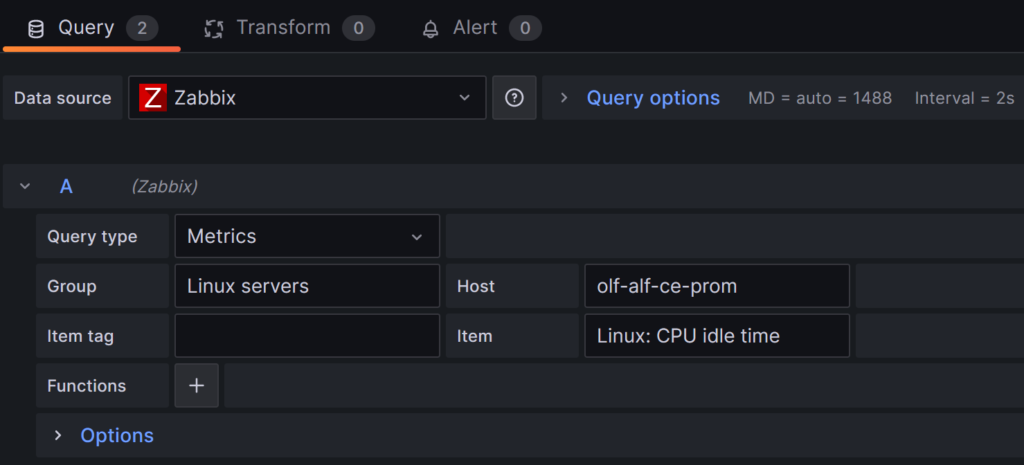
Group, Host, Item tag and Item lists are automatically populated from Zabbix configuration.
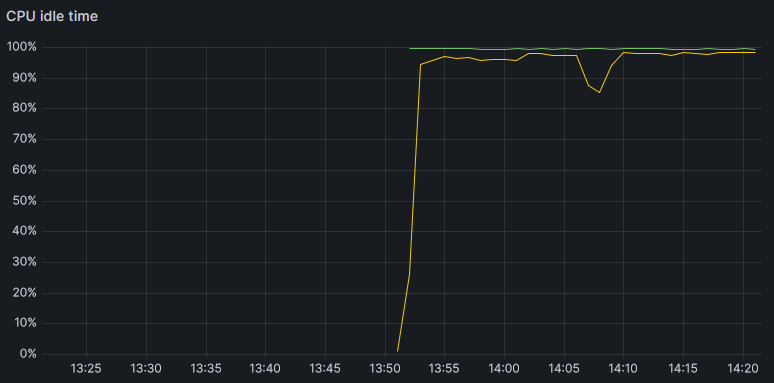
An example of a dashboard showing idle CPU for both Zabbix server itself and another monitored host:
![Thumbnail [90x90]](https://www.dbi-services.com/blog/wp-content/uploads/2022/08/GRE_web-min-scaled.jpg)
![Thumbnail [90x90]](https://www.dbi-services.com/blog/wp-content/uploads/2022/09/DDI_web-min-scaled.jpg)