Enabling monitoring on Kafka with Prometheus/Grafana is not more difficult than others exporters I configured in my previous monitoring in Prometheus blogs. Let’s see this together.
JMX Exporter vs Kafka Exporter
As Kafka is a Java based application, it would have been possible to monitor it with JMX Exporter as I did for Apache Tomcat. But this time, I will use an exporter that is accessing Kafka API.
I am using this Kafka Exporter for demonstration purpose only.
If you don’t want to alter your Kafka setup, it is possible to start this exporter in a docker container. Command is as easy as this (where kafka is the kafka server hostname):
$ docker run -d --rm -p 9308:9308 danielqsj/kafka-exporter \
         --kafka.server=kafka:9092
Exporter will listen on port 9308 and log following lines:
I0418 06:38:02.503148       1 kafka_exporter.go:792] Starting kafka_exporter (version=1.6.0, branch=master, revision=9d9cd654ca57e4f153d0d0b00ce36069b6a677c1)
I0418 06:38:02.550605       1 kafka_exporter.go:963] Listening on HTTP :9308
I can test the access to the exposed port with a browser on http://kafka:9308/metrics:
# HELP go_cgo_go_to_c_calls_calls_total Count of calls made from Go to C by the current process.
# TYPE go_cgo_go_to_c_calls_calls_total counter
go_cgo_go_to_c_calls_calls_total 0
# HELP go_gc_cycles_automatic_gc_cycles_total Count of completed GC cycles generated by the Go runtime.
# TYPE go_gc_cycles_automatic_gc_cycles_total counter
go_gc_cycles_automatic_gc_cycles_total 7
# HELP go_gc_cycles_forced_gc_cycles_total Count of completed GC cycles forced by the application.
# TYPE go_gc_cycles_forced_gc_cycles_total counter
go_gc_cycles_forced_gc_cycles_total 0
# HELP go_gc_cycles_total_gc_cycles_total Count of all completed GC cycles.
# TYPE go_gc_cycles_total_gc_cycles_total counter
go_gc_cycles_total_gc_cycles_total 7
# HELP go_gc_duration_seconds A summary of the pause duration of garbage collection cycles.
# TYPE go_gc_duration_seconds summary
go_gc_duration_seconds{quantile="0"} 3.2e-05
go_gc_duration_seconds{quantile="0.25"} 6.23e-05
go_gc_duration_seconds{quantile="0.5"} 0.0001046
go_gc_duration_seconds{quantile="0.75"} 0.0001833
go_gc_duration_seconds{quantile="1"} 0.0002453
go_gc_duration_seconds_sum 0.0008797
go_gc_duration_seconds_count 7
# HELP go_gc_heap_allocs_by_size_bytes_total Distribution of heap allocations by approximate size. Note that this does not include tiny objects as defined by /gc/heap/tiny/allocs:objects, only tiny blocks.
# TYPE go_gc_heap_allocs_by_size_bytes_total histogram
go_gc_heap_allocs_by_size_bytes_total_bucket{le="8.999999999999998"} 1120
go_gc_heap_allocs_by_size_bytes_total_bucket{le="24.999999999999996"} 39780
go_gc_heap_allocs_by_size_bytes_total_bucket{le="64.99999999999999"} 66615
go_gc_heap_allocs_by_size_bytes_total_bucket{le="144.99999999999997"} 79645
go_gc_heap_allocs_by_size_bytes_total_bucket{le="320.99999999999994"} 82112
...
Everything looks good, but I don’t have anything interesting to monitor yet.
Kafka Topic
Kafka stores events (aka. record or messages) in topics. I will create one named MyTopic with that command:
$ bin/kafka-topics.sh --create --topic MyTopic --bootstrap-server localhost:9092
Created topic MyTopic.
To write an event into that topic, the command will look like:
$ bin/kafka-console-producer.sh --topic MyTopic --bootstrap-server localhost:9092
When producer will be started, you will be prompted with a “>” which means it is ready to process. Each event will be a line of text as pressing Enter will send the message into the queue.
To demonstrate that, I will open a producer and a consumer side by side:

Of course, events are rarely simple text string. It is usually structured data in Yaml or Json.
Prometheus Scraping
I have to modify Prometheus configuration file for it to pull metrics from exporter.
scrape_configs:
  - job_name: 'metrics'
    static_configs:
    - targets: ['x.y.z.t:9308']
      labels:
        middleware_type: 'kafka'
After triggering a configuration reload, I must check the target state. On Prometheus URL (http://a.b.c.d:9090/), go to Status and then Targets menu:

Grafana
I am creating a new dashboard with following metric:
kafka_topic_partition_current_offset{topic="MyTopic"}
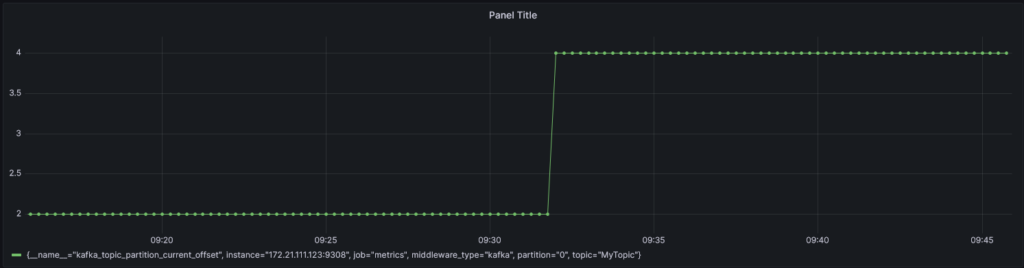
As this offset keeps increasing, it is not relevant to draw it directly. Thus, I will use “rate” function from Prometheus:
rate(kafka_topic_partition_current_offset{topic="MyTopic"}[1m])
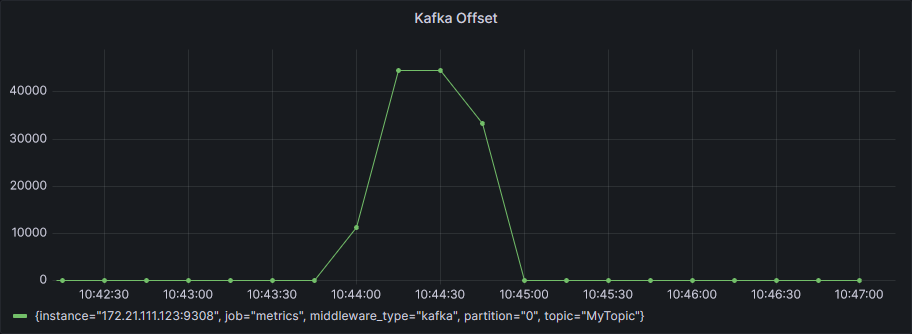
Kafka Producer Performance Test
Kafka includes a script to produce messages with several options. Command:
bin/kafka-producer-perf-test.sh --topic MyTopic --throughput 2000000 --num-records 2000000 --record-size 10 --producer-props bootstrap.servers=localhost:9092
Output gives a regular update on performances plus an additional summary at the end with percentiles:
105234 records sent, 21030.0 records/sec (0.20 MB/sec), 1233.0 ms avg latency, 2523.0 ms max latency.
382135 records sent, 74014.1 records/sec (0.71 MB/sec), 2923.3 ms avg latency, 4572.0 ms max latency.
1275372 records sent, 254921.4 records/sec (2.43 MB/sec), 5247.0 ms avg latency, 6122.0 ms max latency.
2000000 records sent, 125557.159897 records/sec (1.20 MB/sec), 4362.06 ms avg latency, 6122.00 ms max latency, 4667 ms 50th, 6001 ms 95th, 6078 ms 99th, 6121 ms 99.9th.
Consumer output:
...
CreateTime:1681804578211        Offset:17790650 KKRWEIFTZU
CreateTime:1681804578211        Offset:17790651 YMNIYEGITJ
CreateTime:1681804578211        Offset:17790652 UMSLDSLBWY
CreateTime:1681804578211        Offset:17790653 LBGMSWGARD
...
And, finally, the dashboard will look like:
![Thumbnail [90x90]](https://www.dbi-services.com/blog/wp-content/uploads/2022/09/DDI_web-min-scaled.jpg)