Lately, I played a lot with the de facto standard for monitoring visualization (ie. Grafana). It can display your data with great dashboard capabilities. On the other side, JMeter, a highly customizable load test tool, has visualization possibilities, but with an old-school aspect and not so dynamic. So, I wondered, would there be an option to get both together to benefit from the best of each tool.
Bringing them Together
Grafana gets his data from data source and JMeter can write into backend listeners. By default, JMeter supports two time of Time Series DataBase (TSDB): Graphite and InfluxDB.
I chose InfluxDB as I already used it in the past for home automation to store my house power consumption. Since then, it evolved with a new query language named Flux. I will not go too much in detail, but this will determine how query are triggered by Grafana.
InfluxDB Setup
As usual, I am using docker to bring service up without any hurdle (neither too much security):
docker run -p 8086:8086 -d --rm -v LocalInfluxVolume:/var/lib/influxdb influxdb:latest
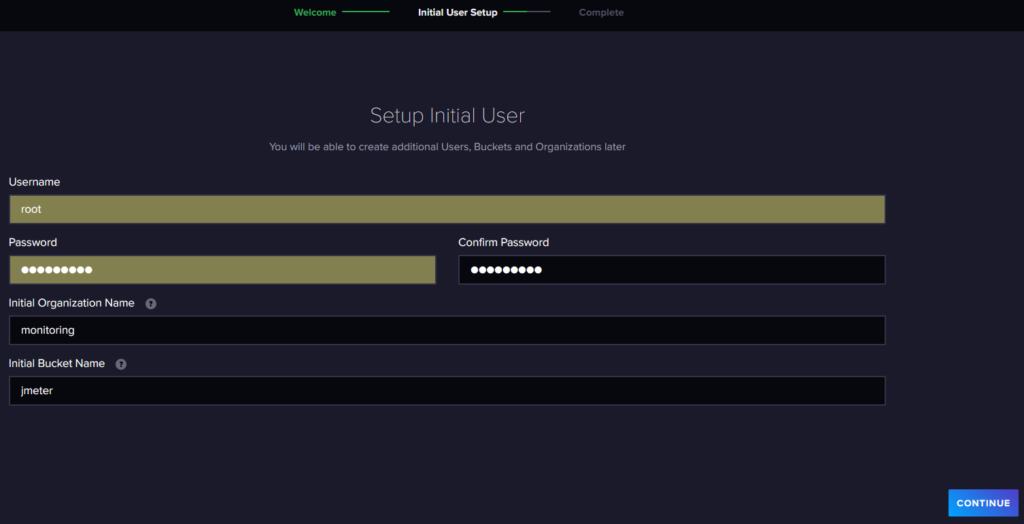
Next, I browse to that exposed port and I start initial setup:
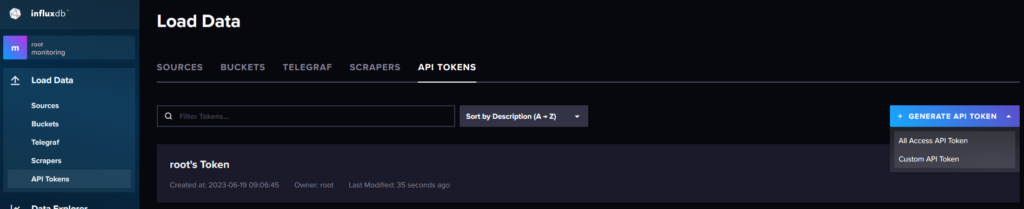
Following, by an API Token creation:
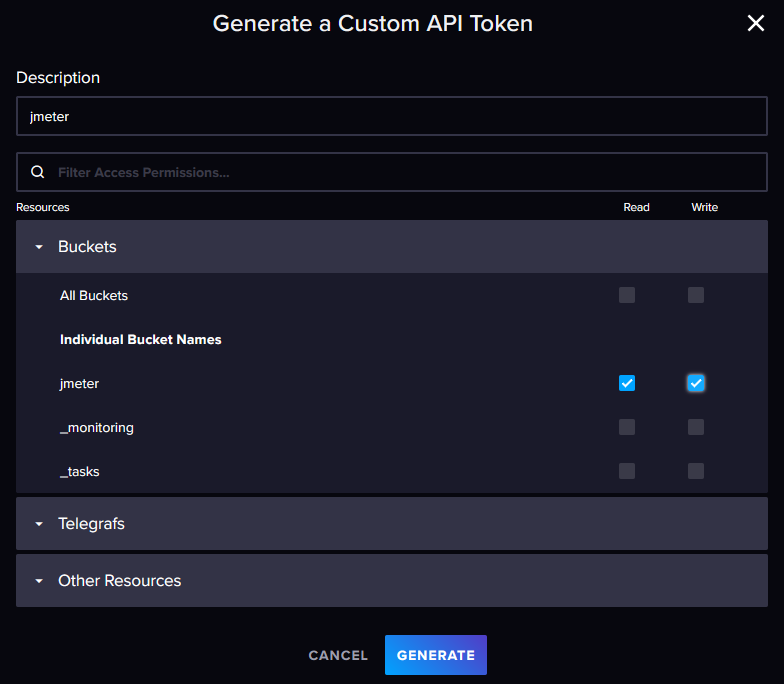
Which will have access to jmeter bucket only:
JMeter Setup
For this blog, I will use my simplest scenario which only triggers one URL. For this scenario to send results into InfluxDB, there are two options:
- InfluxDBBackendListenerClient which sends pre-calculated metrics
- InfluxDBRawBackendListenerClient which sends raw data, meaning every requests response times
The second option will, of course, use more resources, so let’s begin with first one.
I will add a Backend Listener to the Thread Group:

I set parameters as follow:

The two most important parameters are:
influxdbUrlwhich corresponds to the API URL used by JMeter to write into InfluxDB.infludbTokenwas a parameter I must add for API authentication as it was not listed.
If all goes well, when I start the scenario, log will show the following message:
2023-06-19 10:05:54,932 INFO o.a.j.e.StandardJMeterEngine: Running the test!
2023-06-19 10:05:54,933 INFO o.a.j.s.SampleEvent: List of sample_variables: []
2023-06-19 10:05:54,936 INFO o.a.j.v.b.BackendListener: Backend Listener Stats: Starting worker with class: class org.apache.jmeter.visualizers.backend.influxdb.InfluxdbBackendListenerClient and queue capacity: 5000
2023-06-19 10:05:54,937 INFO o.a.j.v.b.BackendListener: Backend Listener Stats: Started  worker with class: class org.apache.jmeter.visualizers.backend.influxdb.InfluxdbBackendListenerClient
2023-06-19 10:05:54,939 INFO o.a.j.g.u.JMeterMenuBar: setRunning(true, *local*)
2023-06-19 10:05:54,948 INFO o.a.j.e.StandardJMeterEngine: Starting ThreadGroup: 1 : Thread Group
2023-06-19 10:05:54,948 INFO o.a.j.e.StandardJMeterEngine: Starting 50 threads for group Thread Group.
2023-06-19 10:05:54,948 INFO o.a.j.e.StandardJMeterEngine: Thread will continue on error
2023-06-19 10:05:54,948 INFO o.a.j.t.ThreadGroup: Starting thread group... number=1 threads=50 ramp-up=30 delayedStart=false
2023-06-19 10:05:54,953 INFO o.a.j.t.JMeterThread: Thread started: Thread Group 1-1
2023-06-19 10:05:54,972 INFO o.a.j.t.ThreadGroup: Started thread group number 1
2023-06-19 10:05:54,972 INFO o.a.j.e.StandardJMeterEngine: All thread groups have been started
2023-06-19 10:05:55,559 INFO o.a.j.t.JMeterThread: Thread started: Thread Group 1-2
2023-06-19 10:05:56,157 INFO o.a.j.t.JMeterThread: Thread started: Thread Group 1-3
[...]
Grafana Setup
Before being able to use this dashboard, I have to setup a new datasource of type InfluxDB:
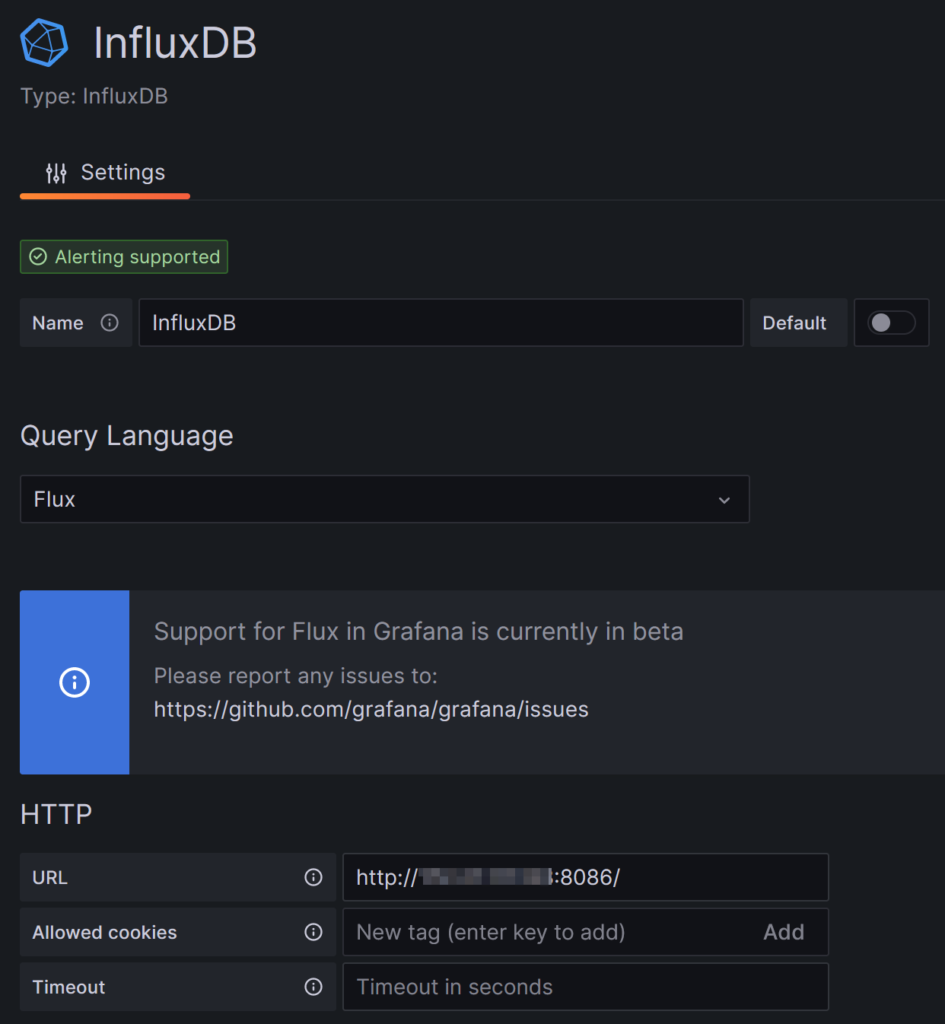
For that part, important parameters are:
- Query Language set to Flux instead of InfluxQL.
- URL.
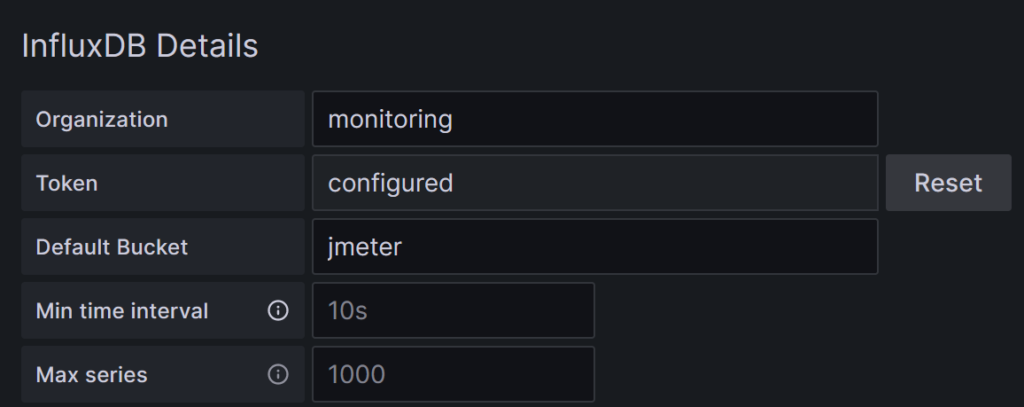
- InfluxDB Details:
- Organization: monitoring.
- Default Bucket: jmeter
Save and test should confirm Grafana can access the datasource:

Dashboard
I chose this ready to use dashboard which is compatible with Flux. This works well without any further configuration:

Next Steps
Percentiles could be customized in JMeter Backend Listener parameters. If more fined grained statistics are required, this can be achieved by using Raw InfluxDB Backend Listener which will provide information about each and every request with a much higher resource cost.
![Thumbnail [90x90]](https://www.dbi-services.com/blog/wp-content/uploads/2022/09/DDI_web-min-scaled.jpg)