Following my two previous blogs about monitoring, I will now focus on Nginx. Nginx Inc provides an exporter with it’s code: https://github.com/nginxinc/nginx-prometheus-exporter
As Nginx cannot run a web application as WebLogic or WildFly can, exporter will be another process.
Nginx Configuration
To enable metrics for Nginx, we must use stub_status directive in a server or location context of the configuration.
Before that, we must check that stub module is enabled. A simple command will do:
nginx -V 2>&1 | grep --color "with-http_stub_status_module"
Then, we must extend the existing configuration to enable stub module by adding following lines inside a server context:
location /nginx_status {
           stub_status on;
           allow 127.0.0.1;
           deny all;
       }
To validate configuration, we can run following command to reload configuration:
nginx -s reload
A curl command (curl https://localhost:443/nginx_status) will check that metrics are populated:
Active connections: 1
server accepts handled requests
 14 14 14
Reading: 0 Writing: 1 Waiting: 0
As the format is not Prometheus compliant, we need the exporter to do the reformatting for us.
Nginx Exporter
We could run exporter as a binary or as a container. I am choosing the second option.
docker run\
 -p 9113:9113\
 -e SSL_VERIFY=false\
 nginx/nginx-prometheus-exporter\
 -nginx.scrape-uri=https://192.168.33.10:443/nginx_status
Here is a quick explanation of the parameters:
- Line 2 is the port exposed to get metrics.
- Line 3 is to disable SSL verification as my certificate is not signed by a certification authority.
- Line 4 is the image name.
- Line 5 is the stub URL.
Output of docker command looks like this:
NGINX Prometheus Exporter version=0.11.0 commit=e4a6810d4f0b776f7fde37fea1d84e4c7284b72a date=2022-09-07T21:09:51Z, dirty=false, arch=linux/amd64, go=go1.19
2023/03/27 10:41:11 Starting...
2023/03/27 10:41:11 Listening on :9113
2023/03/27 10:41:11 NGINX Prometheus Exporter has successfully started
Further, I can also test the URL where metrics are now properly formatted for Prometheus ingestion (i.e. http://localhost:9113/metrics):
# HELP nginx_connections_accepted Accepted client connections
# TYPE nginx_connections_accepted counter
nginx_connections_accepted 27
# HELP nginx_connections_active Active client connections
# TYPE nginx_connections_active gauge
nginx_connections_active 2
# HELP nginx_connections_handled Handled client connections
# TYPE nginx_connections_handled counter
nginx_connections_handled 27
# HELP nginx_connections_reading Connections where NGINX is reading the request header
# TYPE nginx_connections_reading gauge
nginx_connections_reading 0
# HELP nginx_connections_waiting Idle client connections
# TYPE nginx_connections_waiting gauge
nginx_connections_waiting 1
...
Prometheus Integration
In scrape_configs section, I am adding the following job:
  - job_name: "Nginx"
    metrics_path: /metrics
    static_configs:
    - targets: ['172.17.0.1:9113']
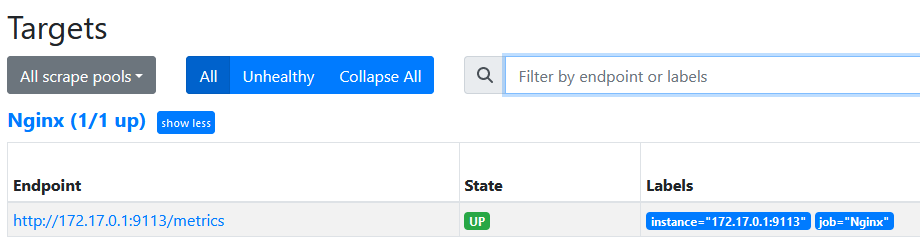
After a reload of the configuration, I check if the Target State is up:
Grafana
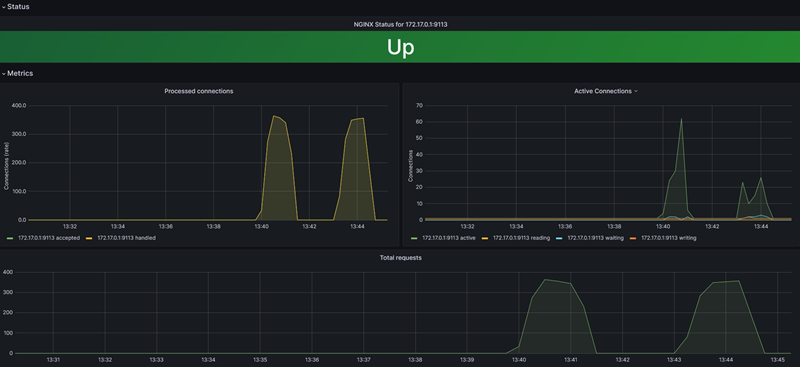
I will use the dashboard provided in the github repository (grafana/dashboard.json) and point it to Prometheus datasource:
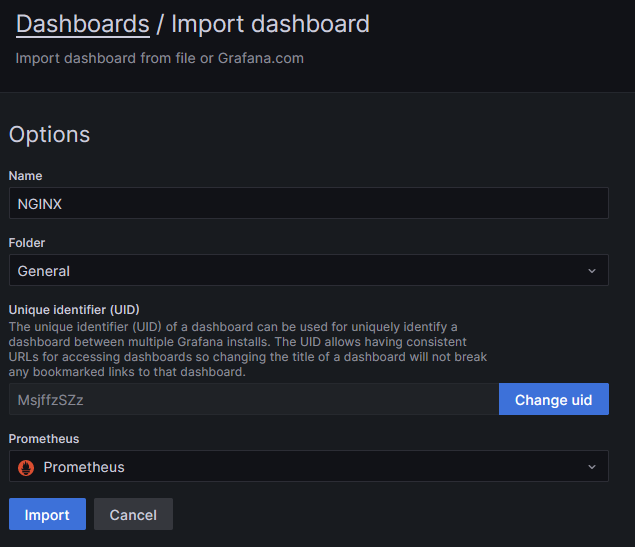
Result looks simple but nice:
Nginx Plus provides much more metrics as documented here.
![Thumbnail [90x90]](https://www.dbi-services.com/blog/wp-content/uploads/2022/09/DDI_web-min-scaled.jpg)