As I am focusing on monitoring subject, I was wondering if it is possible to set alarm based on prediction instead of simple thresholds. Dynatrace has predictive anomaly detection feature, but in this blog, I want to test if on-premises solution could help on this. We will see what Prometheus is capable of.
Alarm and Threshold
When we set up monitoring on an IT system, we usually think of thresholds. These are nice and easy to understand as we are used to it. For example, trigger a major event when partition occupancy reached 90%. Based on experience, we can fine tune this be warn at the right moment. Unfortunately, in some situations having a static threshold is not the best solution.
predict_linear
predict_linear is a query function provided by Prometheus which requires two arguments:
- a range-vector
- a time in seconds to predict what value will be
Based on the range-vector, it will find the line that could, as precise as possible, predicts the next values (more information here).
Let’s take node_filesystem_free_bytes gauge as example. I am running in background the following script to fill the partition slowly (1 MB every second):
for i in {0..100000}; do echo $i; fallocate -l 1m file${i};sleep 1;done
After almost an hour, I am seeing this when I plot node_filesystem_free_bytes{mountpoint="/",job="node"}:
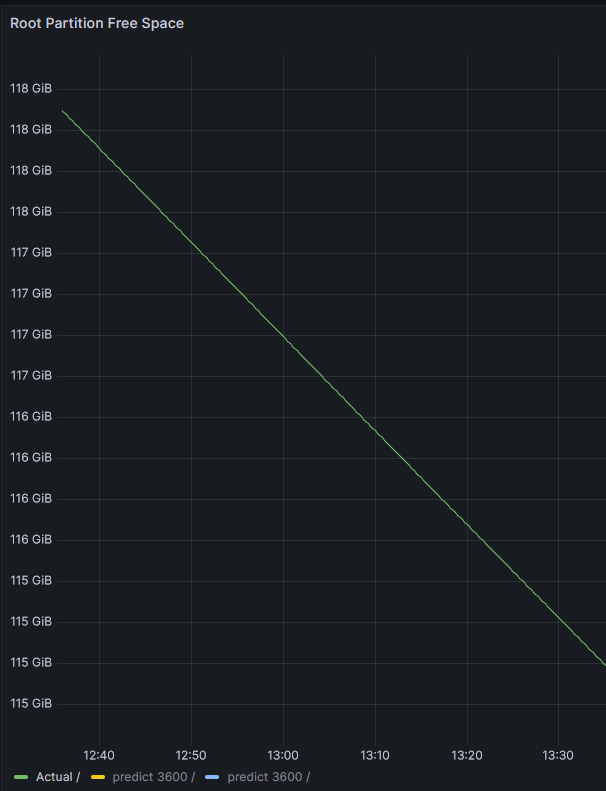
Of course, such a linear pattern does not reflect what we are seeing in a more real scenario, but this will help to confirm predict_linear function works.
Now, we can add another query in Grafana:
predict_linear(node_filesystem_free_bytes{mountpoint="/",job="node"}[1h],3600)
1h means we are gathering a range-vector data of 1 hour; thus it will be able to forecast 1 hour after current time. 3600 is the number of seconds after the current time to compute forecast value.
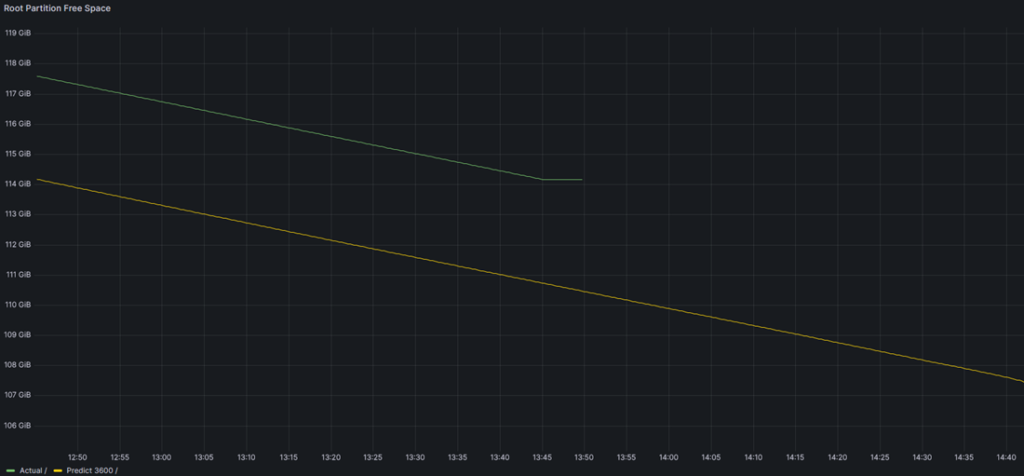
In yellow, we can see the predicted value in 1 hour (3600 seconds). If we compare predicted value 1 hour ago (yes, it sounds stupid) and current value we can see it matches:
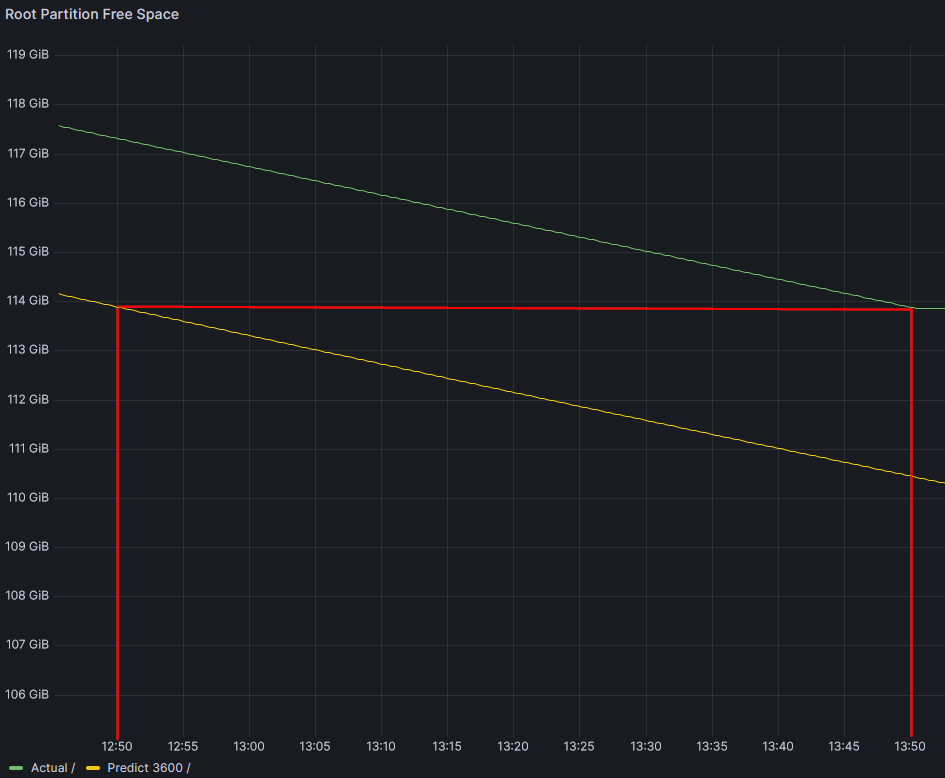
Now, to display future data, we simply need to modify time range To field:
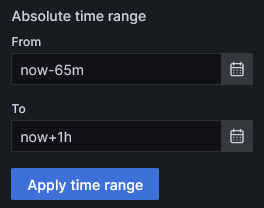
Which will show following graph:
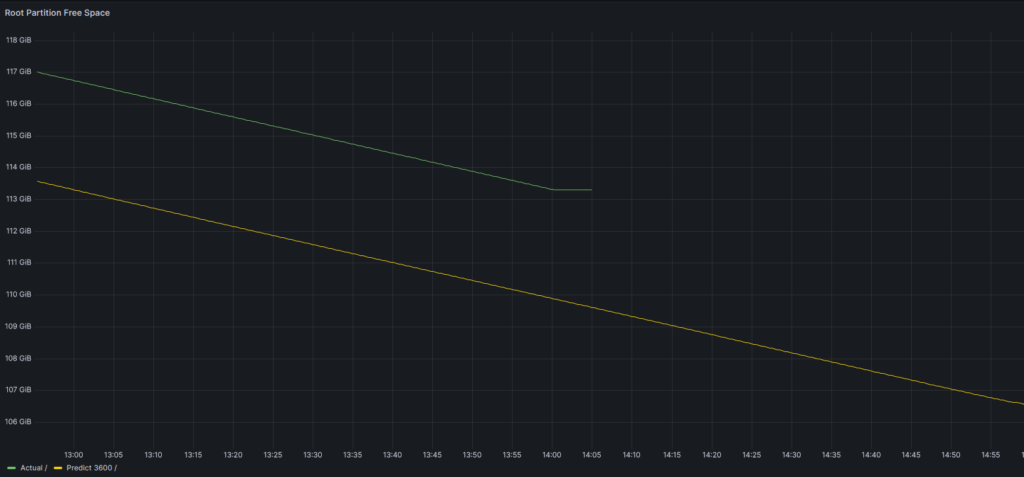
It shows that free space prediction is 110 GB in 1 hour. Let’s do some math to check:
Current occupancy is 113 GB. The script is filling at the rate of 3,6 GB/h (1 MB/s => 60 MB/min => 3600 MB/h), so we are good.
Going Further in Future
That’s interesting, but how would knowing the occupancy rate one hour in the future help me anyhow?
Let’s create another query on 1 day:
predict_linear(node_filesystem_free_bytes{mountpoint="/",job="node"}[24h],86400)
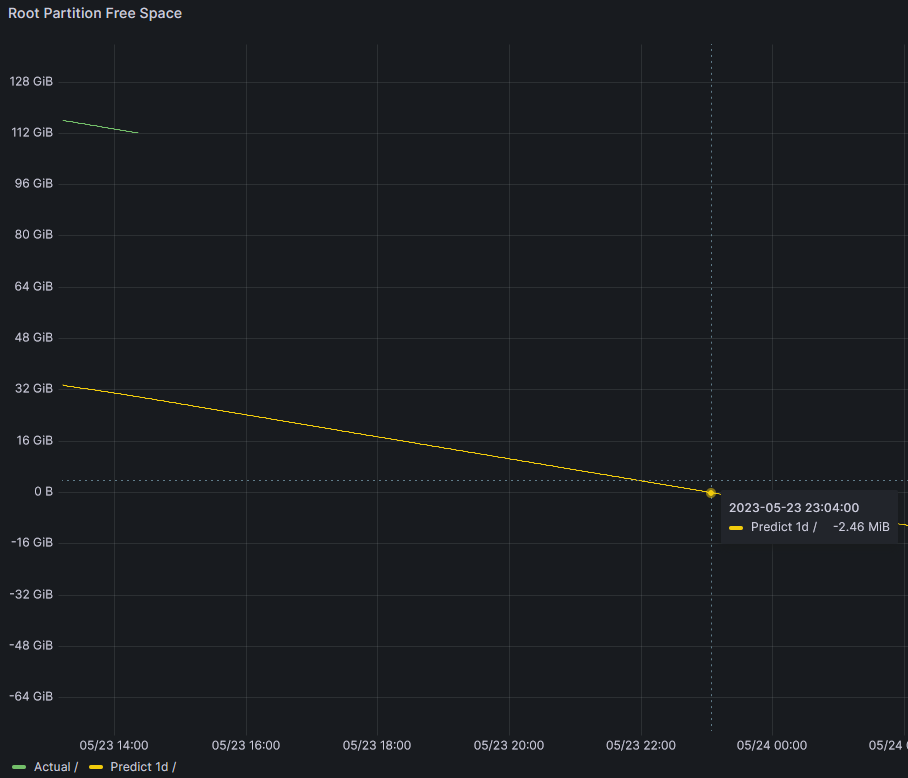
If I move the mouse over the Predict 1d curve, I will notice that at a point in time, it will be a negative value. As you know available disk space can’t be a negative value which means that if I do not take any preventive measure, the partition will be full on the next day around 23:00.
Turn this into an Alert
The idea is to get alerted whenever the prediction in next 24 hours will reach 0. So, the alert expression uses previous query result is less than 0.
Here is an example of alerting rule for space usage:
groups:
- name: Node
  rules:
  - alert: PredictedOutOfSpace
    expr: predict_linear(node_filesystem_free_bytes{mountpoint="/",job="node"}[24h],86400) < 0
    for: 5m
    labels:
      severity: warning
    annotations:
      summary: Root Partition will be out of space
It is possible to make this raised any number of days before free space gets to 0 by adjusting the two parameters.
Conclusion
With this kind of alerting, I will be warned before we reach full partition. In the example above, assuming we are friday, if I look at current usage (ie. 104GB free space), nothing to worry about. But if we look at the prediction, we know we will have a full partition during the week-end.
If we want to avoid being disturbed outside office hours, we must think how prediction could help us. Even if it is not as powerfull as Saas monitoring solution (linear regression is basic deep learning), I am sure we can do even better.
![Thumbnail [90x90]](https://www.dbi-services.com/blog/wp-content/uploads/2022/09/DDI_web-min-scaled.jpg)
![Thumbnail [90x90]](https://www.dbi-services.com/blog/wp-content/uploads/2022/08/ADE_WEB-min-scaled.jpg)