Just be clear this is not a performance test as we had to connect the Pure Storage box through 1GB/s interfaces. Basically it is more about how you can interact with the storage system (command line & web interface) and to get a feeling on what is possible.
In the last post we explained on how we did the setup for connecting a PostgreSQL server to the Pure Storage array. In this post we’ll actually give the array something to work with. However please take in account that the point here is to present the functional usage. It is not a pure performance evaluation as unfortunately we had on our infrastructure only 1Gb/s interfaces available for the connection (sic). What we use for the tests is pgbench which is included with PostgreSQL and can be used to load a database and then perform a TPC-B like performance test against the loaded data. Btw: pgbench is a great tool when you want to make the same tests against different configurations of PostgreSQL or the same configurations of PostgreSQL against different physical or virtual hardware configurations.
To begin with lets create a dedicated database for loading the data into:
postgres@pgpurestorage:/home/postgres/ [pgpure] psql -c "create database purestorage" postgres
CREATE DATABASE
Time: 552.693 ms
We’ll use pgbench in initialization (“-i”) mode with a scale factor (“-s”) of 10000 for populating the database. The will create the pgbench_accounts, pgbench_branches, pgbench_history, and pgbench_tellers and will result in 1000000000 rows in total for the pgbench_accounts table.
postgres@pgpurestorage:/home/postgres/ [pgpure] pgbench -i -s 10000 purestorage
The total run-time (including the vacuum at the end) was around 2,5 hours (this is including the index creation and the vacuum at the end) and this is the size of the database:
pgpurestorage/postgres MASTER (postgres@5432) # \l+
                                                                      List of databases
┌─────────────┬──────────┬──────────┬─────────────┬─────────────┬───────────────────────┬─────────┬────────────┬────────────────────────
│    Name     │  Owner   │ Encoding │   Collate   │    Ctype    │   Access privileges   │  Size   │ Tablespace │                Descript
├─────────────┼──────────┼──────────┼─────────────┼─────────────┼───────────────────────┼─────────┼────────────┼────────────────────────
│ postgres    │ postgres │ UTF8     │ en_US.UTF-8 │ en_US.UTF-8 │                       │ 7629 kB │ pg_default │ default administrative
│ purestorage │ postgres │ UTF8     │ en_US.UTF-8 │ en_US.UTF-8 │                       │ 146 GB  │ pg_default │
│ template0   │ postgres │ UTF8     │ en_US.UTF-8 │ en_US.UTF-8 │ =c/postgres          ↵│ 7497 kB │ pg_default │ unmodifiable empty data
│             │          │          │             │             │ postgres=CTc/postgres │         │            │
│ template1   │ postgres │ UTF8     │ en_US.UTF-8 │ en_US.UTF-8 │ =c/postgres          ↵│ 7497 kB │ pg_default │ default template for ne
│             │          │          │             │             │ postgres=CTc/postgres │         │            │
└─────────────┴──────────┴──────────┴─────────────┴─────────────┴───────────────────────┴─────────┴────────────┴────────────────────────
(4 rows)
The biggest table is the pgbench_accounts table:
pgpurestorage/purestorage MASTER (postgres@5432) # \d+
                           List of relations
┌────────┬──────────────────┬───────┬──────────┬─────────┬─────────────┐
│ Schema │       Name       │ Type  │  Owner   │  Size   │ Description │
├────────┼──────────────────┼───────┼──────────┼─────────┼─────────────┤
│ public │ pgbench_accounts │ table │ postgres │ 125 GB  │             │
│ public │ pgbench_branches │ table │ postgres │ 392 kB  │             │
│ public │ pgbench_history  │ table │ postgres │ 0 bytes │             │
│ public │ pgbench_tellers  │ table │ postgres │ 4360 kB │             │
└────────┴──────────────────┴───────┴──────────┴─────────┴─────────────┘
(4 rows)
.. which contains 1000000000 rows:
pgpurestorage/purestorage MASTER (postgres@5432) # select count(*) from pgbench_accounts;
┌────────────┐
│   count    │
├────────────┤
│ 1000000000 │
└────────────┘
(1 row)

Time: 219538.051 ms (03:39.538)
Here are the screenshots from the Pure Storage management console for the duration of the run (which started some minutes before 20:00). Orange are write operations, blue is read:
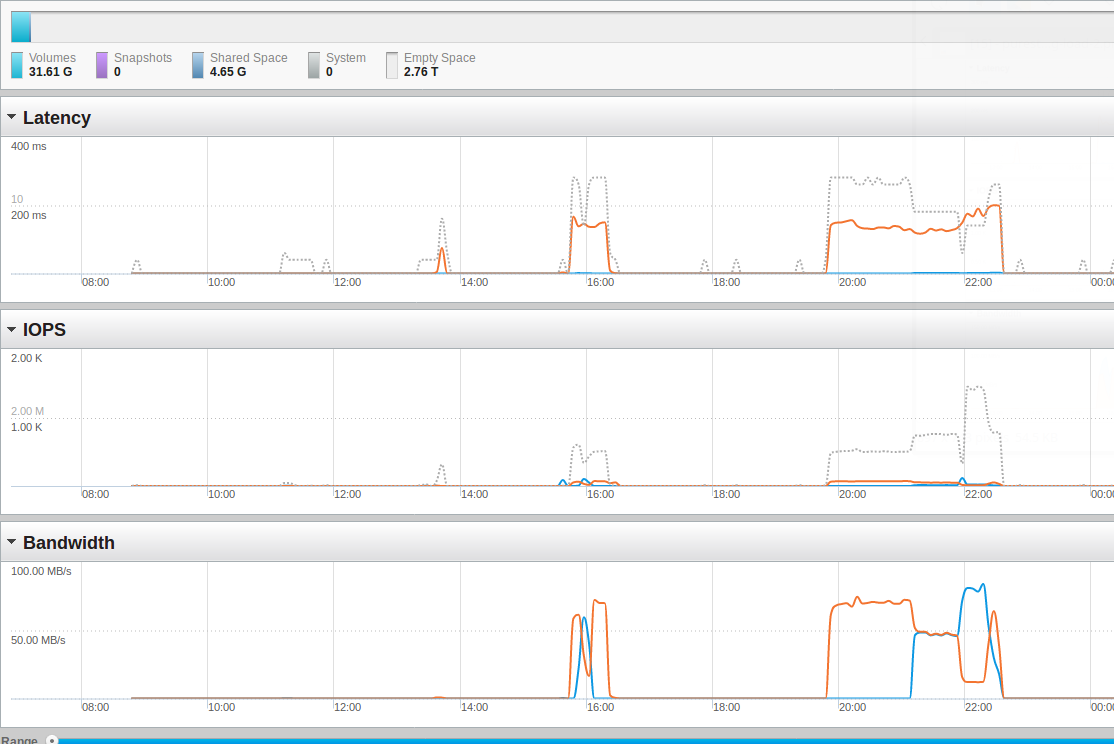
As you can see we are fare away from saturating the storage. So, lets do the same load again but this time with two sessions into two databases in parallel:
# session one
postgres@pgpurestorage:/home/postgres/ [pgpure] psql -c "drop database if exists purestorage" postgres
DROP DATABASE
Time: 983.297 ms
postgres@pgpurestorage:/home/postgres/ [pgpure] psql -c "create database purestorage" postgres
CREATE DATABASE
Time: 514.140 ms
postgres@pgpurestorage:/home/postgres/ [pgpure] pgbench -i -s 10000 purestorage

# session two
postgres@pgpurestorage:/home/postgres/ [pgpure] psql -c "drop database if exists purestorage2" postgres
DROP DATABASE
Time: 0.110 ms
postgres@pgpurestorage:/home/postgres/ [pgpure] psql -c "create database purestorage2" postgres
CREATE DATABASE
Time: 274.576 ms
postgres@pgpurestorage:/home/postgres/ [pgpure] pgbench -i -s 10000 purestorage2
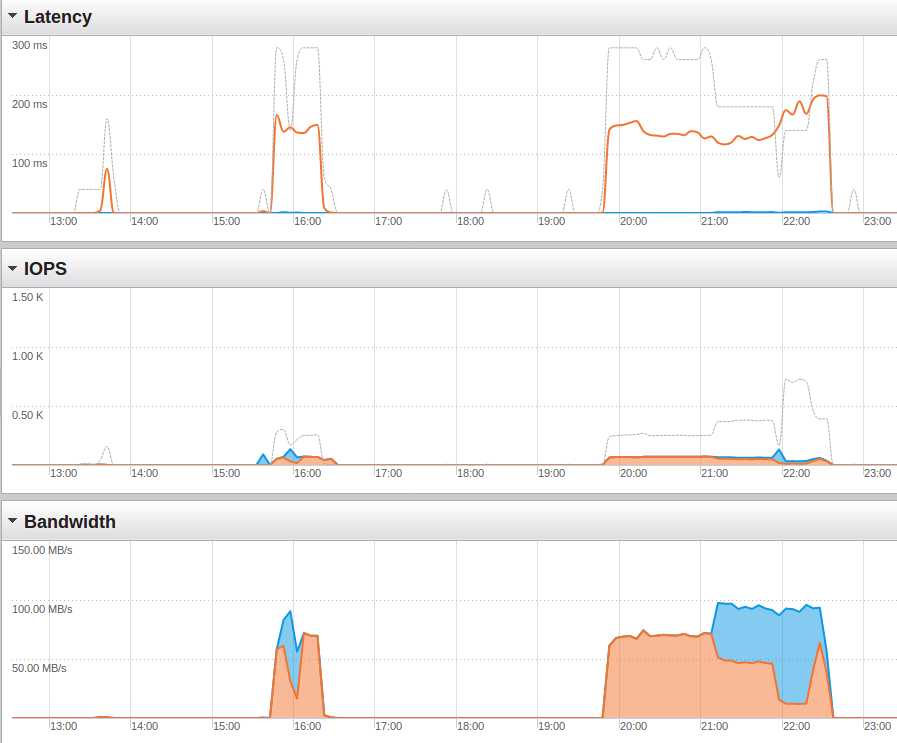
This screenshots from the Pure Storage console:
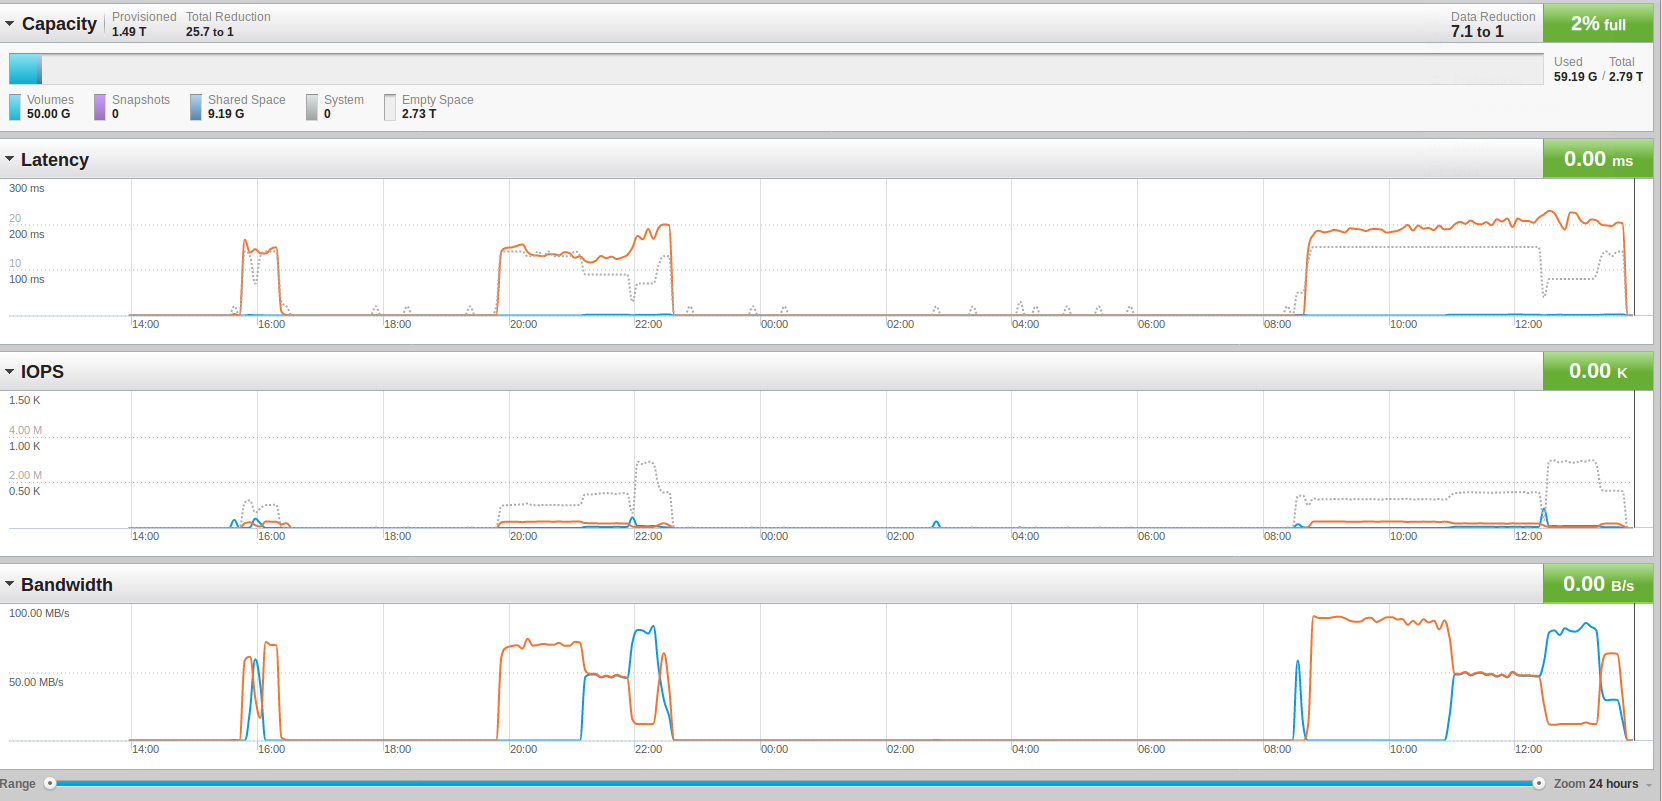
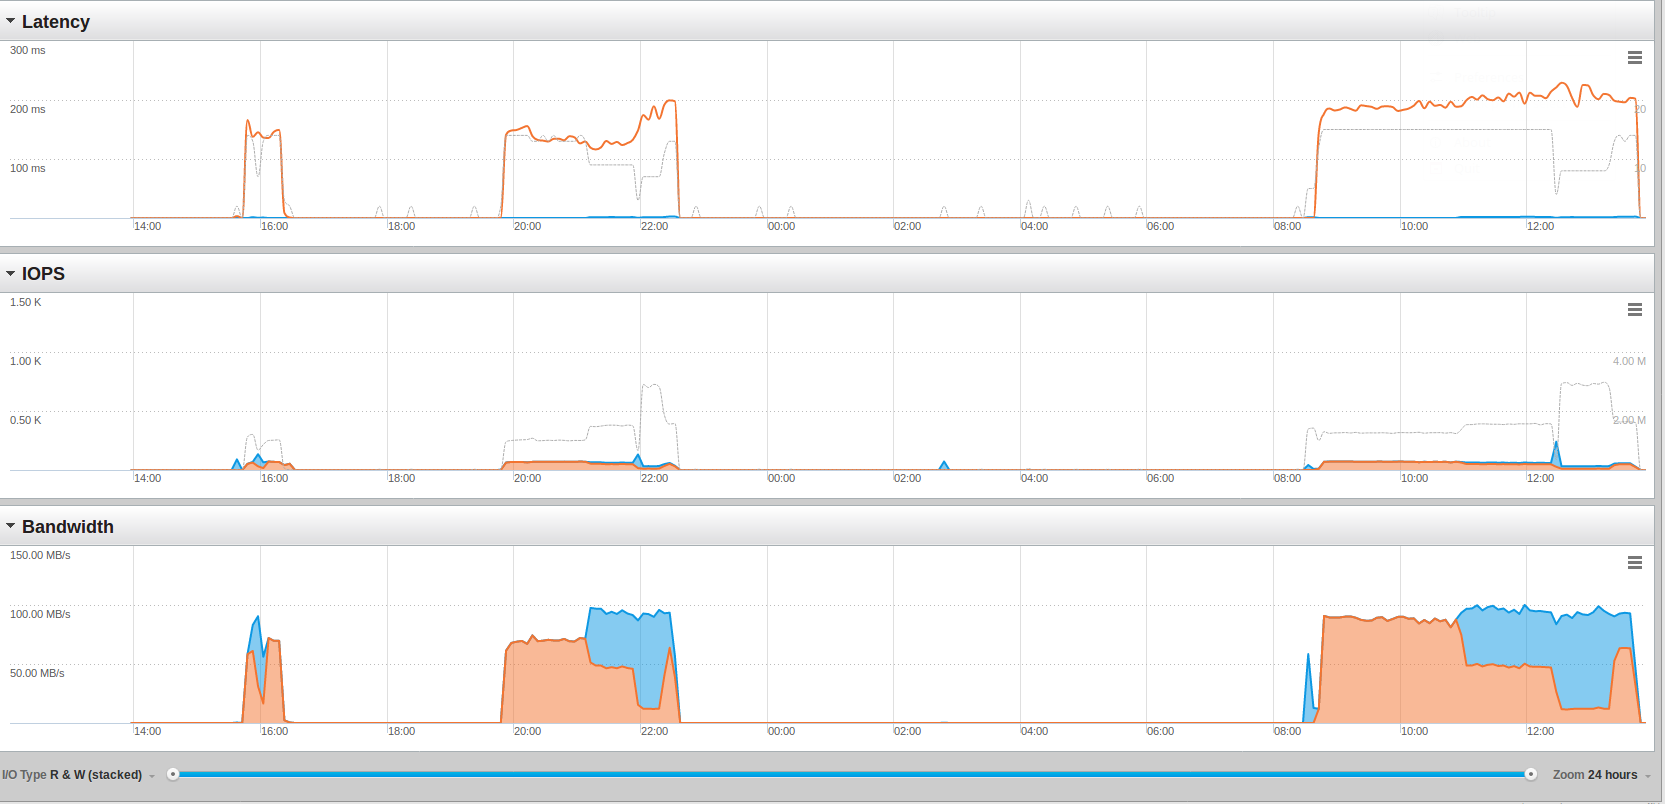
It took more than double as long to load the 2000000000 rows but the limit is not on the storage. The average bandwidth went up from around 65 mb/sec to around 90 mb/sec. What is interesting to see is that we need only around 45GB real storage:
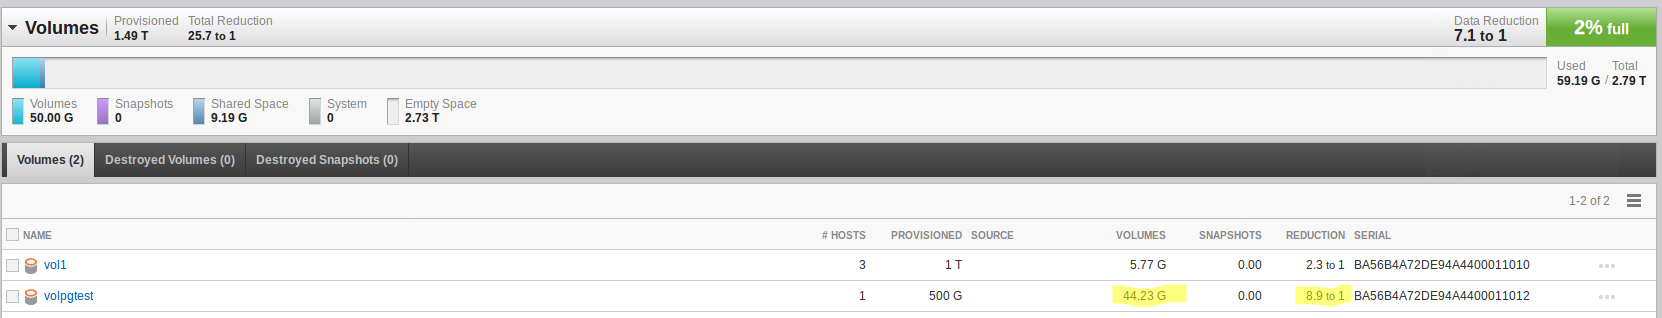
This means we have a almost 9 times compression/de-duplication on the storage layer. Remember that each database has a size of 146GB ( ( 146 * 2 = 292 ) / 9 = 32, plus the WAL files ):
                                                                     List of databases
┌──────────────┬──────────┬──────────┬─────────────┬─────────────┬───────────────────────┬─────────┬────────────┬──────────────────────────────────────
│     Name     │  Owner   │ Encoding │   Collate   │    Ctype    │   Access privileges   │  Size   │ Tablespace │                Description
├──────────────┼──────────┼──────────┼─────────────┼─────────────┼───────────────────────┼─────────┼────────────┼──────────────────────────────────────
│ postgres     │ postgres │ UTF8     │ en_US.UTF-8 │ en_US.UTF-8 │                       │ 7629 kB │ pg_default │ default administrative connection dat
│ purestorage  │ postgres │ UTF8     │ en_US.UTF-8 │ en_US.UTF-8 │                       │ 146 GB  │ pg_default │
│ purestorage2 │ postgres │ UTF8     │ en_US.UTF-8 │ en_US.UTF-8 │                       │ 146 GB  │ pg_default │
│ template0    │ postgres │ UTF8     │ en_US.UTF-8 │ en_US.UTF-8 │ =c/postgres          ↵│ 7497 kB │ pg_default │ unmodifiable empty database
│              │          │          │             │             │ postgres=CTc/postgres │         │            │
│ template1    │ postgres │ UTF8     │ en_US.UTF-8 │ en_US.UTF-8 │ =c/postgres          ↵│ 7497 kB │ pg_default │ default template for new databases
│              │          │          │             │             │ postgres=CTc/postgres │         │            │
└──────────────┴──────────┴──────────┴─────────────┴─────────────┴───────────────────────┴─────────┴────────────┴──────────────────────────────────────
What happens then when the file system gets full on the host but there still is storage available in the back-end? Lets copy one of the test databases: That should almost fill the file system:
pgpurestorage/postgres MASTER (postgres@5432) # \! df -h
Filesystem                         Size  Used Avail Use% Mounted on
/dev/mapper/cl_pgpurestorage-root   26G  2.2G   24G   9% /
devtmpfs                           3.9G     0  3.9G   0% /dev
tmpfs                              3.9G   16K  3.9G   1% /dev/shm
tmpfs                              3.9G   41M  3.8G   2% /run
tmpfs                              3.9G     0  3.9G   0% /sys/fs/cgroup
/dev/sda1                         1014M  183M  832M  19% /boot
tmpfs                              781M     0  781M   0% /run/user/1000
/dev/mapper/vgpure-lvpure          450G  302G  149G  68% /u02/pgdata
pgpurestorage/postgres MASTER (postgres@5432) # create database test template = purestorage;

CREATE DATABASE
Time: 3312062.975 ms (55:12.063)
pgpurestorage/postgres MASTER (postgres@5432) #
pgpurestorage/postgres MASTER (postgres@5432) # \! df -h
Filesystem                         Size  Used Avail Use% Mounted on
/dev/mapper/cl_pgpurestorage-root   26G  2.2G   24G   9% /
devtmpfs                           3.9G     0  3.9G   0% /dev
tmpfs                              3.9G   16K  3.9G   1% /dev/shm
tmpfs                              3.9G   41M  3.8G   2% /run
tmpfs                              3.9G     0  3.9G   0% /sys/fs/cgroup
/dev/sda1                         1014M  183M  832M  19% /boot
tmpfs                              781M     0  781M   0% /run/user/1000
/dev/mapper/vgpure-lvpure          450G  449G  1.7G 100% /u02/pgdata
pgpurestorage/postgres MASTER (postgres@5432) #
Almost full, so lets create another database:
pgpurestorage/postgres MASTER (postgres@5432) # create database test2 template = purestorage;
ERROR:  could not write to file "base/16562/16534": No space left on device
Time: 34449.626 ms (00:34.450)
So, behavior is what has been expected.
In the next post we’ll do some pgbench standard benchmarks against the data set although the numbers will probably not be very good as we are running in a ESX test environment and this seems to be the bottle neck in our case. We’ll have to analyze the sar statistics for that, but no time yet.
What I can say about the storage system so far: I like the simplicity of the management console. There is not much more you can do than creating hosts, volumes and connections between them, that’s it. Reduction is happening automatically and you have the option to replicate to another storage system. Snapshots are available as well, but not yet tested.
![Thumbnail [60x60]](https://www.dbi-services.com/blog/wp-content/uploads/2022/08/DWE_web-min-scaled.jpg)
![Thumbnail [90x90]](https://www.dbi-services.com/blog/wp-content/uploads/2022/08/STH_web-min-scaled.jpg)
![Thumbnail [90x90]](https://www.dbi-services.com/blog/wp-content/uploads/2024/03/AHI_web.jpg)