In this blog, I will explain how to enable WebLogic monitoring in Prometheus as I did for WildFly in my previous blog.
WebLogic Monitoring Exporter
Oracle is providing, as open source, a Prometheus-compatible exporter in this github repo. It can be run either in a web application or as a separate process. In this blog, I will focus on the web app method.
Prepare Config File
The web application must be configured with help of a config.yml file. It can be loaded from the web app URL once it has been deployed but changes will not be persistent. Nevertheless, it is a good way to fine-tune parameters.
Once your configuration file has been validated, you can even use the script the provide to integrate the config file into the war file so that web app is deployed directly with the right configuration.
Let’s take an example of the configuration file provided by Oracle (jvm.yml) with some slight’s modifications:
metricsNameSnakeCase: true
queries:
- key: name
  keyName: server
  JVMRuntime:
    #prefix: jvm_
    prefix: wls_jvm_
    key: name
    values: [heapFreeCurrent, heapFreePercent, heapSizeCurrent, heapSizeMax, uptime, processCpuLoad]
This file only focuses on Java Virtual Machine memory and CPU. We will use this file in next steps, but for now, we must deploy the web application.
Deploy Web Application
The deployment of wls-exporter.war is not different to any other web application deployments:
- Log into WebLogic console
- Go in Deployments section
- Click Lock and Edit
- Click Install and target it to whatever server you want to monitor.
- Once uploaded, click Activate Changes
- Still in Deployments section, select Control tab
- Select wls-exporter and click start Servicing all requests
At this point, you should be able to open the web application http://<HOSTNAME>:7001/wls-exporter/
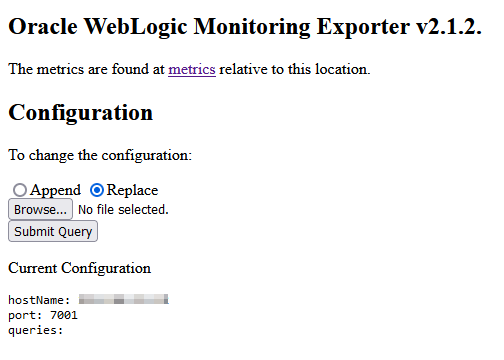
As you can see, the queries section is empty, because there is no default configuration.yml file applied. If I open the metrics web page (http://<HOSTNAME>:7001/wls-exporter/metrics), I will not see any metric:
# No configuration defined.
Let’s upload the jvm.yml file. When submitting, I can either Append or Replace configuration file. Then, we will see the running configuration:
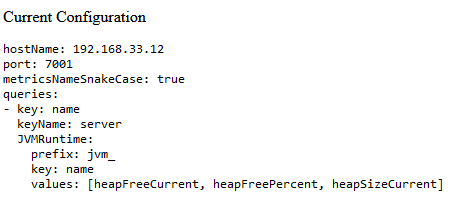
When I refresh the metrics page, now I can see some metrics:
wls_jvm_heap_free_current{server="AdminServer",name="AdminServer"} 283142888
wls_jvm_heap_free_percent{server="AdminServer",name="AdminServer"} 58
wls_jvm_heap_size_current{server="AdminServer",name="AdminServer"} 481820672
wls_jvm_heap_size_max{server="AdminServer",name="AdminServer"} 481820672
wls_jvm_process_cpu_load{server="AdminServer",name="AdminServer"} 0.5
wls_jvm_uptime{server="AdminServer",name="AdminServer"} 4674528
wls_scrape_mbeans_count_total{instance="192.168.33.12:7001"} 6
wls_scrape_duration_seconds{instance="192.168.33.12:7001"} 0.02
wls_scrape_cpu_seconds{instance="192.168.33.12:7001"} 0.03
exporter_version{instance="192.168.33.12:7001",version="v2.1.2"} 1
Now, let’s add it into Prometheus configuration.
Prometheus Configuration
Prometheus metrics are pulled from exporter, so I must declare it in prometheus.yml configuration file. In scrap_configs section of the file, I added the following lines:
  - job_name: "WebLogicAdmin"
    metrics_path: /wls-exporter/metrics
    static_configs:
    - targets: ['192.168.33.12:7001']
      labels:
        weblogic_clusterName: 'Standalone'
        weblogic_domainName: 'wls-domain'
        weblogic_domainUID: 'wls-domain'
        weblogic_serverName: 'admin'
    basic_auth:
      username: weblogic
      password: ******

  - job_name: "WebLogicMS"
    metrics_path: /wls-exporter/metrics
    static_configs:
    - targets: ['192.168.33.12:8003']
      labels:
        weblogic_clusterName: 'Standalone'
        weblogic_domainName: 'wls-domain'
        weblogic_domainUID: 'wls-domain'
        weblogic_serverName: 'msWS-1'
    basic_auth:
      username: weblogic
      password: ******
Metrics are labelled so that we can use the Grafana dashboard example provided in the github repo under samples\kubernetes\end2end\dashboard. This is not the best as it is hard-coded whereas everything could be deduced from metrics labels.
As password is not encrypted (only base64), it is strongly recommended to use https encryption between Prometheus and WebLogic server.
Results and Next Steps
Here is how it looks in the provided Grafana dashboard:
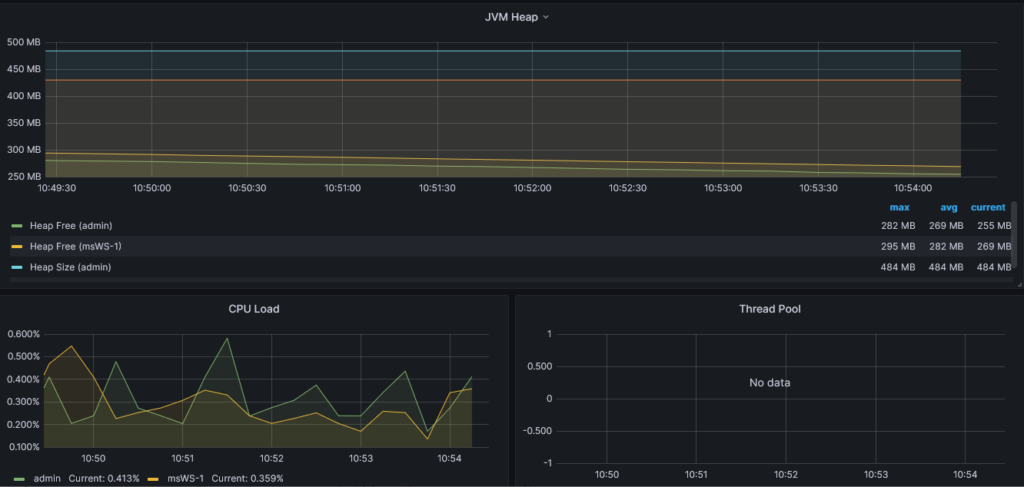
It looks great and it was quickly provisioned.
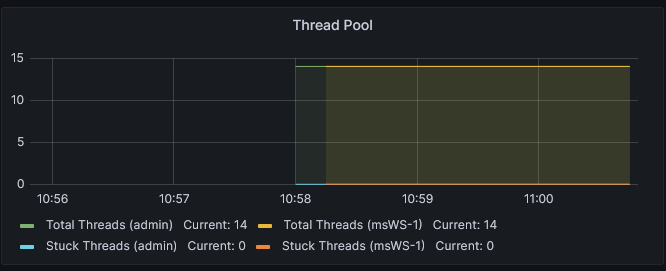
As you might have noticed “Thread Pool” panel is empty. To have it populated, we must modify exporter configuration to include threads metrics. The extra queries will look like this:
- threadPoolRuntime:
    prefix: wls_threadpool_
    key: name
    values: [executeThreadTotalCount, queueLength, stuckThreadCount, hoggingThreadCount, standbyThreadCount, executeThreads, executeThreadIdleCount]
“Et voilà !”:

![Thumbnail [90x90]](https://www.dbi-services.com/blog/wp-content/uploads/2022/08/GRE_web-min-scaled.jpg)
![Thumbnail [90x90]](https://www.dbi-services.com/blog/wp-content/uploads/2022/09/DDI_web-min-scaled.jpg)
![Thumbnail [90x90]](https://www.dbi-services.com/blog/wp-content/uploads/2022/08/ADE_WEB-min-scaled.jpg)
GGteam
02.01.2025Hola
Me sale este error
Error scraping target: non-compliant scrape target sending blank Content-Type and no fallback_scrape_protocol specified for target
Me podrían Gracias
Morgan Patou
13.01.2025Hello,
This is currently a bug on the exporter provided by Oracle that isn't compatible with Prometheus 3.0. You can find more details by following this issue on GitHub: https://github.com/oracle/weblogic-monitoring-exporter/issues/507. Until it's fixed, you can workaround that issue by setting the following in the scrape job:
fallback_scrape_protocol: PrometheusText0.0.4Cheers,
Morgan Patou