In this blog, we will see how easy it is to add a WildFly server into a Prometheus setup.
Metrics
Fortunately, WildFly comes with a integrated metrics subsystem which is included in all out-of-the-box profiles.
In the management console, we can go in subsystem and then metric menu to access settings:

There are not many parameters, but I will not complain. By default, all subsystems’ metrics are exposed with wildfly as prefix and without any security restriction.
So let’s confirm metrics are exposed by accessing metrics URL (http://<hostname>:9990/metrics):
# HELP base_classloader_loadedClasses_total Displays the total number of classes that have been loaded since the Java virtual machine has started execution.
# TYPE base_classloader_loadedClasses_total counter
base_classloader_loadedClasses_total 21584.0
# HELP base_classloader_loadedClasses_count Displays the number of classes that are currently loaded in the Java virtual machine.
# TYPE base_classloader_loadedClasses_count gauge
base_classloader_loadedClasses_count 21433.0
# HELP base_classloader_unloadedClasses_total Displays the total number of classes unloaded since the Java virtual machine has started execution.
# TYPE base_classloader_unloadedClasses_total counter
base_classloader_unloadedClasses_total 151.0
# HELP base_cpu_availableProcessors Displays the number of processors available to the Java virtual machine. This value may change during a particular invocation of the virtual machine.
# TYPE base_cpu_availableProcessors gauge
base_cpu_availableProcessors 2.0
# HELP base_cpu_processCpuLoad Displays the "recent cpu usage" for the Java Virtual Machine process.
# TYPE base_cpu_processCpuLoad gauge
base_cpu_processCpuLoad 0.01848998459167951
...
We are ready to integrate it into Prometheus.
Prometheus Integration
To achieve that, we will edit Prometheus configuration file (i.e. prometheus.yml) and add a new job:
scrape_configs:
  - job_name: 'metrics'
    scrape_interval: 15s
    static_configs:
      - targets: ['hostname:9990']
Then, we can start our Prometheus server and confirm if metrics are gathered properly. For that, go on http://prometheus:9090/ and browse to Status and then Targets:
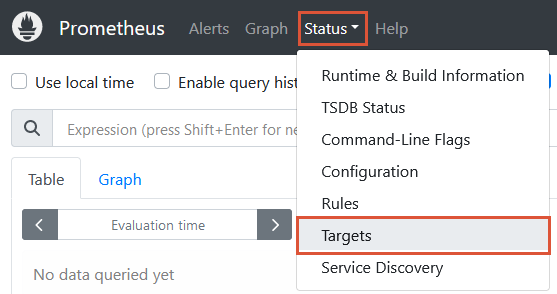
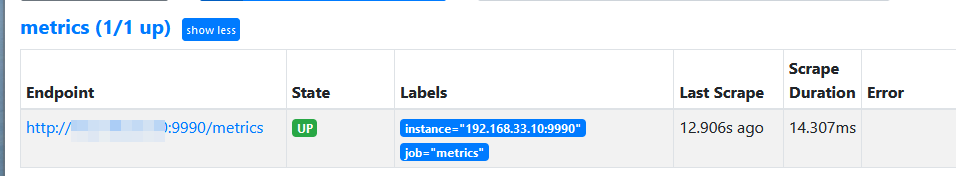
You should see the WildFly endpoint in the list with a “UP” state:
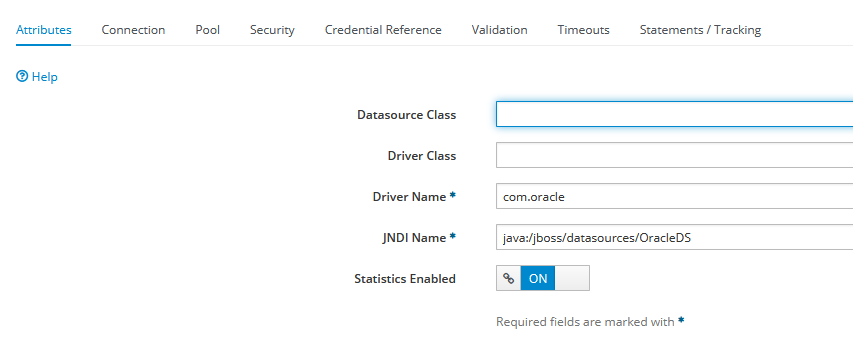
Even if all subsystems are exposed, that does not necessarily mean everything in the subsystem is exposed. For example, I have a JDBC data source declared in my configuration, but I can’t find any metrics in the list. This has to be enabled on per data source basis.
Default state (Statistics Enabled = false):

Click “Edit” and switch statistics ON:
This can also be done with jboss-cli command:
/subsystem=datasources/data-source=:write-attribute(name=statistics-enabled,value=true)
Now, refresh WildFly metrics web page to see the new metrics:
...
# HELP wildfly_datasources_pool_active_count The active count
# TYPE wildfly_datasources_pool_active_count gauge
wildfly_datasources_pool_active_count{data_source="OracleDS"} 1.0
# HELP wildfly_datasources_pool_available_count The available count
# TYPE wildfly_datasources_pool_available_count gauge
wildfly_datasources_pool_available_count{data_source="OracleDS"} 20.0
# HELP wildfly_datasources_pool_average_blocking_time Average Blocking Time for pool
# TYPE wildfly_datasources_pool_average_blocking_time gauge
wildfly_datasources_pool_average_blocking_time{data_source="OracleDS"} 0.0
# HELP wildfly_datasources_pool_average_creation_time The average time spent creating a physical connection
# TYPE wildfly_datasources_pool_average_creation_time gauge
wildfly_datasources_pool_average_creation_time{data_source="OracleDS"} 3138.0
# HELP wildfly_datasources_pool_average_get_time The average time spent obtaining a physical connection
# TYPE wildfly_datasources_pool_average_get_time gauge
wildfly_datasources_pool_average_get_time{data_source="OracleDS"} 652.0
# HELP wildfly_datasources_pool_average_pool_time The average time for a physical connection spent in the pool
# TYPE wildfly_datasources_pool_average_pool_time gauge
wildfly_datasources_pool_average_pool_time{data_source="OracleDS"} 5890.0
# HELP wildfly_datasources_pool_average_usage_time The average time spent using a physical connection
# TYPE wildfly_datasources_pool_average_usage_time gauge
wildfly_datasources_pool_average_usage_time{data_source="OracleDS"} 4.0
...
There are similar settings for almost all subsystems like, for example, undertow the web server part:
/subsystem=undertow:write-attribute(name=statistics-enabled,value=true)
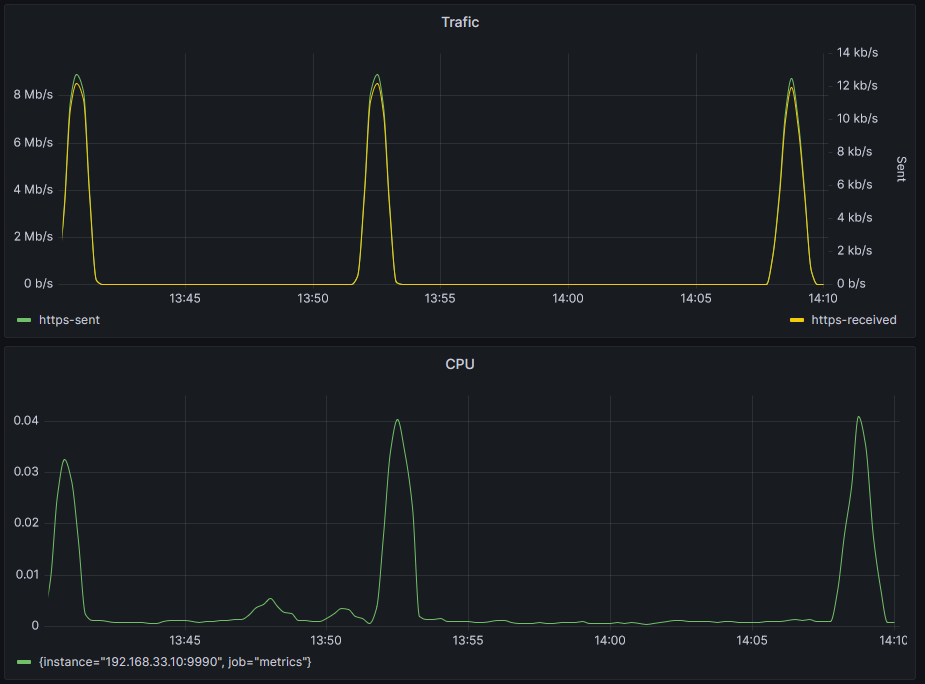
What’s Next?
Then, it is just a matter of configuring Grafana to query Prometheus and add metrics in dashboards:
A similar method can be applied to JBoss EAP.
![Thumbnail [90x90]](https://www.dbi-services.com/blog/wp-content/uploads/2022/08/GRE_web-min-scaled.jpg)
![Thumbnail [90x90]](https://www.dbi-services.com/blog/wp-content/uploads/2022/08/ADE_WEB-min-scaled.jpg)
![Thumbnail [90x90]](https://www.dbi-services.com/blog/wp-content/uploads/2022/08/NME_web-min-scaled.jpg)
barmalei
07.11.2024How to enable url /metrics in wildfly. Thanks