We sow together how to install and configure Filebeat, Logstash and Elasticsearch. Our log data has been sent from Filebeat to Logstash, then forwarded to Elasticsearch. In this blog, we will see how to configure Kibana and discover our data.
Data Stream vs Index
A data stream lets you store append-only time series data across multiple indices while giving you a single named resource for requests. Data streams are well-suited for logs, events, metrics, and other continuously generated data.
You can submit indexing and search requests directly to a data stream. The stream automatically routes the request to backing indices that store the stream’s data.
A data stream consists of one or more hidden, auto-generated backing indices.
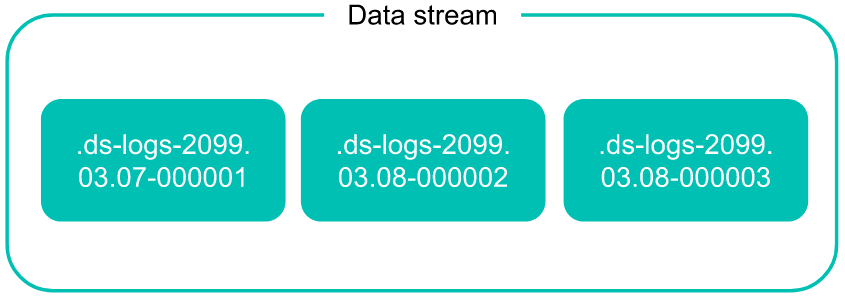
This correspond to our use case, so we have a Data Stream “logs-generic-default” and hidden index “.ds-logs-generic-default-2023.10.12-000001“.
Data view
In fact, Kibana requires a data view to access the Elasticsearch data that you want to explore. The data view is based on an index pattern which selects the data to use.
An index pattern can point to one or more indices, data stream, or index aliases. For example, an index pattern can point to your log data from yesterday, or all indices that contain your data.
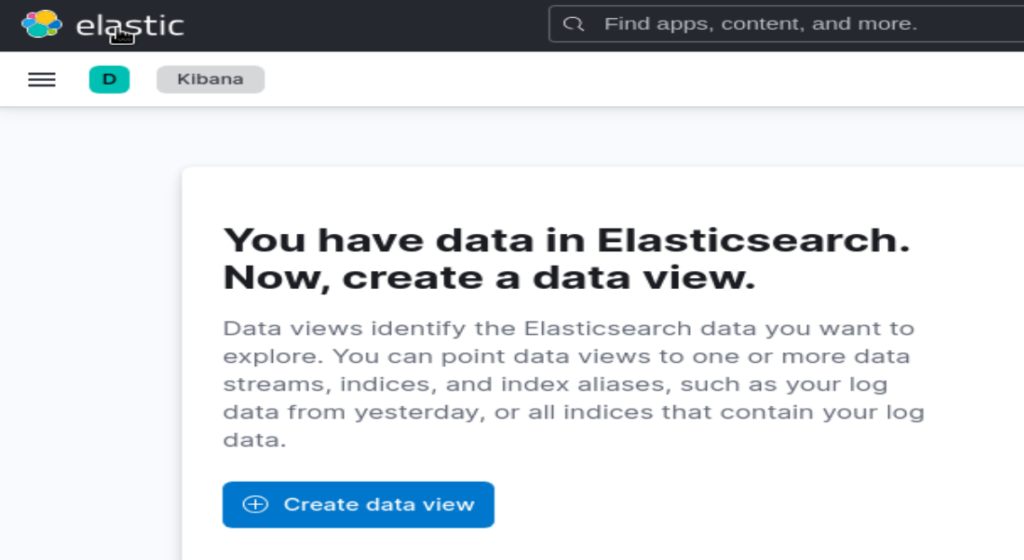
To create your data view, click on “Create data view” in “Discover”:
Or, follow these steps:
- Open the main menu, then click to Stack Management > Data Views.
- Click Create data view.
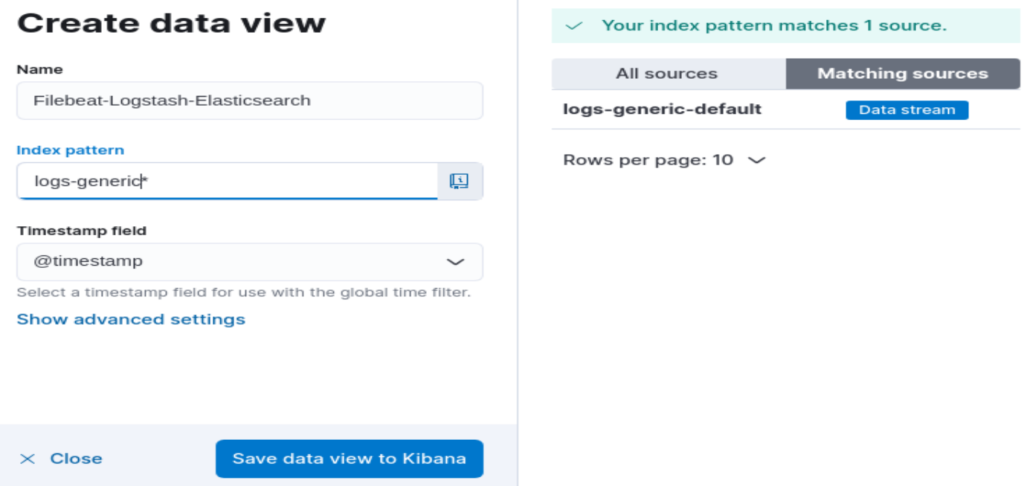
Following both ways, the below form appear:
Give a name to the data view, specify the Index pattern which match with the index or indices. Then click on “Save data view to Kibana”.
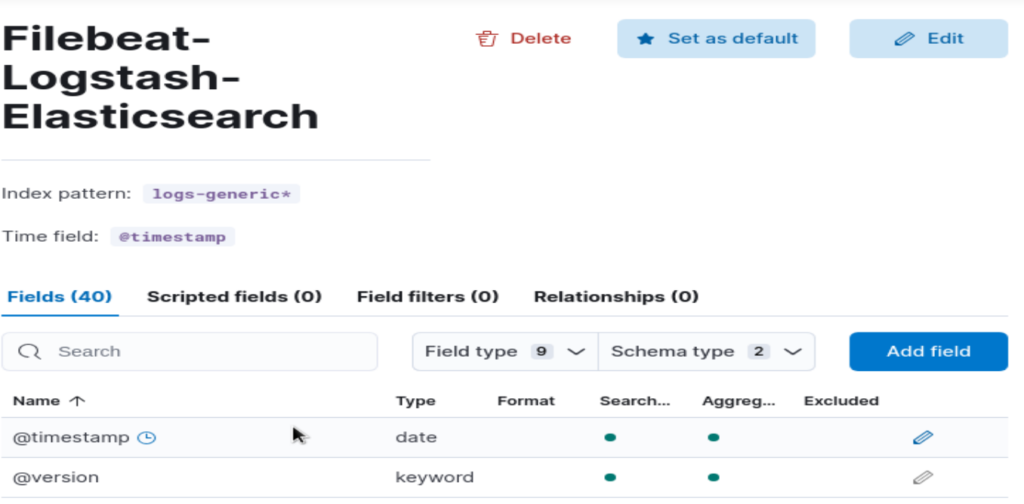
The view could be updated or deleted at any time:
Go back to “Discover”, the view we created is selected by default as it is the only one:
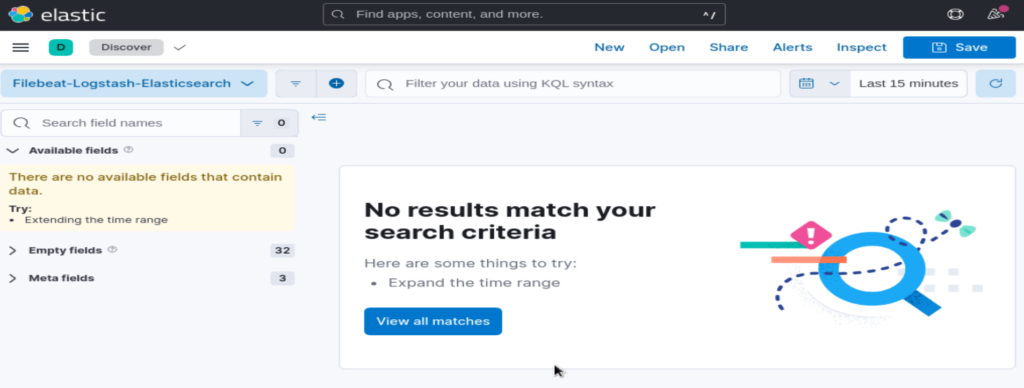
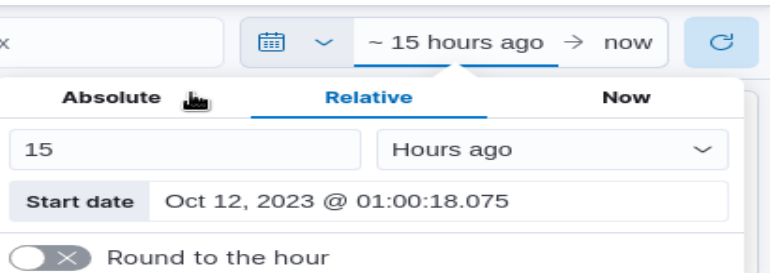
No results match our search criteria, because we are looking for entries in last 15 minutes only. Update the time filter on the top right. and put 15 hours instead:
Now we have data:

As explained in the previous blog, each line in the log file is considered as a separate entry by Filebeat. In Elasticsearch an entry is a document, which is a json object.
Let’s explore the first document in json:
{
  "_index": ".ds-logs-generic-default-2023.10.12-000001",
  "_id": "MDYEJIsBhUUDY9jEKY1i",
  "_version": 1,
  "_score": 0,
  "_source": {
    "input": {
      "type": "log"
    },
    "agent": {
      "name": "vmelastic",
      "id": "b9b7d708-be91-4bb9-b2f4-7910e65a6be4",
      "type": "filebeat",
      "ephemeral_id": "2cad7906-53bc-4a79-a83b-6d7977e239d8",
      "version": "8.10.2"
    },
    "@timestamp": "2023-10-12T13:12:13.305Z",
    "ecs": {
      "version": "8.0.0"
    },
    "log": {
      "file": {
        "path": "/var/log/elasticsearch/elasticsearch.log"
      },
      "offset": 32657
    },
    "data_stream": {
      "namespace": "default",
      "type": "logs",
      "dataset": "generic"
    },
    ...
    "@version": "1",
    "message": "[2023-10-12T15:12:12,217][INFO ][o.e.c.m.MetadataCreateIndexService] [vmelastic] [.ds-logs-generic-default-2023.10.12-000001] creating index, cause [initialize_data_stream], templates [logs], shards [1]/[1]",
...
Search
Your huge volumes of data is searchable in near real time!
Let’s search for “generic”:
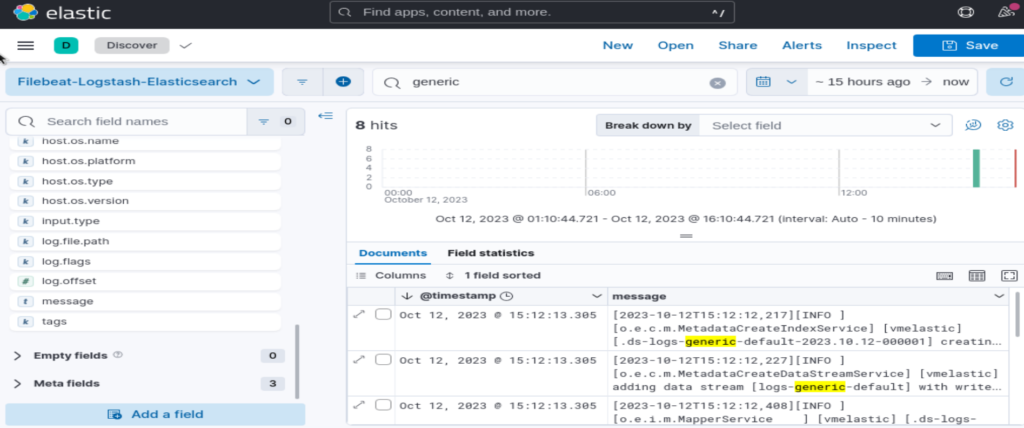
At the end of this use case, I let you imagine all your data (metrics, log files, business data, etc) centralized in Elasticsearch. All your data are searchable and analyzed in near real time. Enjoy 😉
![Thumbnail [60x60]](https://www.dbi-services.com/blog/wp-content/uploads/2022/09/DDI_web-min-scaled.jpg)