As promised in the previous blog, I will show how to configure Filebeat to push logs to Logstash, then to Elasticsearch. This for sure will not cover all use cases, but will give you an idea on how it works.
Configure Filebeat
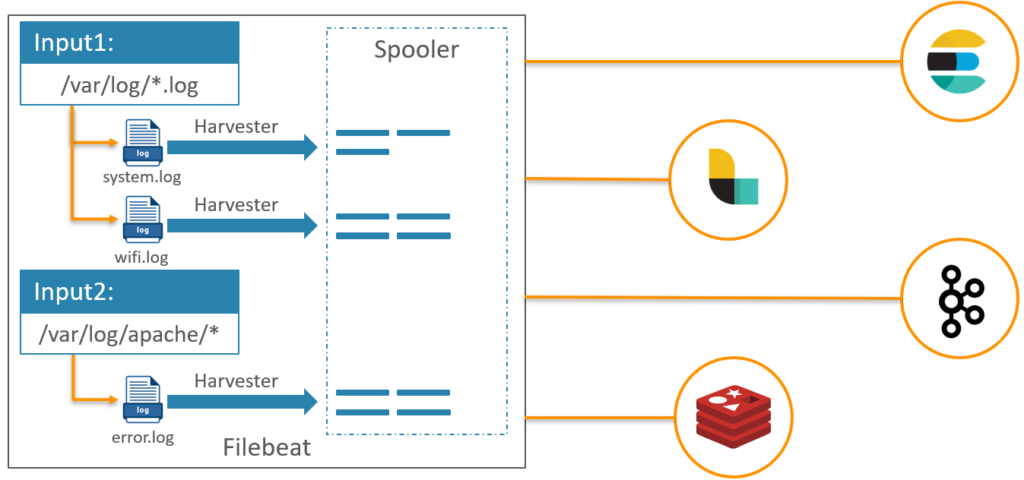
First of all, let’s understand how Filebeat works.
We have to configure inputs and outputs, once Filebeat starts it looks in the locations we specified and start a harvester for each log file found. Harvesters send log data to libbeat, which send data to the output(s) defined.
Each new line in the log file detected is considered as new entry.
As you can see in the below, many inputs and outputs could be defined.
In our use case we will send the data from Filebeat to Logstash. For that we will need to update the filebeat.yml. In the inputs section, add an input to push Elasticsearch logs.
# ============================== Filebeat inputs ===============================

filebeat.inputs:
- type: log
  paths:
    - /var/log/elasticsearch/elasticsearch.log
  multiline.pattern: '^\[[0-9]{4}-[0-9]{2}-[0-9]{2}'
  multiline.negate: true
  multiline.match: after
What multiline configuration mean?
The file harvested by Filebeat may contain messages that span multiple lines of text. For example, multiline messages are common in files that contain Java stack traces. In order to correctly handle these multiline events configure a pattern, and so Filebeat group all the lines in one entry which make more sense!
Still in filebeat.yml file, in the outputs section:
# ------------------------------ Logstash Output -------------------------------
output.logstash:
  # The Logstash hosts
  hosts: ["localhost:5044"]
Don’t start Filebeat before Logstash is configured and ready.
Configure Logstash
Filebeat is able to send data directly to Elasticsearch, but in some use cases we need to filter or transform data, so Logstash is needed. I will publish a dedicated blog showing how to filter/transform data using Logstash, that’s why this will not be covered in this blog.
Create a configuration file in config folder, containing input and output:
input {
  beats {
    port => 5044
  }
}

output {
  elasticsearch {
    hosts => ["http://localhost:9200"]
  }
}
This means that data will be received from beats, and should be sent to Elasticsearch.
Here Filebeat, Logstash and Elasticsearch have been installed on the same server, if it is not your case the only change to do is on hosts value!
Start Logstash pointing to the config file just created, e.g.:
$LOGSTASH_HOME/bin/logstash -f $LOGSTASH_HOME/config/beats.confLogstash log should look like:
[2023-10-12T14:50:39,856][INFO ][org.logstash.beats.Server][main][07404911f6955878a51e8dfe9c8b1b8d65de08b278ae40b3521288a61a3e6ec6] Starting server on port: 5044
[2023-10-12T14:50:39,941][INFO ][logstash.agent           ] Pipelines running {:count=>1, :running_pipelines=>[:main], :non_running_pipelines=>[]}
Remember, we didn’t start Filebeat so no data has been sent to Logstash yet.
Configure Elasticsearch
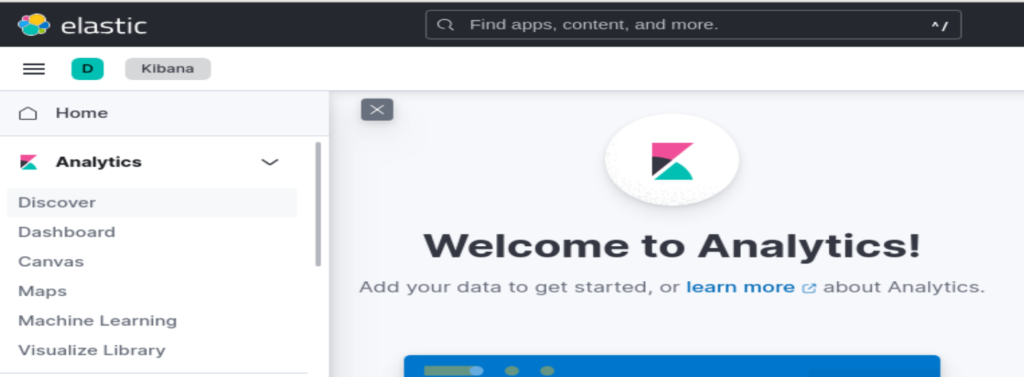
At this stage, Elasticsearch and Logstash are already running, no data received yet!
Check “Discover” on Kibana show that there is no data.
Start filebeat:
$FILEBEAT_HOME/filebeat -eCheck again the “Discover” on Kibana:
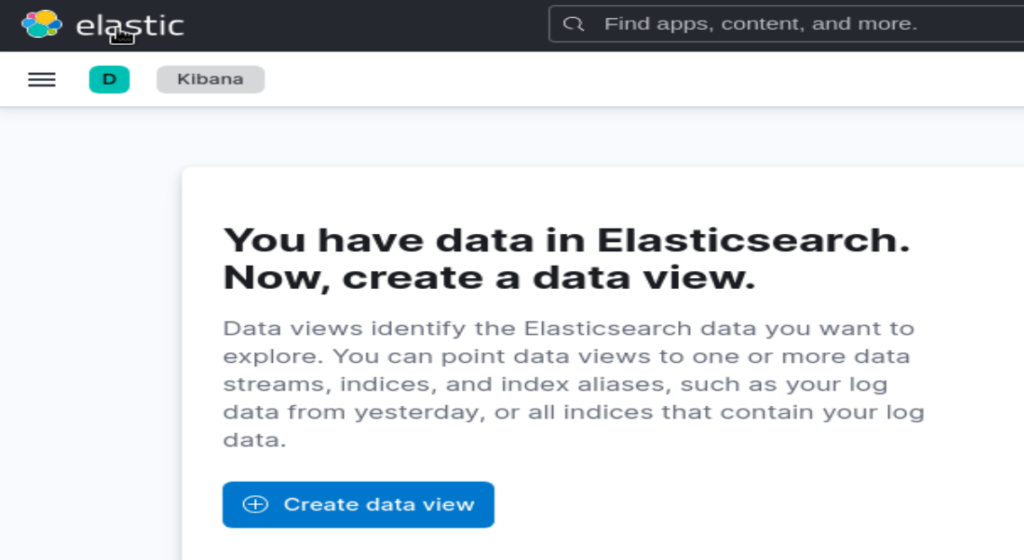
We have data in Elasticsearch now!
In the next blog, I will share how to configure Kibana to discover the data stored in Elasticsearch.
![Thumbnail [60x60]](https://www.dbi-services.com/blog/wp-content/uploads/2022/09/DDI_web-min-scaled.jpg)