Introduction
During a previous post, we have seen how to find the creator of a workload policy using BMC reports tool.
Indeed , this tool can be helpful to perform tasks such an audit of Control-M components, checking active peak usage , monitor quantitative resource ,sort jobs related to a specific host or hostgroup and many other things to retrieve
During your Control-M daily tasks, some requester can ask you to get statistics from their jobs ( for example to confirm their execution during the last month
Today we will see how to use it to generate a report for a specific job during a specific period
Connect to Control-M reports
- Start Control-M GUI
- In the tool pane select ” Control-M Reports “
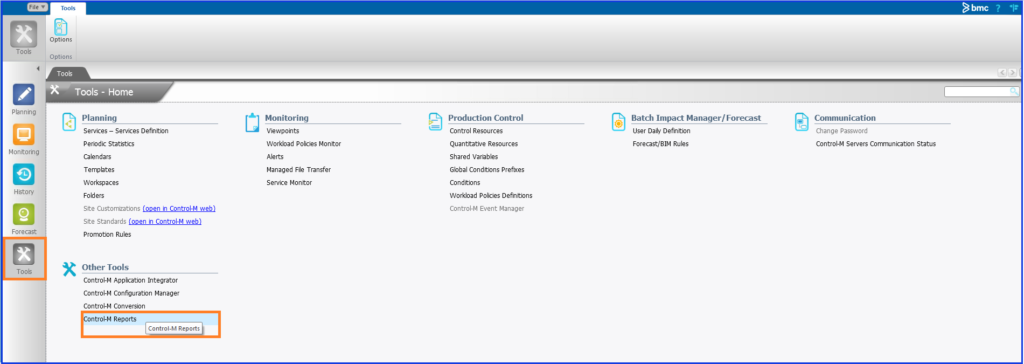
- The Control-M report windows will display
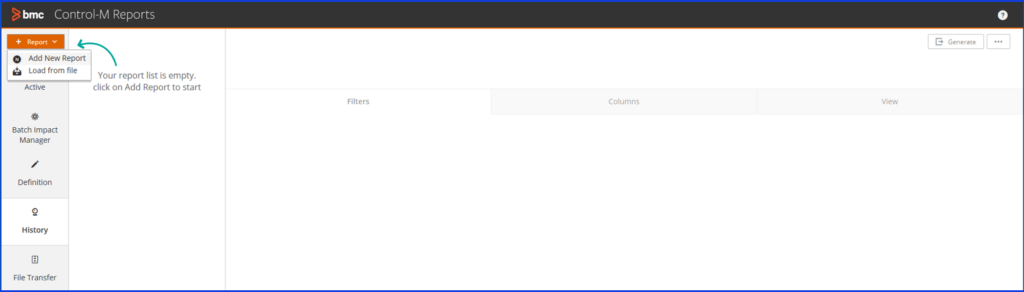
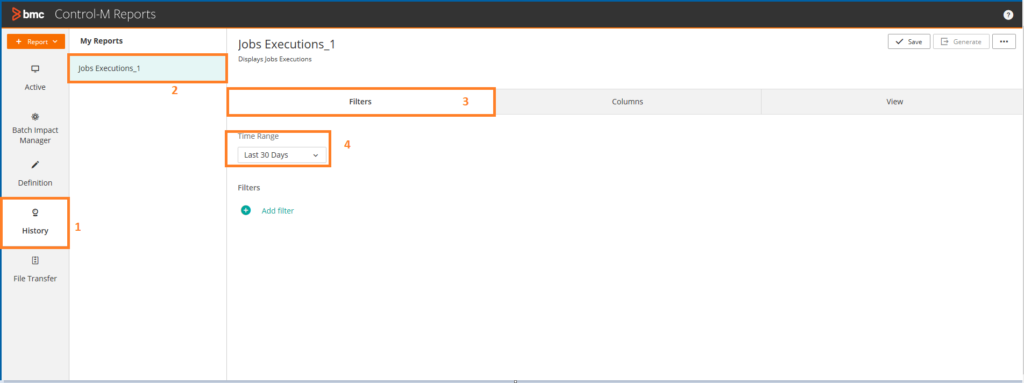
- select the History part to get a report related to the job history
- Select add new report
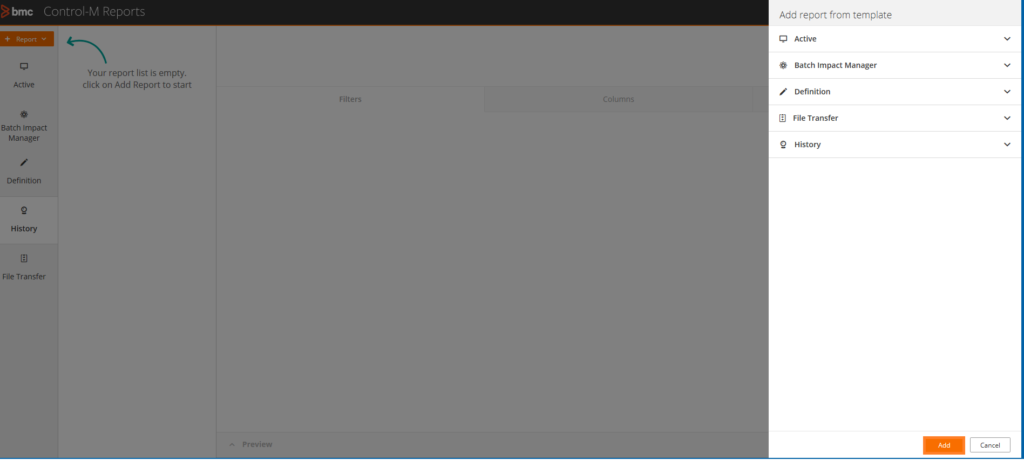
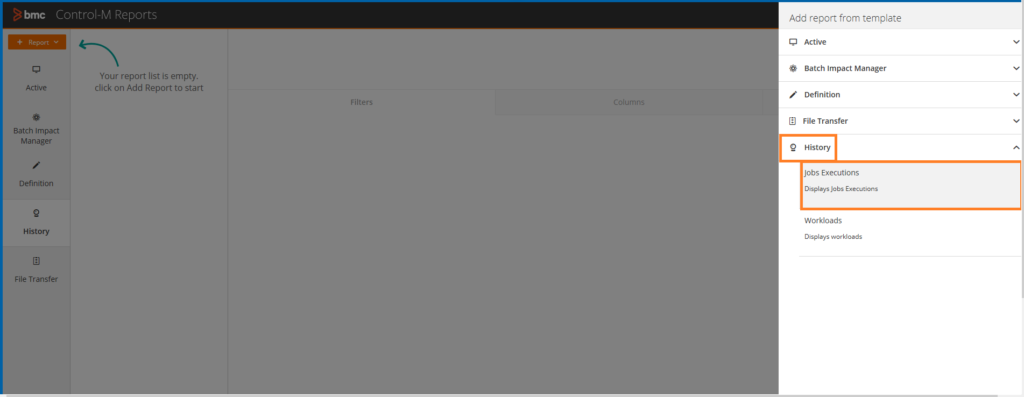
- Open the history drop down menu in right pane
- Select jobs execution and click on add
Use the filters to make the report
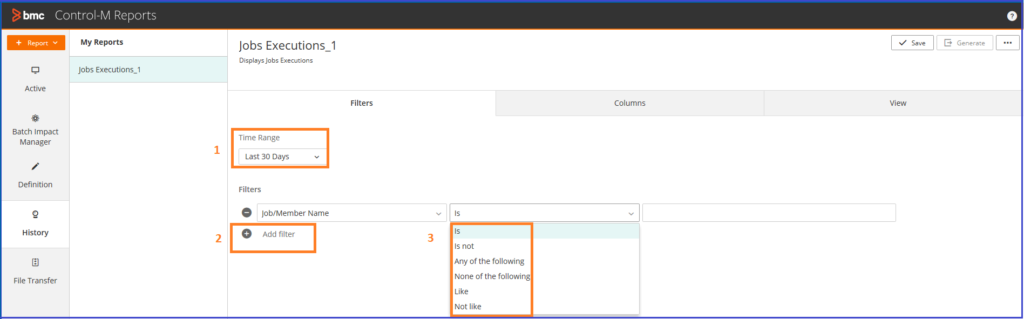
- Use the filter tab to select the time range
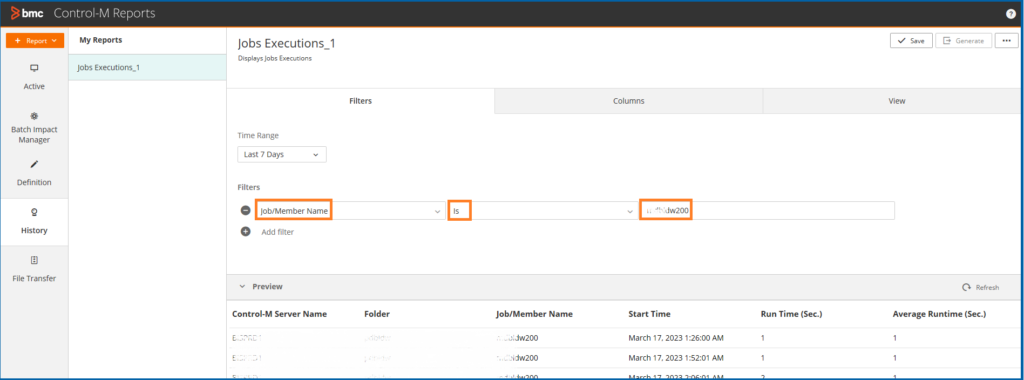
- Select the job/Member name option to filter your report by jobname
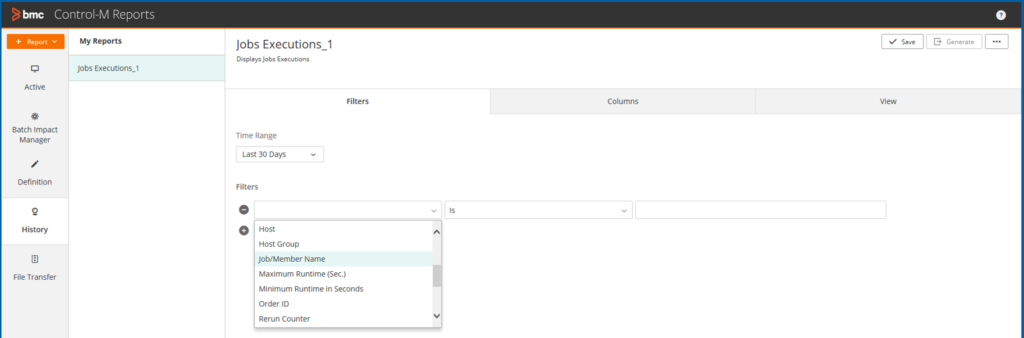
- Choose the comparison field to find your job
Reminder:
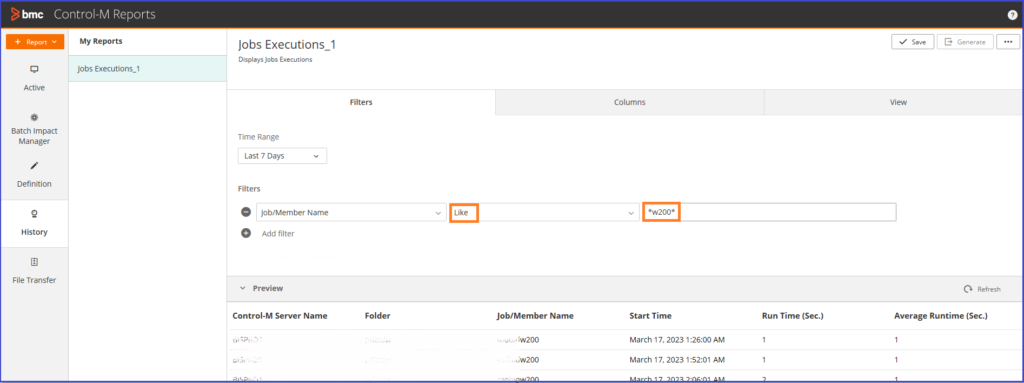
- If you use the IS parameter you should enter the exact name of the job you are looking for ( wildcard will be used for the LIKE parameter )
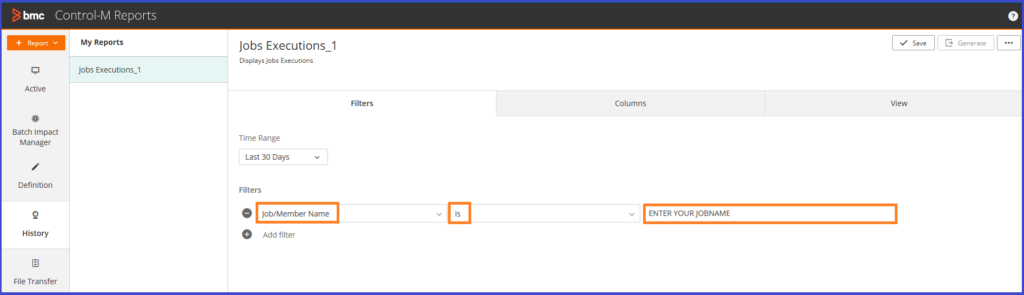
- Once all the filters fields are filled click on refresh and see if job is displaying
- To select one or more jobs you can use the Like parameter and the * symbol
Note:
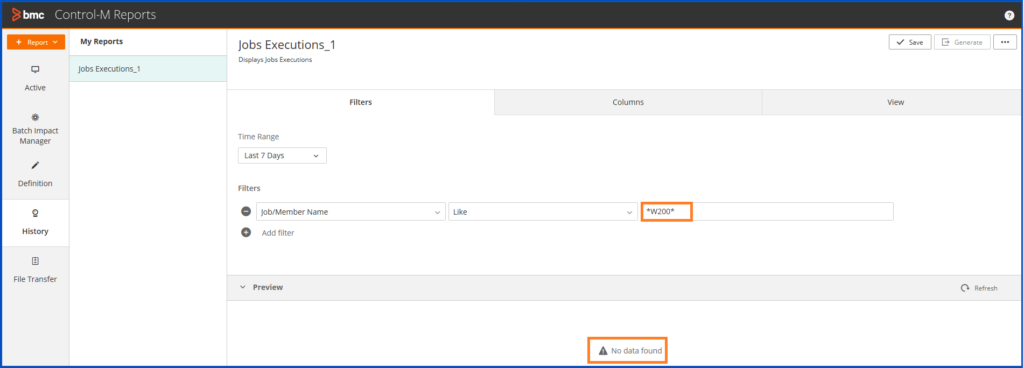
- Beware of the CAPS usage below an example to show you that the search is not case sensitive:
- Here when you do a refresh no job is displayed
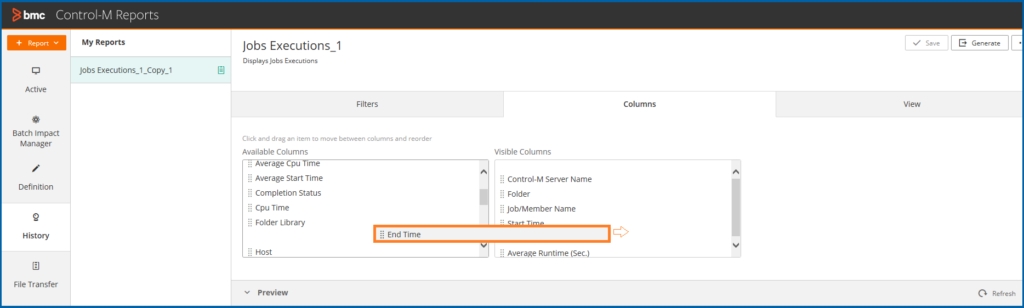
- Add the columns you need
- In the first report we miss one field regarding the end time , let’s add it by using the column chooser
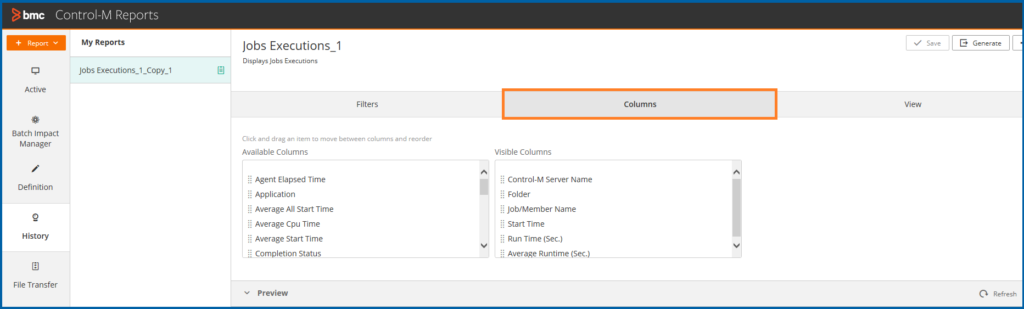
- Drag and drop it in the visible columns
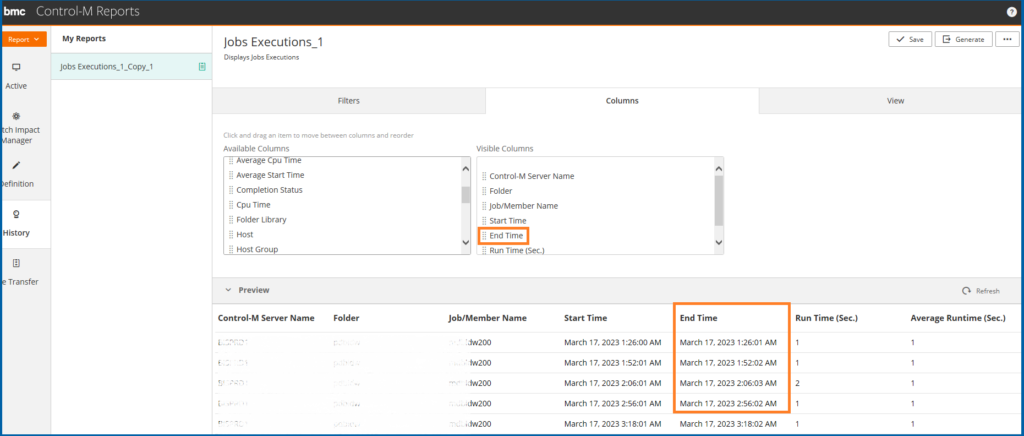
- Perform a refresh, the end time column is now displaying
Generate report
You can now generate your report and save it
Go on the top right hand corner and click on generate
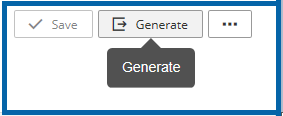
- Click on it : The report will be generated
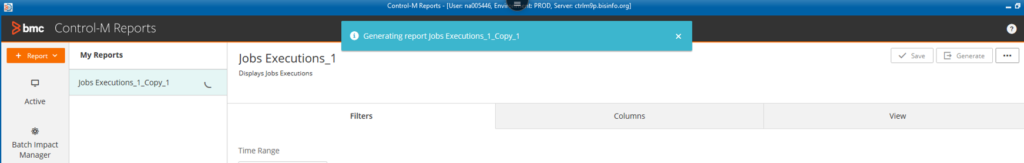
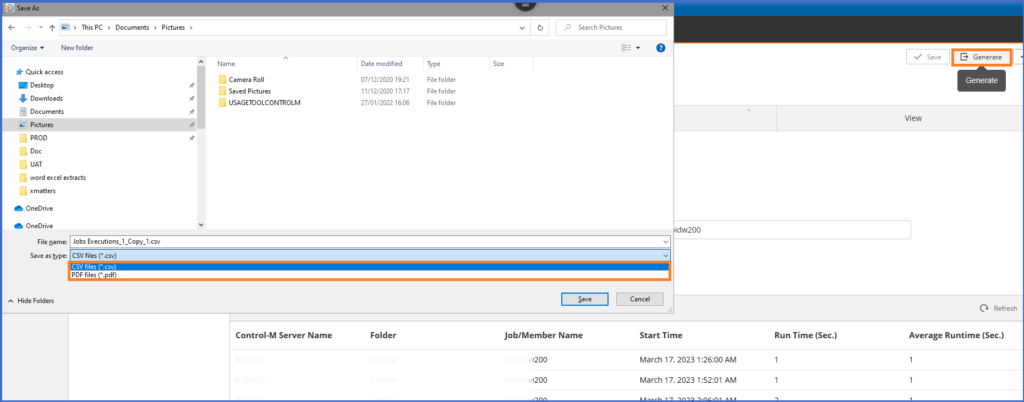
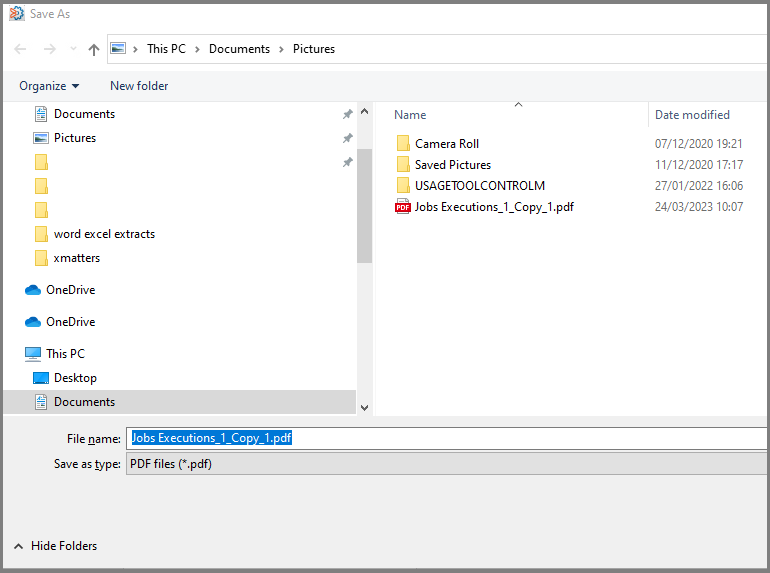
- Select the file type ( CSV or PDF ) and save it
- You can now open your PDF report and see if all is displaying as expected
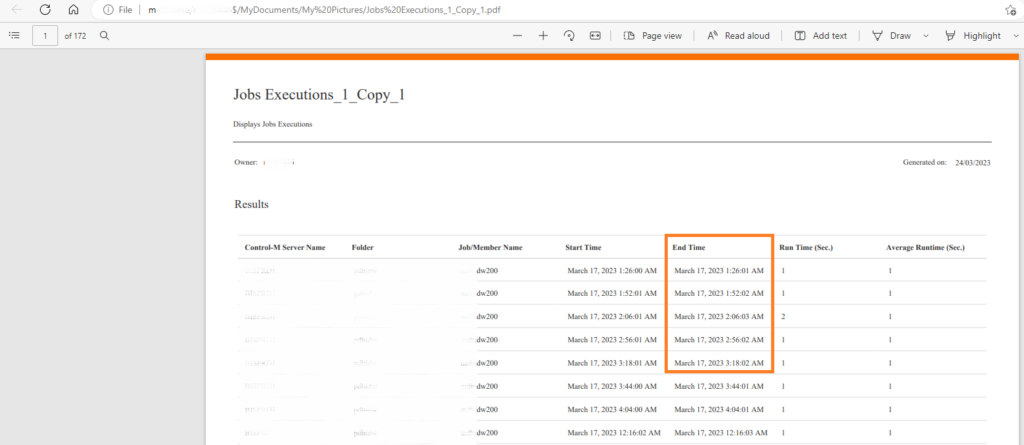
Open your file
- We can see that “End Time” field is here as expected
Optional : Save your template to load it later
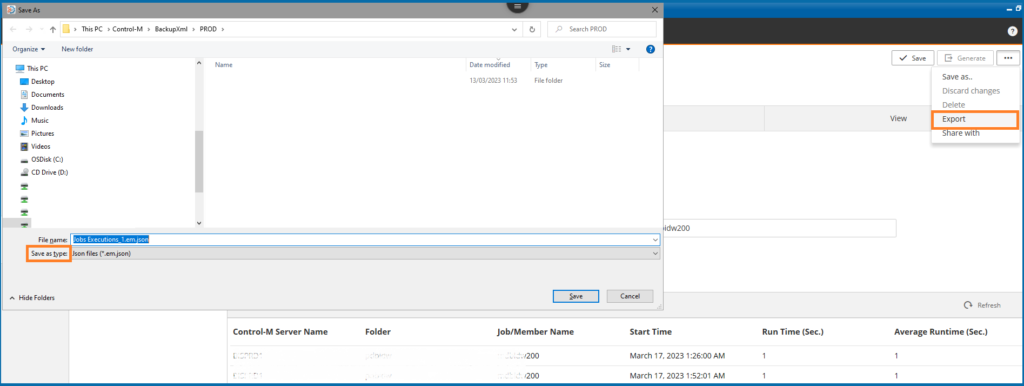
- Export file format JSON for your template
- Select export and choose json format ( after that you will be able to load this template and even share it we will se how in another blog )
- Now suppose you have deleted your report you can Load the json file to have your saved template ( every user with this file can load this template, using sharing option can be easier to send this template to many users we will see that in another blog )
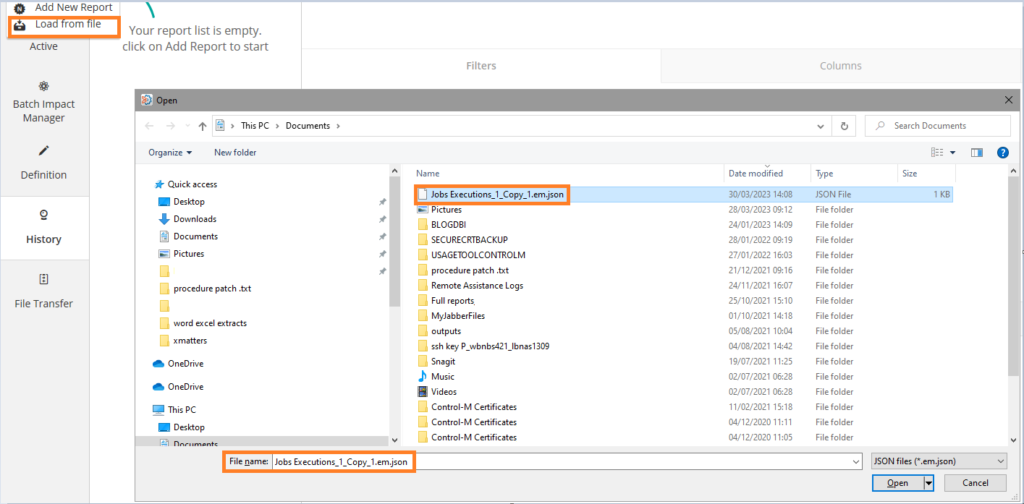
- Your template is loaded with all the filters you made inside.
- It’s now displaying 🙂
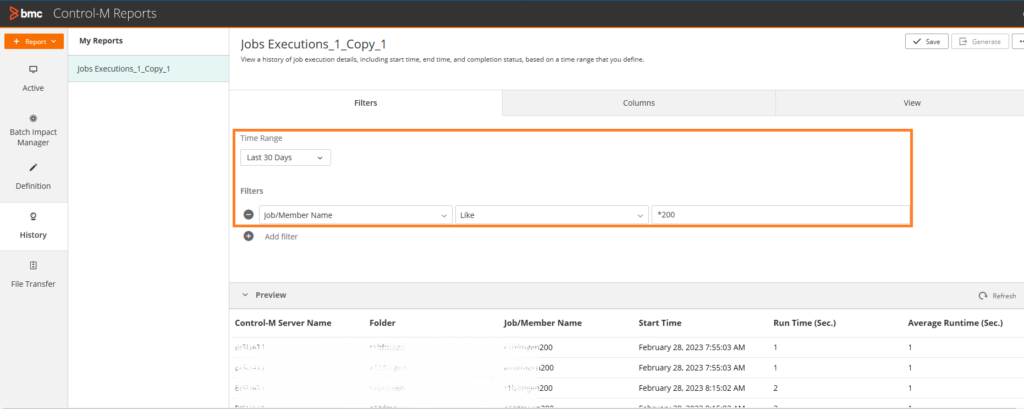
- You can save it again or update it (for example changing the time range field)
Conclusion
That’s it you know to generate a report of your jobs and you can modulate your requests inside to display the field you want 🙂
You can use Control-M report to sort many types of information related to yours jobs and also to monitor the activity
Another interesting feature of the Control-M reports tool is that we can share our templates with other users, we will se that in a coming Blog
Feel free to share with us the dbi bloggers and also check my other posts
I hope it helped you to discover this tool and that it will give you many ideas to use it! 🙂
![Thumbnail [90x90]](https://www.dbi-services.com/blog/wp-content/uploads/2022/09/DDI_web-min-scaled.jpg)
Nanda more
13.12.2023After extracting the history . I want to know the failure count of each job in month. Please help with this