
Linux perf-top basics: understand the %
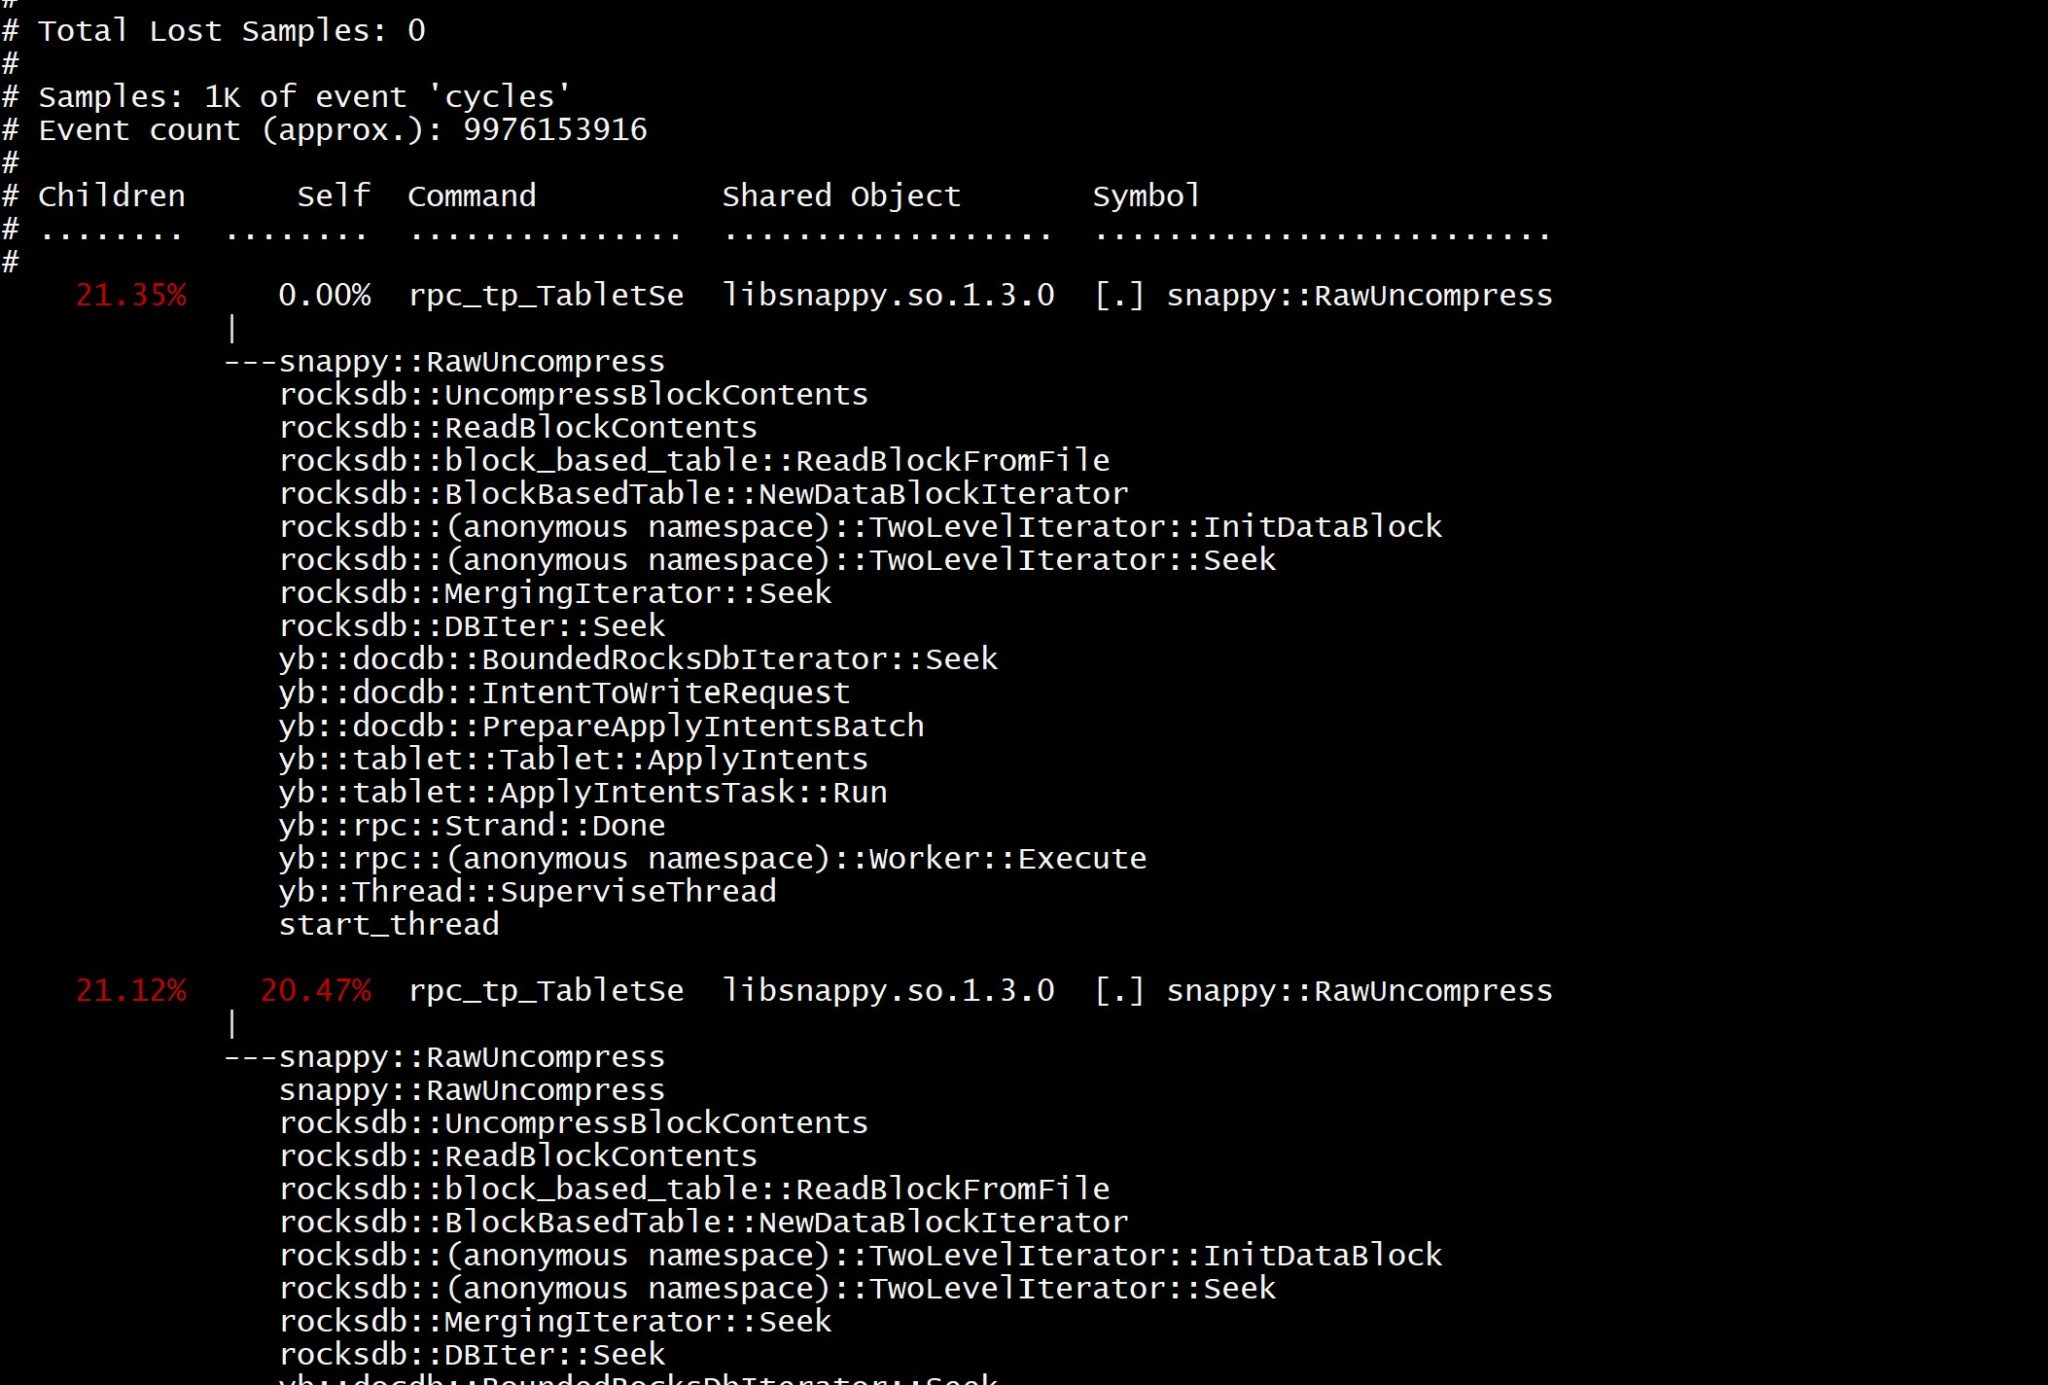
By Franck Pachot . Linux kernel has a powerful instrumentation that can be accessed easily. When you want to drill down into your program functions to understand their CPU usage, “perf” is the easiest. It can attach to the processes, sample the CPU cycles, get the symbol name, or even the call stack. And display an histogram of sample counts.…