In this short blog post, I will discuss about SUSE Rancher 2.5, the latest version.
In this release, the rancher-monitoring has been introduced.
With this cool feature, you can quickly deploy open-source monitoring as Promotheus and Grafana for your kubernetes clusters
Introduction
SUSE Rancher-monitoring can help you to ensure performance, availability, reliability and scalability.
it allows you to:
– Monitor the state and processes of all your cluster nodes, Kubernetes components, and software deployments
– Create custom dashboards via Grafana
– Configure alert-based notifications via Email, Slack and PagerDuty.
Monitoring setup
As an administrator, you can configure Rancher to deploy Prometheus to monitor your Kubernetes cluster.
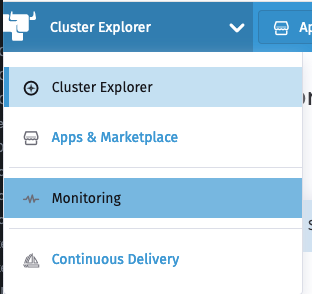
In the Rancher UI, go to the cluster where you want to install monitoring and click on “Cluster Explorer”.
 Click on the Apps button.
On the scrolling menu, choose “Monitoring”.
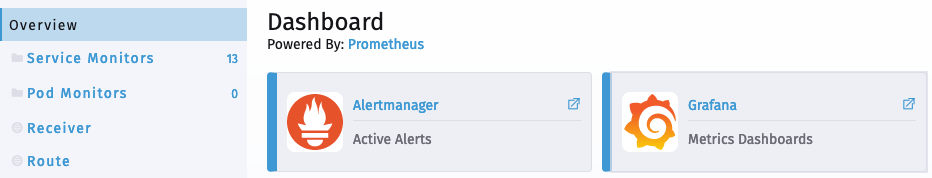
You will land then on the monitoring Dashboard where you can configure Metrics and Alerts
But Rancher Monitoring deploys, by default, some exporters as node_exporter and kube_state_metrics and also some default Prometheus alerts and Grafana dashboards onto your cluster.
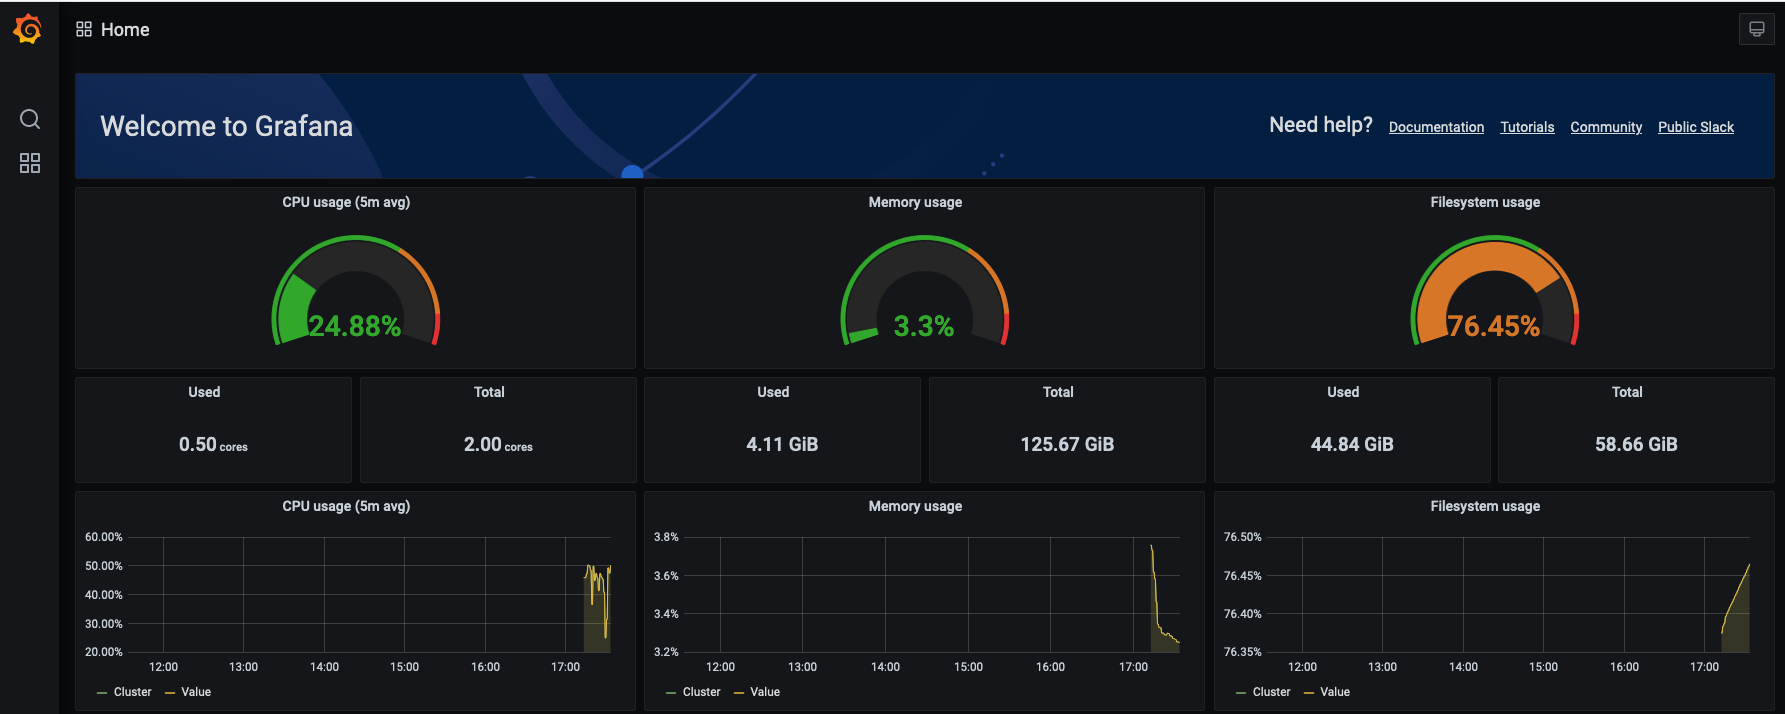
You can check this by clicking directly on the Grafana link ![]()
You will get the default home dashboard
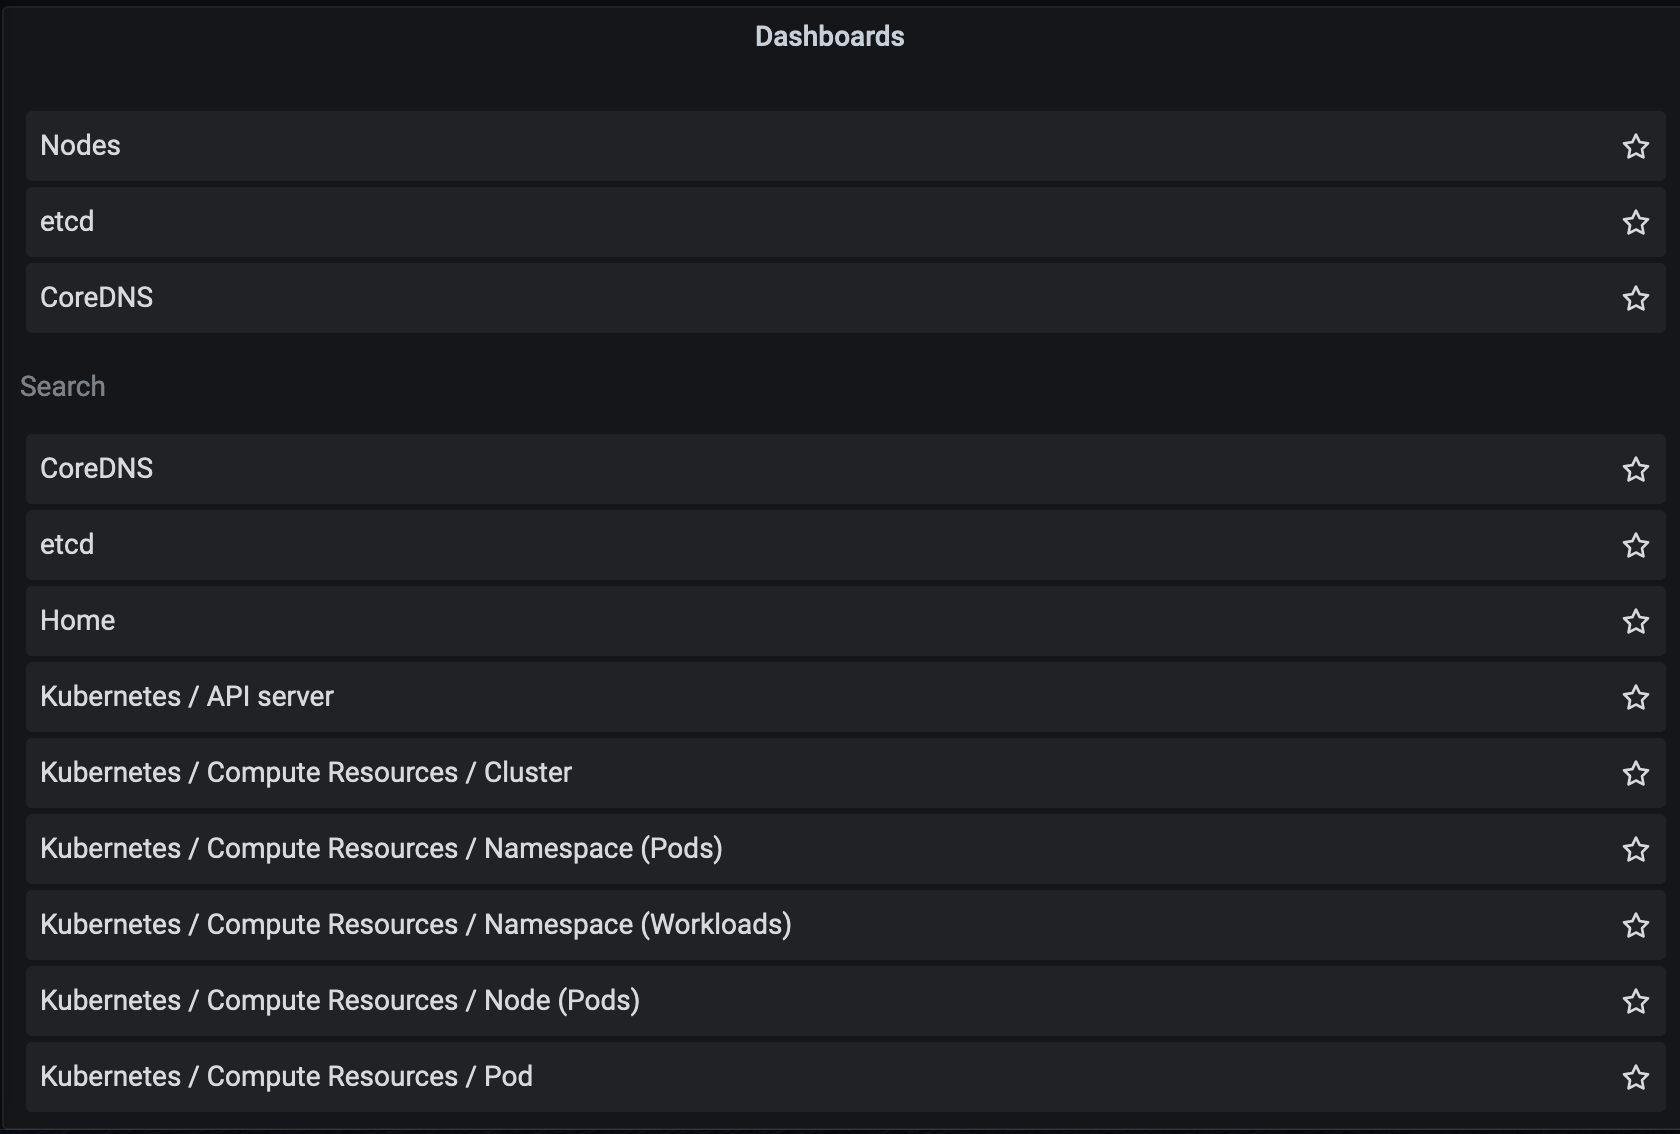
But below this chart, you can find plenty of them, already configured as Nodes, etcd and Kubernetes.
 You can optionally click Chart Options and configure the alerting, Prometheus and Grafana.
Conclusion
As you can see in this short blog post, activating monitoring is an easy game with Rancher 2.5. In another blog post, I will talk deeper about alerting.
![Thumbnail [60x60]](https://www.dbi-services.com/blog/wp-content/uploads/2022/05/open-source-author.png)
![Thumbnail [90x90]](https://www.dbi-services.com/blog/wp-content/uploads/2023/01/APY_web-scaled.jpg)
![Thumbnail [90x90]](https://www.dbi-services.com/blog/wp-content/uploads/2022/08/FRJ_web-min-scaled.jpg)