When working with any ECM solution, you will have to manage a rendition software. This is used to transform the native documents from most formats (docx, pptx, xlsx, txt, jpeg, png, svg, etc.) into another format (pdf, png, etc.). The rendition can then be used for a multitude of use-cases: thumbnails, previsualization purposes online/in a browser, for security/conformity to certain standards, for workflows like sending the PDF version to your customers, annotations, etc… Most ECM will come with it out-of-the-box (usually with no additional costs) while others will provide the necessary architecture for it but then it’s up to you to choose which rendition to plug.
In this blog, I will talk about the Documentum rendition part and more specifically about the performance/report part of it. You can use OpenText software like Documentum CTS/ADTS (Content Transformation Services / Advanced Document Transformation Services) with OpenText Blazon or you can use third-party solutions such as DocShifter or Adlib. As a lot of other features in Documentum, renditions will take advantage of the dmi_queue_item table to store documents that need a rendition and that’s therefore a good location to look at if you want to check the performance of your rendition system.
Depending on the rendition software that you are using, you might already have some out-of-the-box reports but that would usually only consider the rendition part. As mentioned, Documentum uses the dmi_queue_item table, therefore documents are being added into this queue as “waiting for rendition”. Then, the rendition server will go and pull items from this table, changing the item status as “rendition in progress”. That can take 1s, 5s, 10s or even more because it depends on whether the rendition server has enough bandwidth to process it and because it’s not a push to the rendition server but a pull from it. The next step is performing the real action and finally upload the rendition created into Documentum, attach it to the native document and change the queue item status to “rendition completed”. The “wait” time is usually not considered on the rendition server, hence why it could be interesting to create your own report.
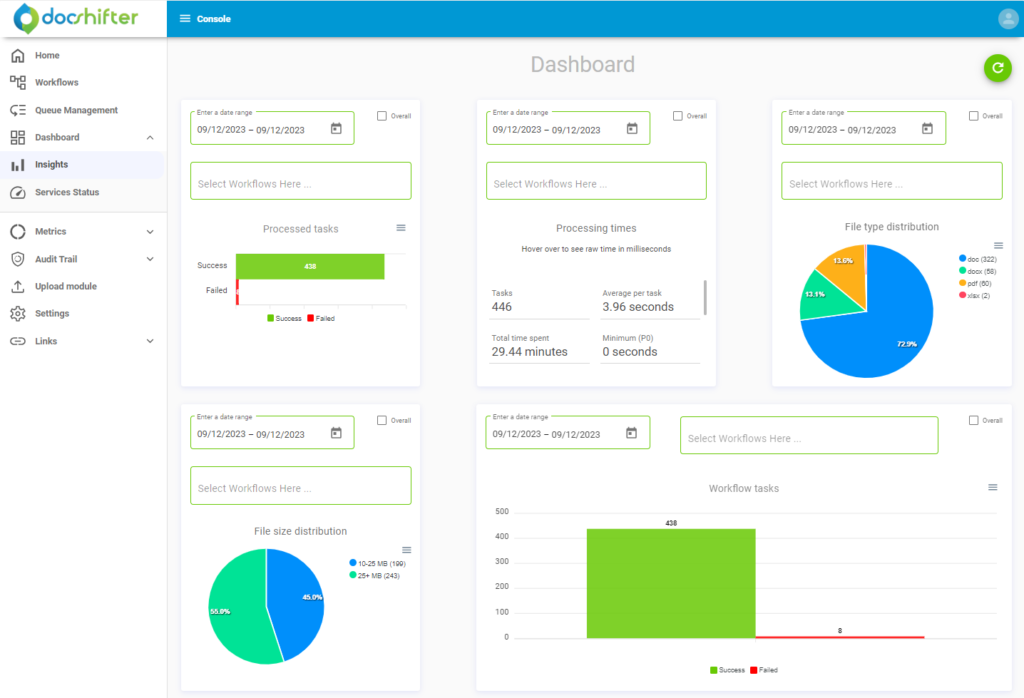
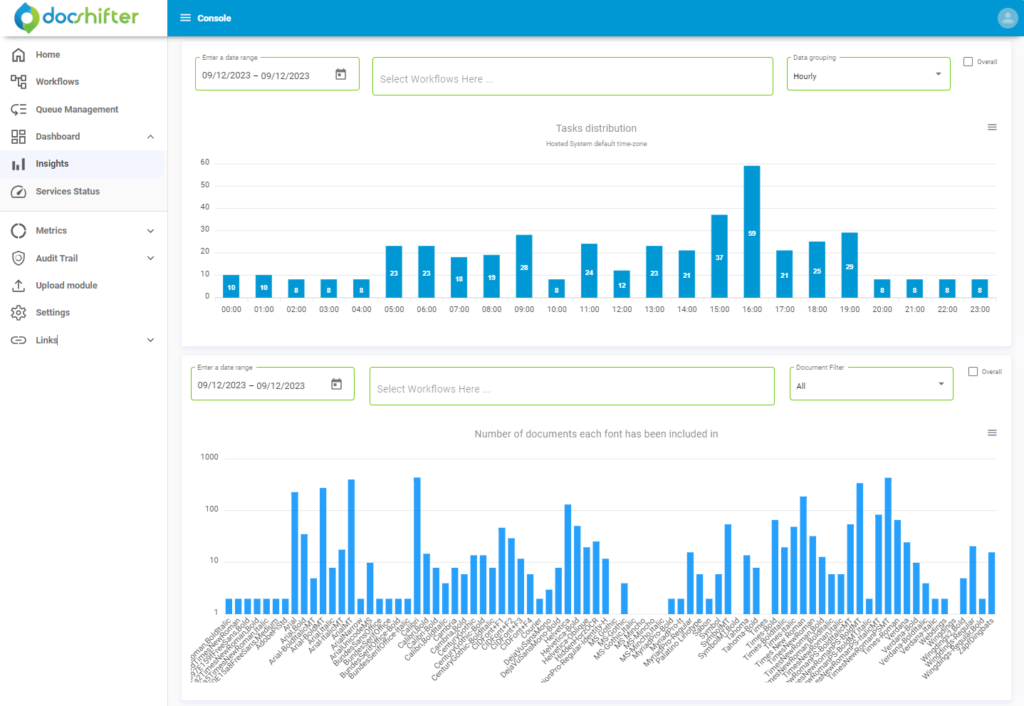
DocShifter introduced an “Insight” dashboard (somewhere in the last 2 years, version 7.1?), which can show some interesting data. This is an example of what you can get from it, on a DocShifter 8.0 environment:
That’s good and all, but in the end, if you want to see the real time it took from the end-user point of view, that’s not enough. One of the monitoring that is always implemented at our customers is to detect the long running rendition process. In this blog, I will do things manually since we want to see the global performance of all rendition requests and not just the slowest. So, let’s start with executing a DQL on a repository that has rendition enabled:
select
  datetostring(q.date_sent, 'yyyy/mm/dd hh:mi:ss') as sent_date,
  datetostring(q.dequeued_date, 'yyyy/mm/dd hh:mi:ss') as dequeued_date,
  86400*(q.dequeued_date - q.date_sent) as time_to_fetch,
  datetostring(c.set_time, 'yyyy/mm/dd hh:mi:ss') as rendition_date,
  86400*(c.set_time - q.dequeued_date) as rendition_duration,
  86400*(c.set_time - q.date_sent) as total_wait_for_rendition,
  q.item_id,
  d.r_full_content_size as doc_size,
  c.full_content_size as pdf_size,
  d.a_content_type as content_type,
  q.r_object_id as request_id
from
  dmi_queue_item q,
  dm_document(all) d,
  dmr_content c
where
  q.name = 'dm_autorender_win31'
  and q.supervisor_name = 'dm_autorender_win31'
  and q.item_id = d.r_object_id
  and any c.parent_id = d.r_object_id
  and c.rendition = 2
  and c.full_format = 'pdf'
  and q.date_sent >= date('2023/12/08 00:00:00', 'yyyy/mm/dd hh:mi:ss')
  and q.date_sent <= date('2023/12/08 23:59:59', 'yyyy/mm/dd hh:mi:ss')
  and q.dequeued_date > q.date_sent
  and c.set_time > q.dequeued_date
order by
  6, 7;
As part of this query, we select multiple dates/timestamps, which represents the time when the item was put in the rendition queue, when it was picked-up by the rendition server and finally when the process completed. As we need to check for performance, we need all three dates available, therefore renditions that are still in progress won’t appear here. It also includes details about the document itself like the mimetype, its native size, and its rendered size. As you can see in the “WHERE” clauses, we only select PDF renditions here, for the dmi_queue_item of “dm_autorender_win31” and for rendition requests that came on the 8-Dec-2023.
So how can you transform the raw data into a proper report that can be shared with the business? If you want to do it automatically, you can take a look here and here for some ideas. In this blog, I will create the report myself using something that everybody knows and uses: Microsoft Excel. Here is an example of steps to do that:
- Open dqMan and execute the query in it (you can also use idql or similar)
- Export the source data from dqMan into an Excel Sheet (Select all results > Right click > Export to > Excel)
- Select the full content in Excel
- Click on Data > Filter
- Click on Data > Remove Duplicates
- Click on Unselect All
- Select item_id
- Click on OK
- Click on OK
- Click on Insert > PivotTable
- Click on OK
- Drag&Drop time_to_fetch field to the ROWS list
- Drag&Drop time_to_fetch field to the VALUES list
- Drag&Drop time_to_fetch field to the VALUES list (a 2nd time)
- Select the 1st entry of the 1st column of the PivotTable
- Right click and select Group…
- Set the By to: XX (a value that makes sense, depending on min and max value)
- Select the 1st entry of the 2nd column of the PivotTable
- Right click and select Summarize Values By: Count
- Select the 1st entry of the 3rd column of the PivotTable
- Right click and select Summarize Values By: Count
- Right click and select Show Values As: % of Grand Total
- Select the full PivotTable
- Click on Insert > Pie Chart
- Select the Pie Chart
- Right click and select Add Data Labels > Add Data Labels
- Select the Pie Chart’s Data Labels
- Right click and select Format Data Labels…
- Select Percentage
- Unselect Value
- Go back to the 1st sheet in Excel and re-select all content
- Click on Insert > PivotTable
- Do the same as above but for total_wait_for_rendition instead of time_to_fetch and place the PivotTable just next/below the previous one
That’s a long list, but it’s really like 30 to 60s to apply them. In the above steps, we remove the duplicate “item_id” because that means that there were several rendition requests for a single document. However, there will only be one PDF rendition in the end: a first rendition request will attach the PDF rendition to the document and a second rendition request will normally replace the already existing PDF rendition with a new one. Therefore, the “creation time” of the rendition (dmr_content.set_time) will have the details of the second rendition and not the first anymore.
The result of such steps should be something like the following:
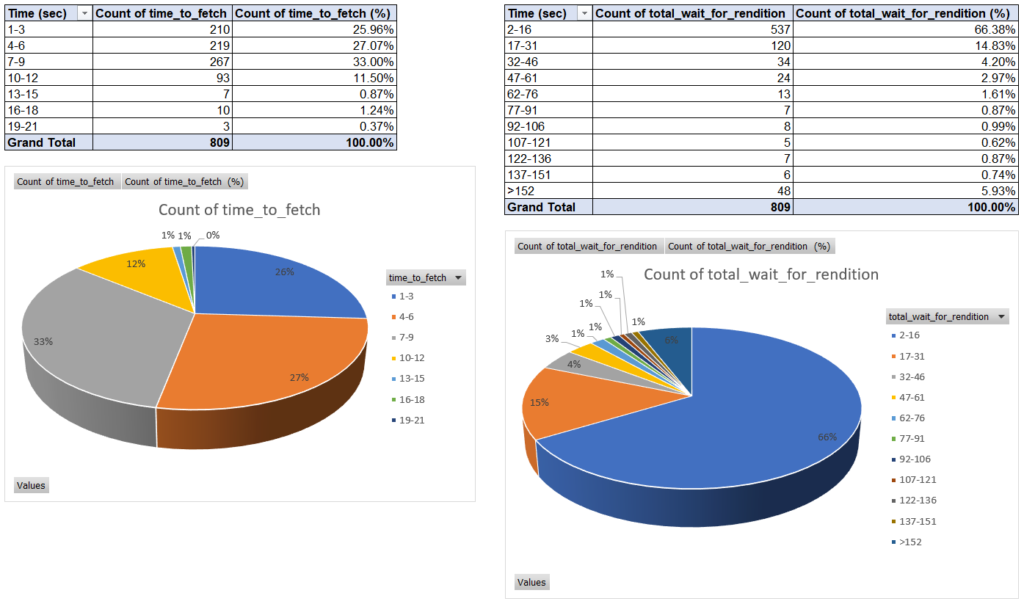
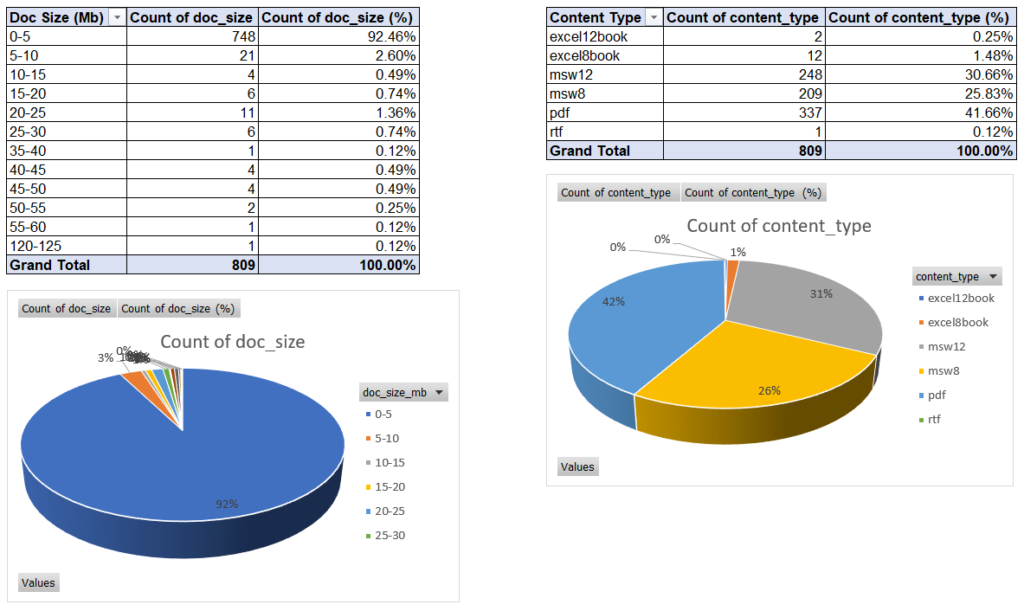
If needed, you can also add other Pie Charts for the size of the native content, the size of the rendition and the mimetype. You can also replace Pie Charts with Line or Bar Charts, depending on how you want to see things, maybe to correlate potentially long-running renditions at certain times of the day (huge number of renditions causing delay in processing? hardware limits?).
![Thumbnail [60x60]](https://www.dbi-services.com/blog/wp-content/uploads/2022/08/MOP_web-min-scaled.jpg)
![Thumbnail [90x90]](https://www.dbi-services.com/blog/wp-content/uploads/2022/08/GME_web-min-scaled.jpg)
![Thumbnail [90x90]](https://www.dbi-services.com/blog/wp-content/uploads/2022/08/ATR_web-min-scaled.jpg)