In my last dynatrace blog, I presented how to go from logs to dashboard. This could look like a complex process for such a simple task. Moreover, this does not work on historical data as metric will be only populated at the time of the definition even if it was present in the log before.
Recently, dynatrace introduced Grail.
Grail by dynatrace
Grail focuses on simple and efficient storage of logs (without metrics):
- no indexes means fast storage
- no schema means no administration required
- only DQL
Types of data a in different data bucket.
Dynatrace Query Language (DQL)
DQL is a powerful language to explore data stored in dynatrace. It could query any data bucket, but in this blog we will focus on logs. I will try to create same dashboard on WildFly access logs as on my previous blog without having to extract attribute and create metric.
First, we must go in “Observe and explore” and then “Logs” menu. Then, I switch to Advanced Mode:
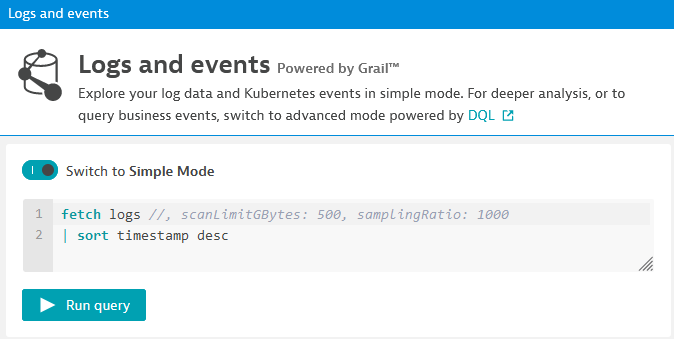
A typical DQL query starts with fetch and the bucket name, then it is piped (|) to DQL functions. Here it is a timestamp sorting. After clicking “Run query”, I will see this:
First, I want to limit my query to access log which contains TimeTaken information as server.log does not have it. This I am adding a filter line as follow:
fetch logs
| filter contains( log.source, "access")
| sort timestamp desc
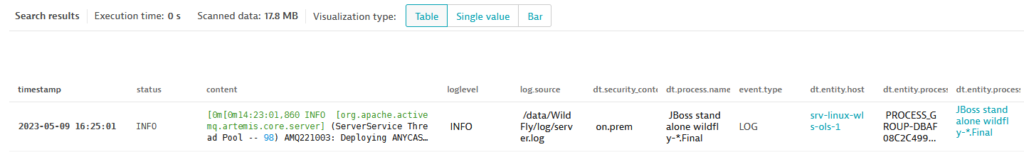
Next step is to parse content field and extract TimeTaken info. DQL query modified:
fetch logs
| filter contains( log.source, "access")
| parse content, "LD 'TimeTaken: ' DOUBLE:timetakenparsed"
| fields timestamp, status, content, timetakenparsed
| sort timestamp desc
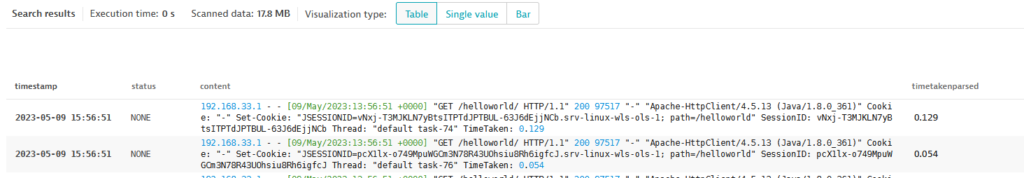
I have also added fields function to get only the fields I want to focus on. As you see, status is empty. We could extract it from content as well. Thus, we have to modify parse line:
| parse content, "LD DQS SPACE? INT:status LD ' TimeTaken: ' DOUBLE:timetakenparsed"
DQS is double-quoted string which is just before the status code in access log. Here I do not store it in any field, but it is possible. Now, you can see status field is there:
I don’t want to plot timetaken for each and every access log request. I want to group them by timestamp buckets. To achieve that, I will use summarize function:
| summarize timetaken_med=median(timetaken_parsed), by: { TS=bin(timestamp,1m) }
Create a new fieldtimetaken_medand populate it with result of a function (median)byis used to specify on what to group. It can have multiple fields and can include functions- TS is the name of the grouped field
binfunction aligns timestamps to the desired interval (1 minute in this example).
- sort line is changed: timestamp becomes TS
Using visualization type Bar, graphs is displayed:
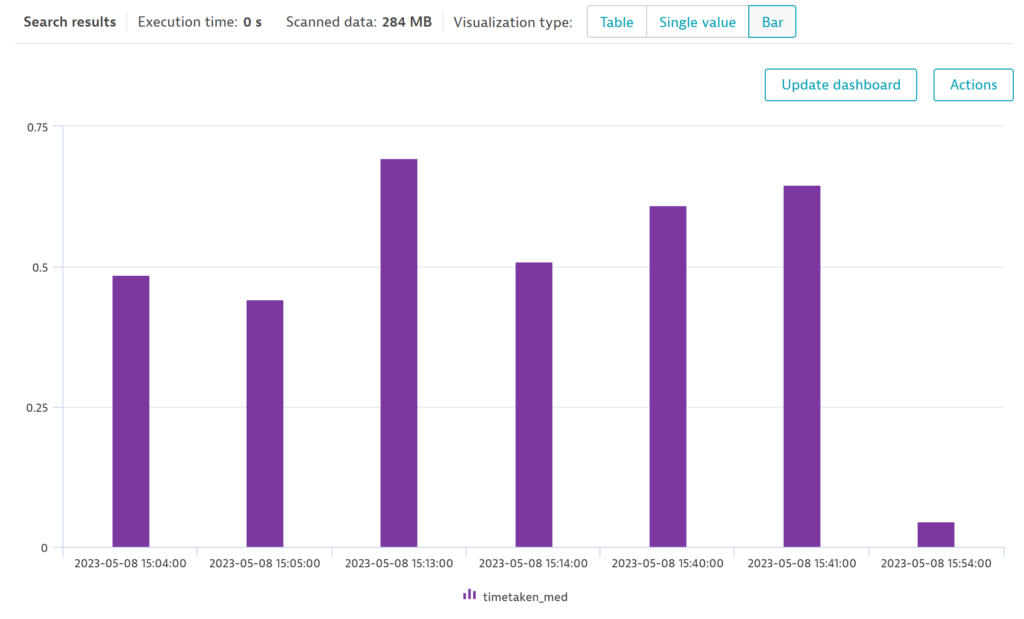
Then a click on Actions and Pin to dashboard:
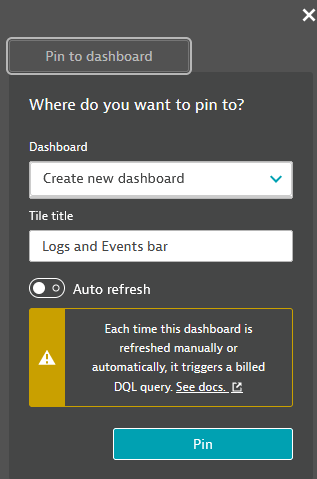
Et voilà !
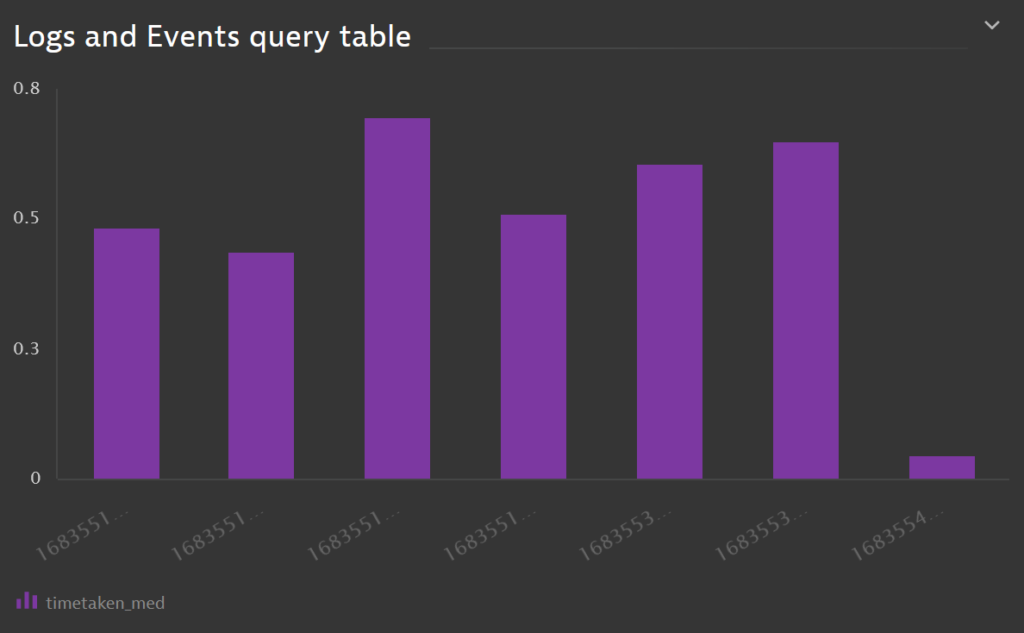
Conclusion
This is really nice and flexible way of creating dashboards. The main limitation is for alerting (at least as of today). You must create an attribute and metrics to be able to set thresholds and alerts.
![Thumbnail [90x90]](https://www.dbi-services.com/blog/wp-content/uploads/2022/09/DDI_web-min-scaled.jpg)