In my previous dynatrace blog, I explained how to deploy OneAgent on a Virtual Machine which hosts WildFly. In this one, I will tell you:
- How to enable log centralization
- Extract an attribute from log
- Convert it to metric
- Display it in a dashboard.
Before that, to be able to track time taken by each request in access log, we must enable “record-request-start-time” in WildFly. With jboss-cli.sh, command to achieve that is:
/subsystem=undertow/server=default-server/https-listener=https:write-attribute(name=record-request-start-time,value=true)
reload
Then, we are ready for next steps.
Enable Log Centralization
dynatrace OneAgent can centralize log. To do that, we need to declare a new log source. Go in Settings, Log Monitoring, Custom log source configuration:

I click “Add custom log source”:
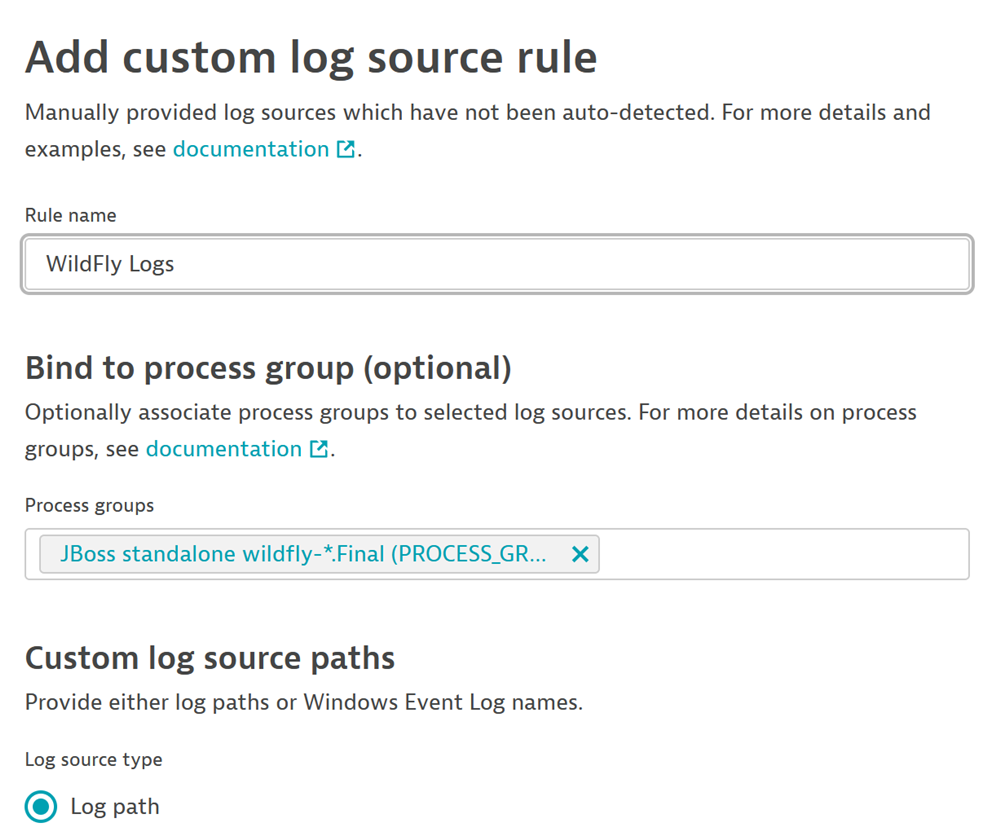
Set a name and a process group which will make filtering and searches easier. Then, we must add path to the log we want to monitor:
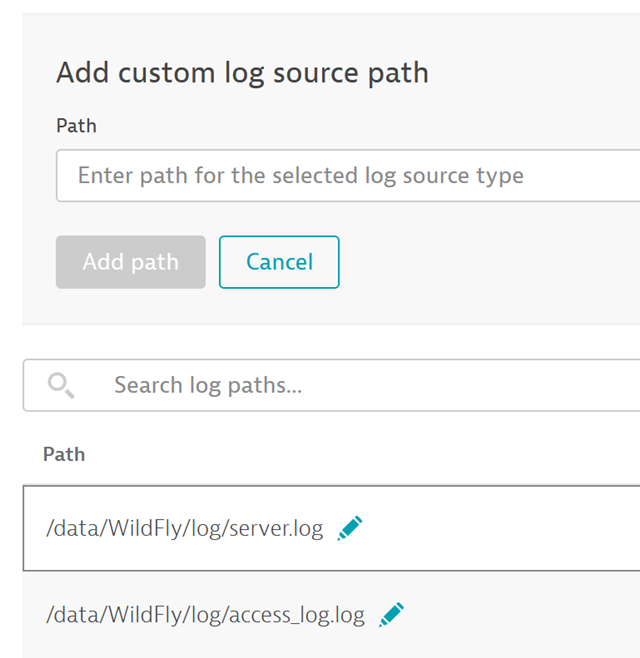
access_log is enough for this blog.
Next, enable this log source. Still under “Log Monitoring” settings, go in “Log sources and storage” and select “Process groups perspective” tab and tick “JBoss standalone wildfly-*.Final” process group:
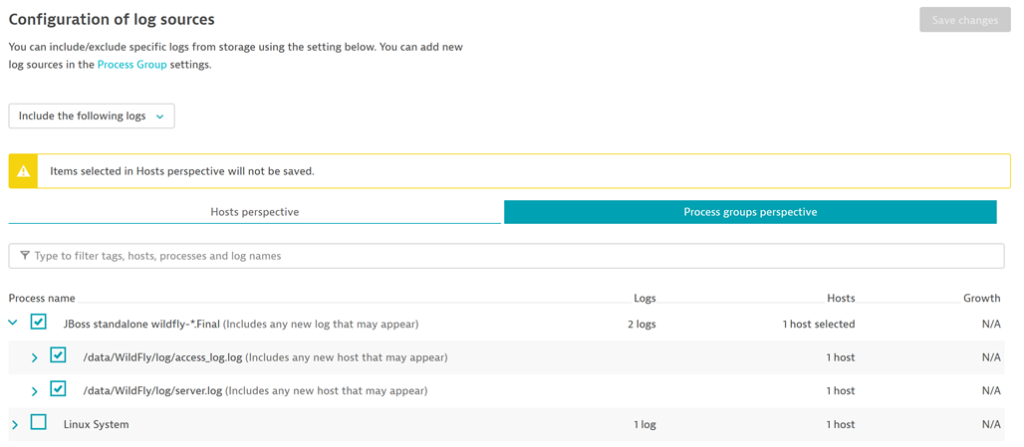
This will ensure that any new host having the same process group will have logs centralization enabled as well. Click “Save changes”.
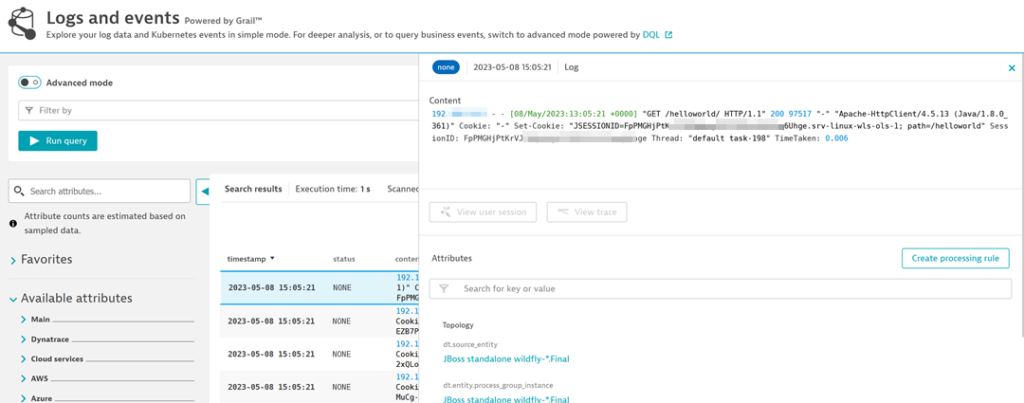
Now, once we generated some traffic to the web application, we can confirm that logs are gathered. Go in “Observe and explore” and Logs:
Extract Attribute
An access log line does look like that:
192.168.33.1 - - [08/May/2023:15:42:36 +0000] "GET /helloworld/ HTTP/1.1" 200 97517 "-" "Apache-HttpClient/4.5.13 (Java/1.8.0_361)" Cookie: "-" Set-Cookie: "JSESSIONID=SvK9ffmT******************************_qYylD.srv-linux-wls-ols-1; path=/helloworld" SessionID: SvK9ffmT******************************_qYylD Thread: "default task-333" TimeTaken: 0.822
Interesting part is at end of each line: TimeTaken: 0.822
For now, it is just part of “content” of log and I want to extract it so that it is queriable.
I will add a new processing ingest pipeline:
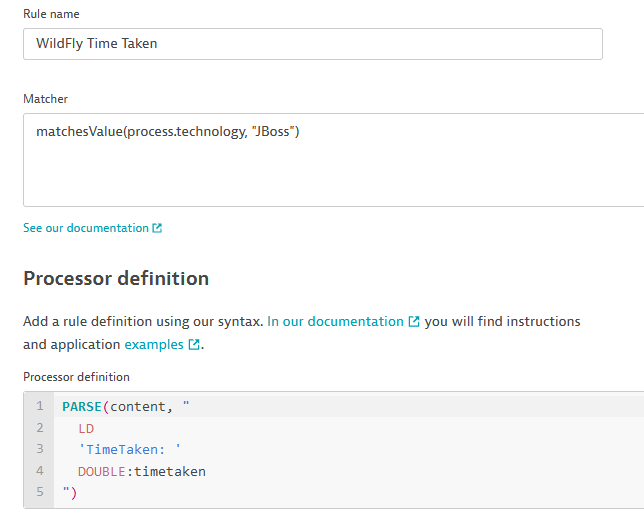
Matcher is a mandatory filter to which we want to apply the rule.
Processor definition defines how we want to manipulate data. Here is the meaning of each line:
- PARSE is a DQL (Dynatrace Query Language) function. content is the log line
- LD matches any characters
- ‘TimeTake: ‘ is an exact matched string
- DOUBLE matches a float number. Match will be stored in
timetakenvariable
While creating a new rule, it is possible to test it against a log. This is extremely convenient, especially if you are doing it from Logs menu as it is pre-populated:
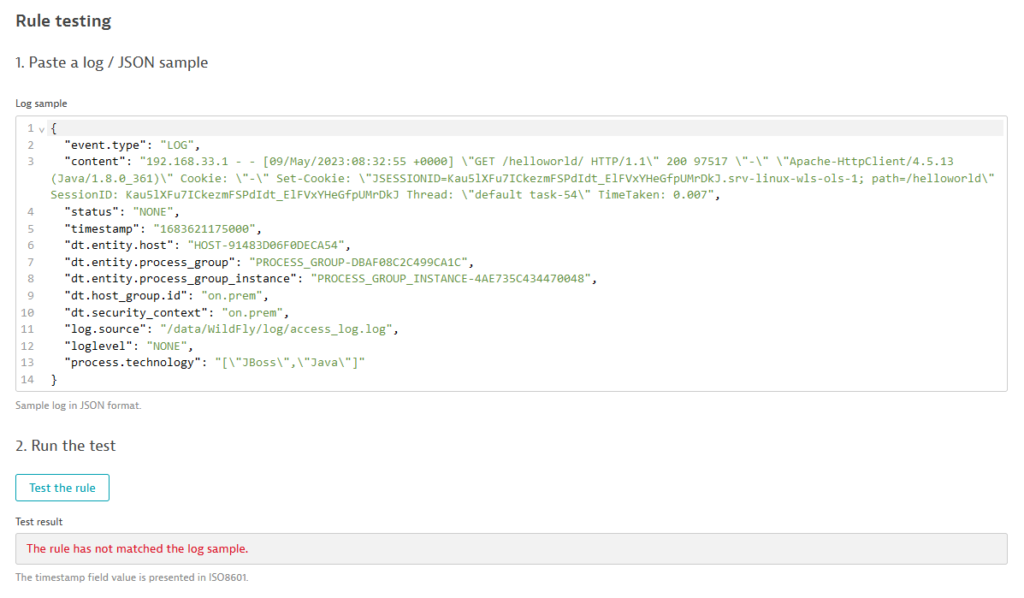
Despite the error displayed during testing, which could happen as per dynatrace support, the rule is ok. I click save and generate new load to the web application as this will be applied once new logs are stored. I could use another Matcher, but this is the more generic one I found.
Convert to Metric
Now, I want to store that attribute as a metric to be able to plot it in graphs. In Metrics extraction section of Log Monitoring Settings, I click “Add log metric”:
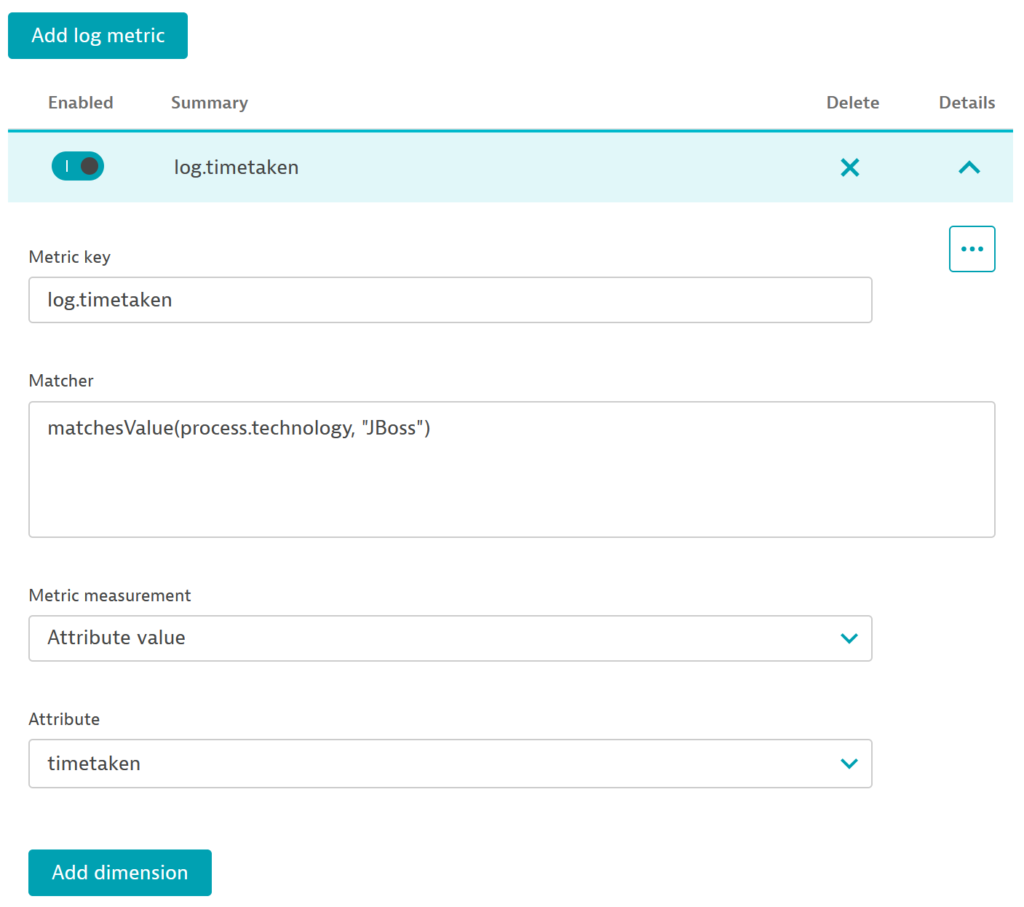
Metric key is automaticaly prepened by log.. I use same matcher as log extraction matcher. For metric measurement, I change it to “Attribute value” instead of “Occurence of logs records” which is a simple line count. Finally, I select the source attribute timetaken as defined in Processor definition in previous chapter. I will not add any dimension as I have only one server and only one application (helloworld).
Dashboard
Creating a graph is the easy part. Go in “Data explorer” menu and search for the metric:

Click on finding and “Run Query”. Finally, a click on “Pin to dashboard” to add it. After more customization, here is how it could look like:
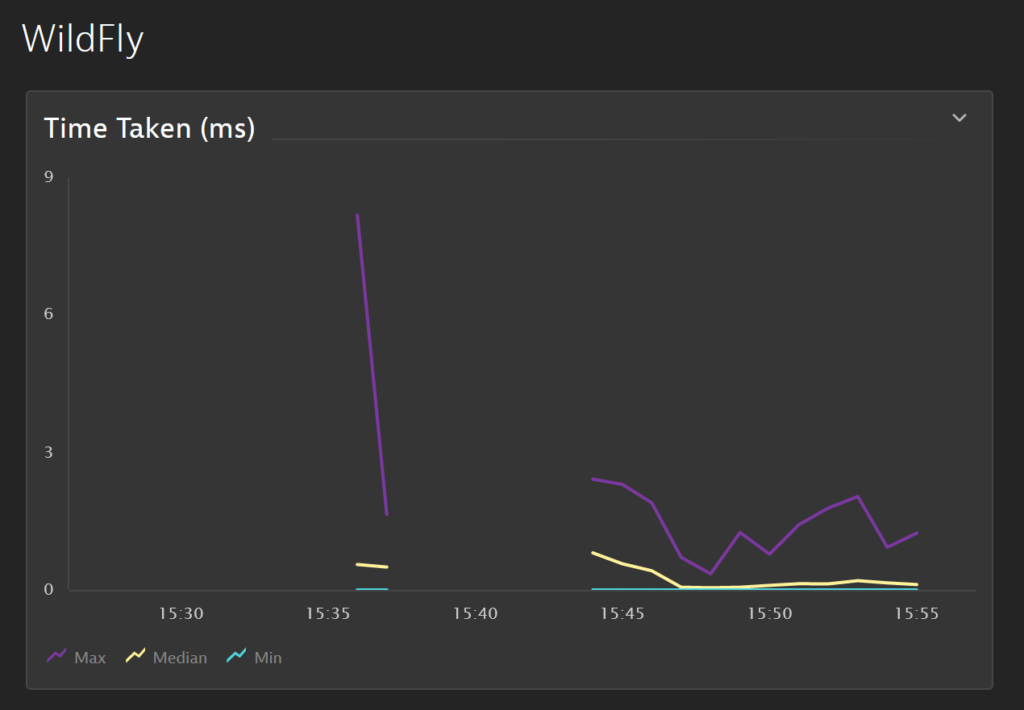
Here I plotted three times the same metric but by applying different function on it:
- Maximum
- Minimum
- Median
![Thumbnail [90x90]](https://www.dbi-services.com/blog/wp-content/uploads/2022/09/DDI_web-min-scaled.jpg)