In the first post of this series, I introduced the Business Dashboard module I built, over the past few weeks, for M-Files. This second post is for the end user: what does it actually look like, where is it, and what can you do with it once your administrator has configured one or more dashboards for you. No JSON in this post, no admin screens, no code. Just your experience as end-users. Please note that in the rest of this blog, when I say “administrator”, I mean the person that will design your dashboards. It might be a Super User or a System Admin, but he needs access to the M-Files Admin UI.
If you have followed my posts for some time, you know I prefer to walk you through a feature (or an issue) exactly as you would discover it. So, let’s do the same here.
1. Where to find the dashboard pane
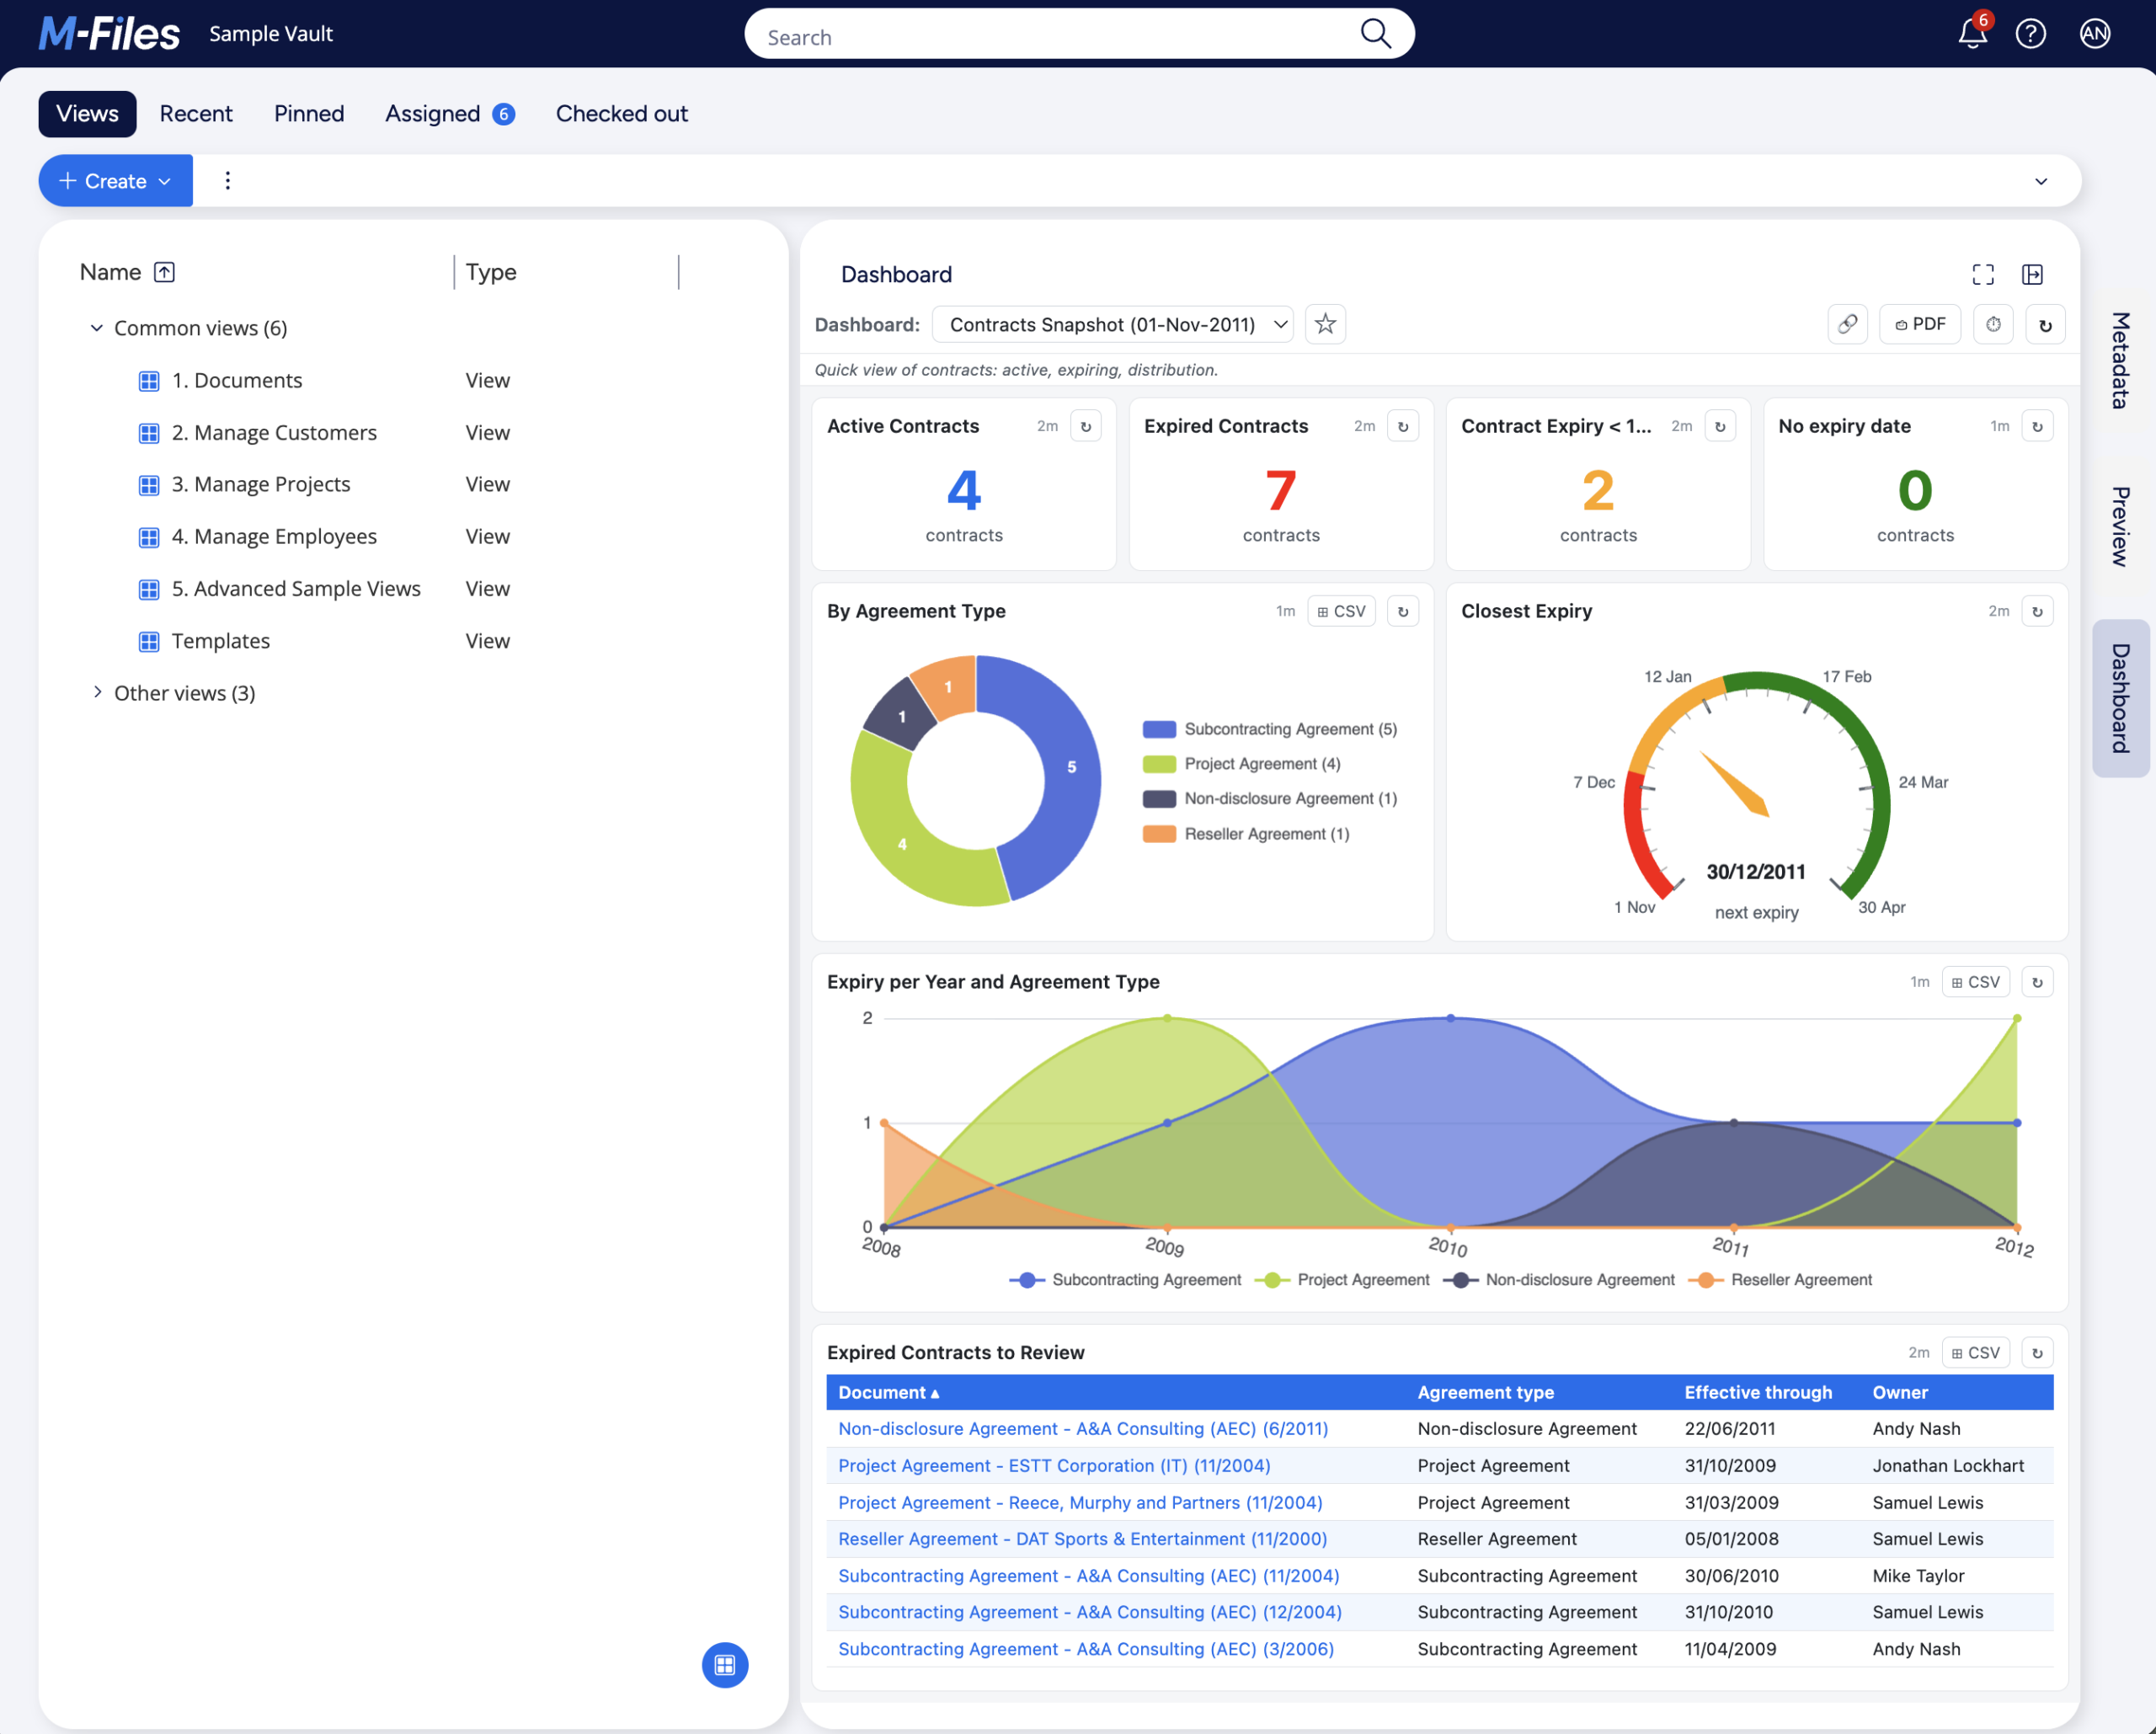
The Business Dashboard adds a third tab to the right-hand pane of M-Files, next to the standard Metadata and Preview tabs. It is simply labelled Dashboard. Both M-Files Web (in a browser) and M-Files Desktop (the Windows client) show it – same panel, same behavior, with one platform-specific detail I will flag along the way.
As a reminder, this is what it looks like and how to access it:
If you do not see the Dashboard tab, two things are possible: either the module is not installed in your vault, or it is installed but your vault is configured to use the old UI. In both cases, the next step is to ask your administrator.
A small note on the pane width: the right pane is resizable by dragging its left edge. The dashboard AND the widgets inside respond to that resize. Therefore, on very narrow widths, widgets like donuts will have their legends move from the side to the bottom, to give more space to the charts. Don’t hesitate to play with the resize, it can be a good stress-reliever ;).
2. Selecting and switching between dashboards
At the top of the pane, you have a “Dashboard:” dropdown. It lists every dashboard your administrator has decided you can see, in the order the administrator chose. There might be more of them, but in this case, you don’t have permissions to see them. Click the dropdown, pick a dashboard, the panel updates immediately.
The last dashboard you selected is remembered for the next time you open the pane, so if you mostly use one dashboard (e.g. the Contracts one), you do not need to re-select it every morning. Even better than that, you can set multiple favorites and in this case they appear at the top of the list. More on that “last seen” vs “favorite” vs “link” below, in following sections.
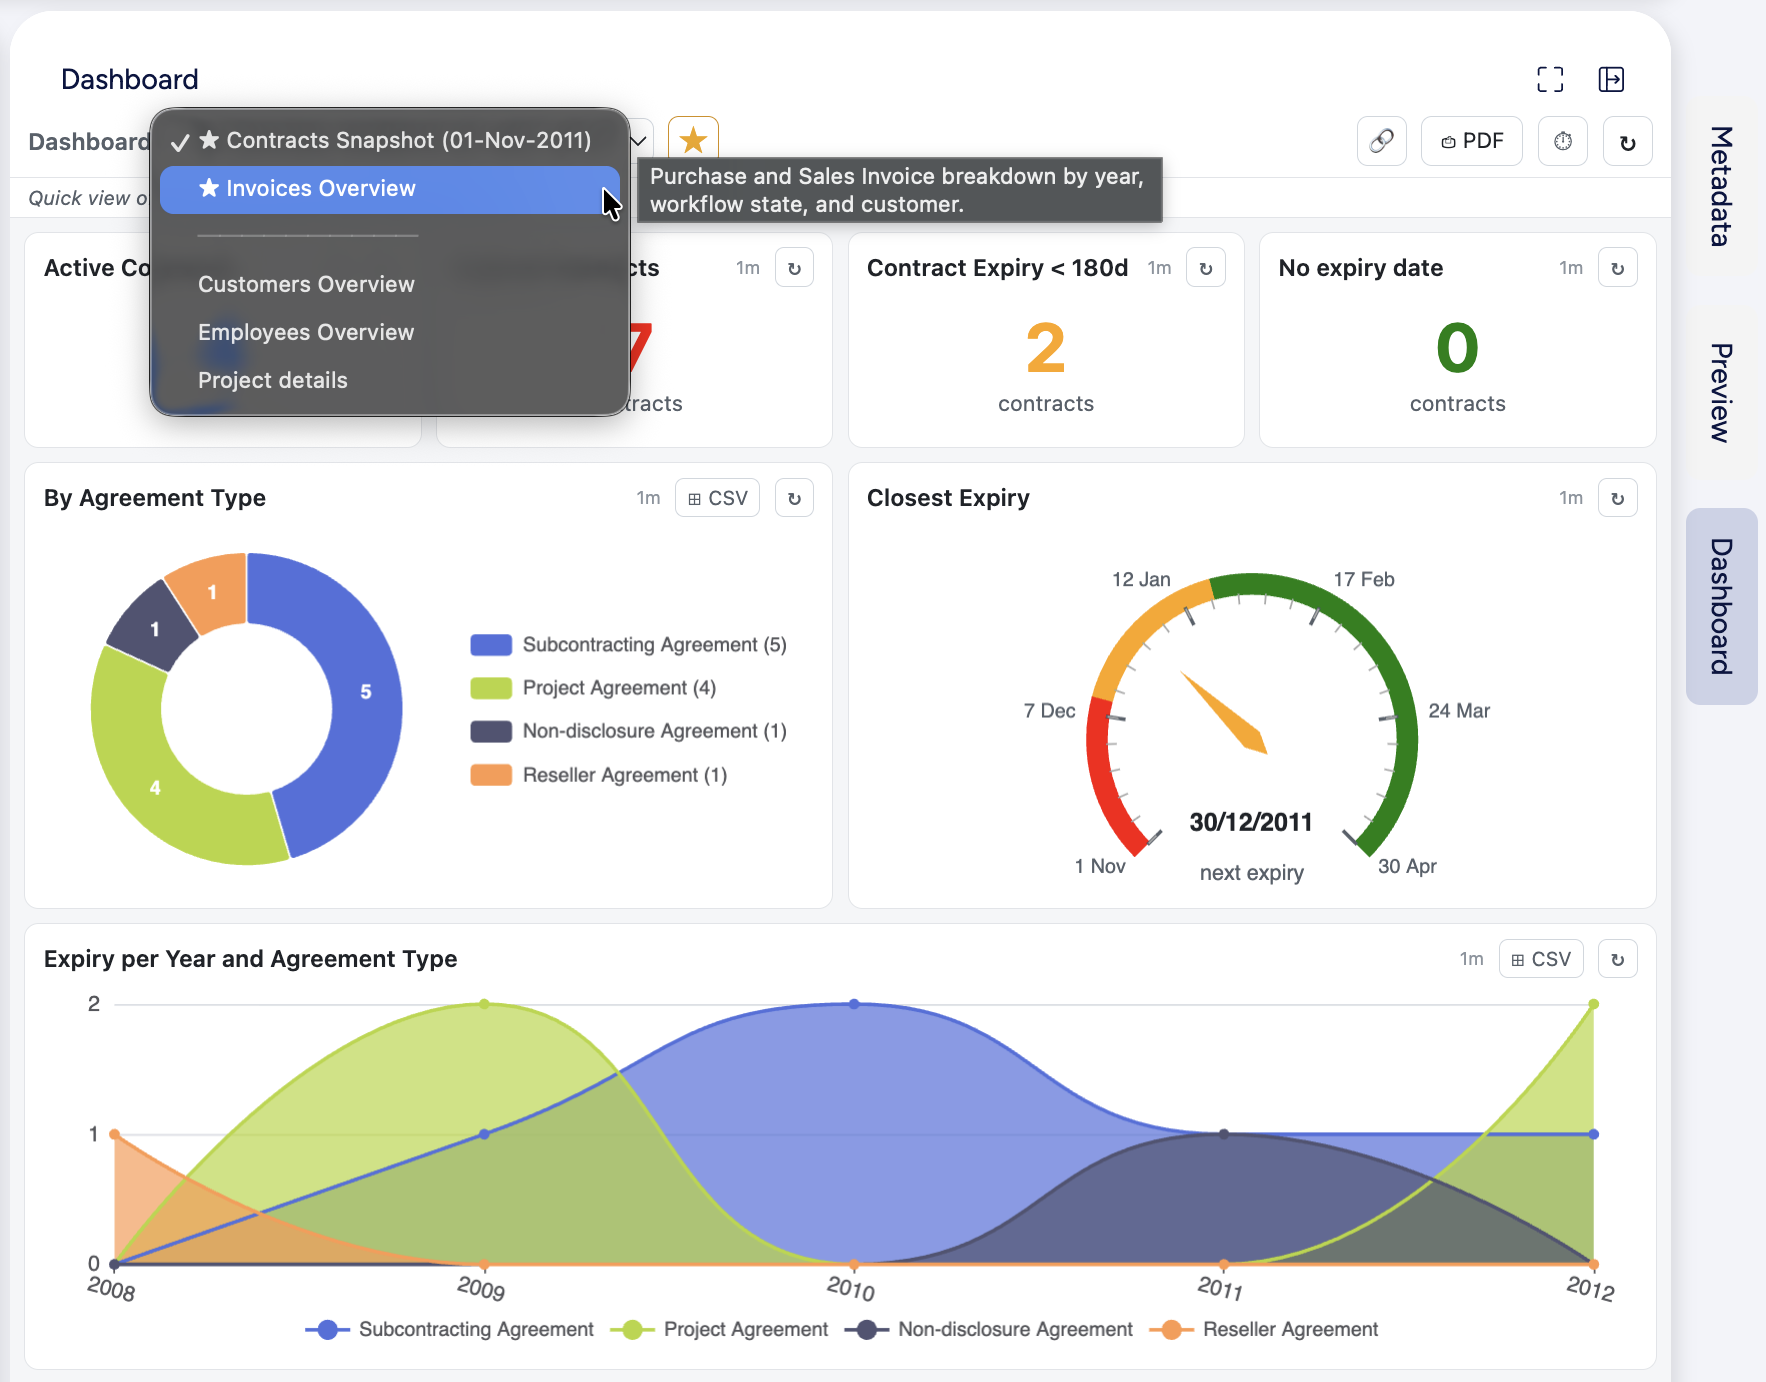
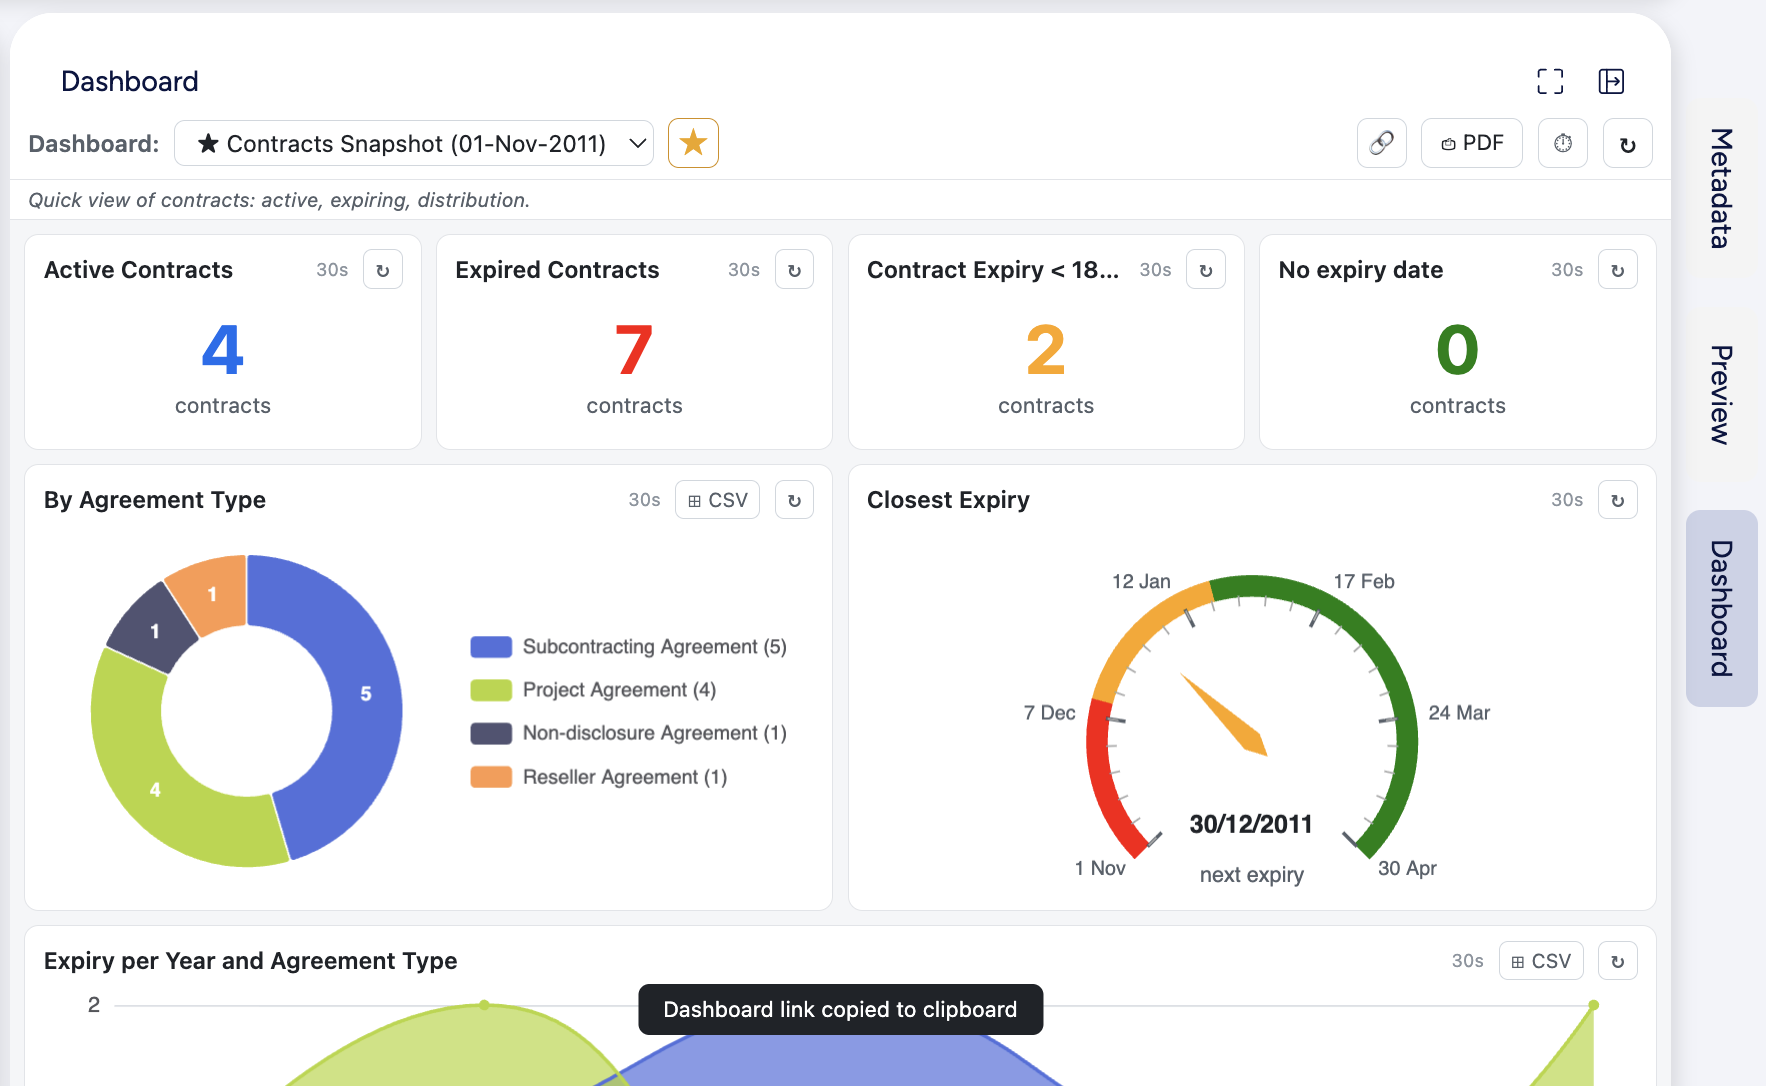
Under the dropdown, if your administrator added a description to the dashboard, you will see a thin italic strip that contains it. It is clamped to two lines maximum. If the description is longer, hover the strip to see the full text in a tooltip. In addition to that, when the dashboard dropdown is opened, you will also be able to see the description of the dashboard you hover over, which will have a darker background.
In this screenshot, you can see the selected dashboard is about Contracts and its description is Quick view of contracts: active, …, while the description of the Invoices Overview dashboard is Purchase and Sales Invoice breakdown by year, workflow state, and customer.. Therefore, before loading it, you can get a quick idea on what exactly it will contain:
3. The widget grid
Each dashboard is a grid of widgets. As said, the grid is responsive and it contains 12 columns, so each widget can use from 1/12th and up to 100% of the width. Your administrator decides which widgets appear, in what order, at what size.
As of now, there are seven widget types supported:
| Widget | What it shows |
|---|---|
| KPI Number | A single value, typically a count, a sum (e.g. “Active contracts: 142”, “Invoices: 1’520’430 CHF”) or other mathematical operators like min/max/average/median. But it can only display a date (with min/max). |
| Gauge | A dial with a value against a defined range. Some gauges are numeric (e.g. overdue invoices against a target of 0-50). Some are in date mode, showing a date value as a day offset from today (“days until earliest contract expiry”). |
| Donut chart | A distribution across categories or time periods (e.g. contracts by agreement type). Slice values appear inline. The legend is shown next to the donut when the pane is wide enough, otherwise below. Also supports multi-series by displaying multiple sub-donuts. |
| Bar chart | A distribution across categories or time periods, displayed either vertically or horizontally. Also supports multi-series, with stacked or grouped bars. |
| Line chart | A distribution across categories or time periods, with data points linked to each other. Also supports multi-series, with multiple lines. |
| Area chart | Same data as a line, with the area below the line filled, to emphasise volume. |
| Table | A sortable list of objects or groups of objects, with pagination and additional columns that can be added. |
Each widget has a title at the top, sometimes a short italic subtitle (the widget description, when your administrator added one), and three small elements in the top-right corner of the widget header that I will detail in the next sections.
4. Refreshing the data
Data on the dashboard is fetched live from M-Files. There are three ways the dashboard can be refreshed:
- Auto-refresh. If your administrator enabled auto-refresh, the panel re-queries all widgets at a configured interval (e.g. every five minutes). There is a small clock icon ⏱ on the top-right corner of the Business Dashboard, which represent the Auto-refresh feature. When it’s off, the icon is grey, while it becomes green upon activation. Depending on configuration, you might be able (or not) to toggle the Auto-refresh.
- Global manual refresh. A small ↻ button in the top bar refreshes every widget at once. To avoid accidental hammering, the button enters a 15 second cooldown after a click. The per-widget refresh buttons are also locked during this cooldown.
- Per-widget refresh. Each widget has its own ↻ button in its top-right corner. Click it to refresh that widget alone. A 15 second cooldown applies to the clicked widget only.
Each widget header also shows a faint “Xs” or “Xm” or “Xh” text indicating when the data was last successfully loaded (in seconds, minutes or hours). Hover it to see the exact timestamp in a tooltip: “Last refreshed: hh:mm:ss“. This is useful to spot, at a glance, if all widgets were successfully refreshed or if there is one that is fresher than another (typically because you refreshed it manually).
5. Drill-through: exploring the objects behind the numbers
This is one of the features that makes the difference between an “interesting dashboard” and an “actually useful solution”. If your administrator enabled drill-through on the dashboard, all widgets automatically become clickable, and clicking them opens a detail modal listing the underlying M-Files objects.
What is clickable:
| Element | What it shows |
|---|---|
| KPI tile | All the objects matching that widget’s query. |
| Gauge face | All the objects matching the widget’s query before applying the reducer (e.g. the minimum date is displayed, but all objects are shown in the drill-through). |
| Donut slice | Objects in that specific category or time period. |
| Bar column | Same as donut. |
| Line point | Same as donut. |
| Area point | Same as donut. |
| Row in a list table | No modal; clicking an object name navigates directly to it |
| Row in other tables | Same as donut. |
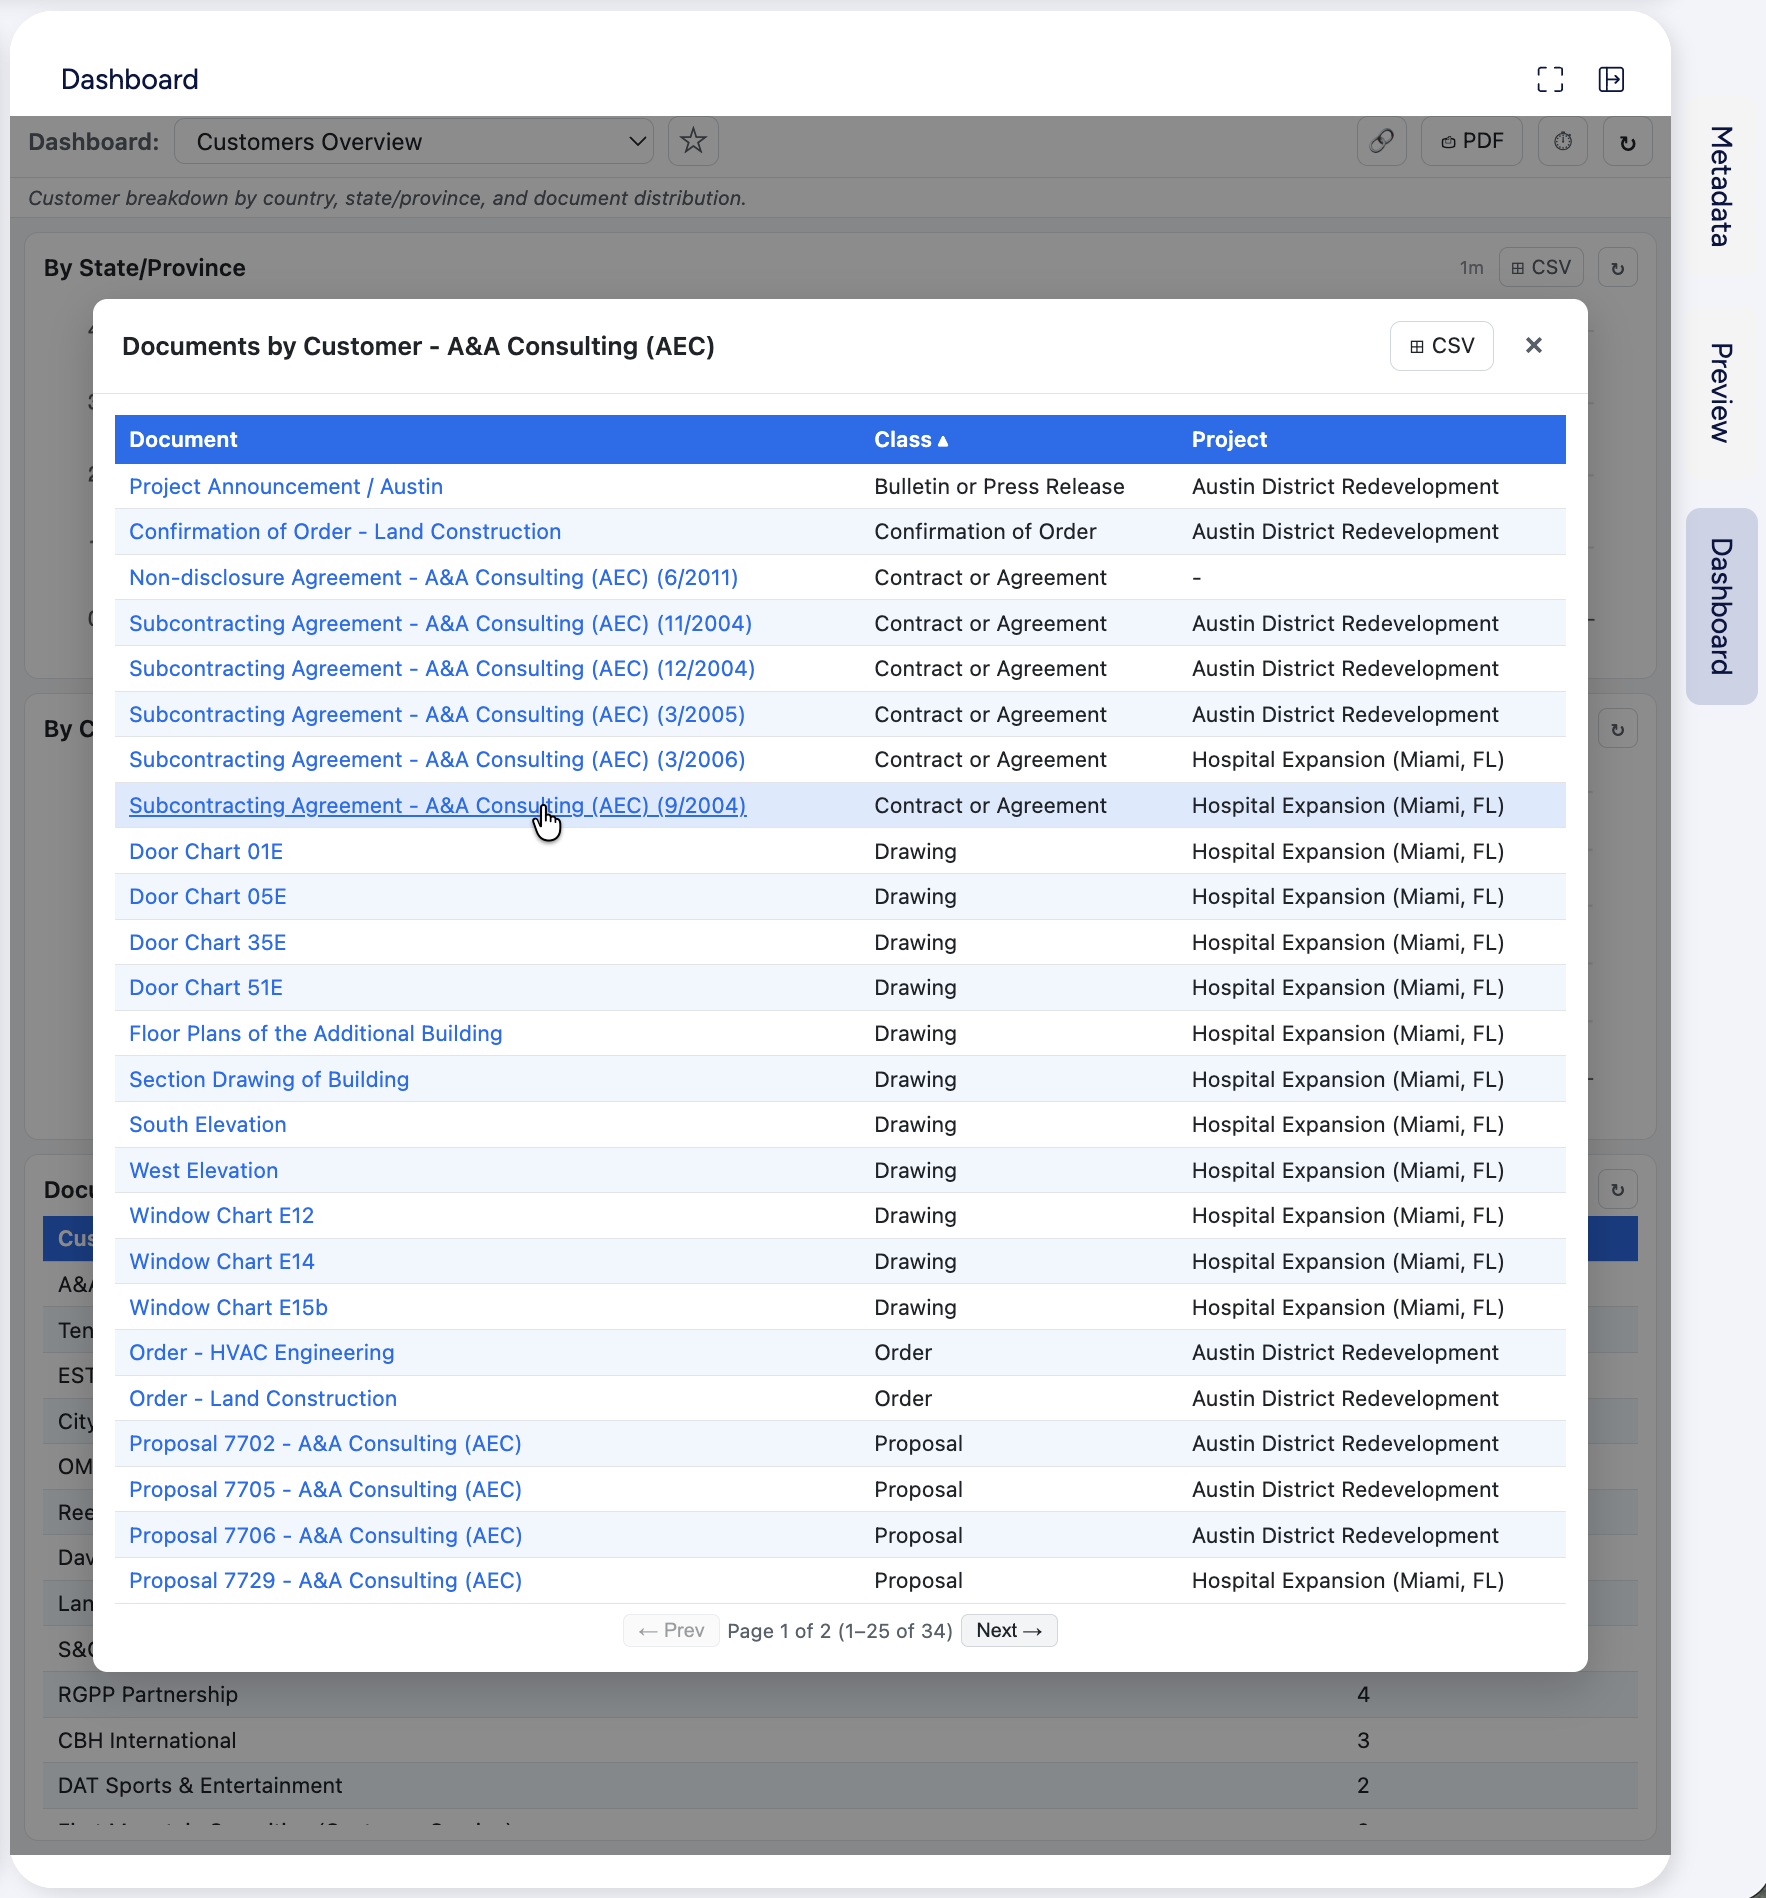
The modal that opens shows a table with one column for the object name (as a clickable link – c.f. navigation section below), plus any additional columns your administrator configured. Columns are sortable: click a column header to sort ascending, click again for descending. Sorting applies across all fetched rows, not just the visible page. So if you sort an “Amount” column descending, you see the top 15 (that’s the default page size, but it is configurable, c.f. below with an example of 25) of all the rows that were retrieved, not just the page you happened to be on.
Note: Sometimes the bar shows a small warning like "(⚠ 500 object(s) fetched)". This tells you the server retrieved up to its scan cap and there may be more objects in the vault that did not make it into the modal. Hover the ⚠ icon for an explanation. If you regularly hit that cap on a widget that should show everything, your administrator can raise (or disable) the cap on the dashboard configuration.
Why drill-through can potentially show more objects than the widget counts
This deserves its own paragraph because it might be a bit counter-intuitive at first. The widget aggregation runs inside a capped scan (set by your administrator), while drill-through runs a focused search with the slice or row category as an additional filter. If the focused search can fit all matching objects under its own cap, you may see more objects in the modal than the widget counted.
The Partial results badge on the widget header (when present) is the warning that the widget aggregate may be incomplete. There are basically two different limits. A first global limit, that ensures we do not request too much from the server and a second one linked to the drill-through that applies on filtered results.
Example: A dashboard has been configured by your admin with 10’000 for the first limit and 5’000 for the second. Let’s take a Documents by Class donut widget (i.e. you want to see ALL documents – without any filters). If your vault has more than 10’000 objects of type Documents, then the widget would display 10’000 with a Partial results badge. In these first then thousand results, there might have been 150 Contract or Agreement (Class) shown in the donut. If you click on the donut slice for Contract or Agreement, the associated modal will open and it will show at least 150 and up to 5’000 results. In the end, if the initial search is “too wide”, you might hit a limit. But the drill-through will include another filter (here “Class=Contract or Agreement”), which only return these specific objects.
Again, this is for performance reasons and as a kind of server-protection. If you have a real need, these limits can be increased or disabled completely by the admin – it is simply like that by default.
6. Navigating to an object
In drill-through modals and in list-type table widgets, object names are blue underlined links. Clicking a link opens that object on the left-side of M-Files.
A small detail that is sometimes useful: the drill-through modal stays open after you click a link, so you can navigate to several objects one after the other without losing your place in the list. Close the modal manually when you are done (using the × button, the Escape key, or clicking outside the modal).
7. Exporting to PDF
If your administrator enabled PDF export, a ⎙ PDF button appears in the top bar of the dashboard. Clicking it generates a snapshot of the current dashboard state (charts as images, KPI numbers, tables) and opens a print dialog automatically (both on Web and Desktop). From there:
- Select “Save as PDF” (or “Microsoft Print to PDF”) as the printer and click Save.
- Or pick a physical printer to print a hard copy.
The top bar, the refresh buttons and any open modals are excluded from the snapshot, so the PDF stays clean.
Note 1: if your client blocks the automatic print dialog (a rare but possible restriction), an HTML file is downloaded instead. You can open that file in any browser and press Ctrl+P to print it in the exact same way.
Note 2: the PDF export will respect exactly what M-Files is currently showing. This allows you to export the dashboard with a specific configuration. For example a table sorted in a different way that the default one, or some legends unselected from a donut, so that it ignores these details and re-render the donut with the remaining categories or time periods, etc. Whatever M-Files is showing will be what is present in the PDF export.
A PDF export of a dashboard will look like that:
8. Exporting to CSV
Similarly to the PDF export, your administrator can also enable CSV export. When it is on, a ⊞ CSV button appears in the header of every table, bar, donut, line, and area widget, as well as in the header of the drill-through modal for all widgets.
Clicking ⊞ CSV downloads a .csv file immediately. There is no extra server call; the export uses the data already in memory, so it is fast.
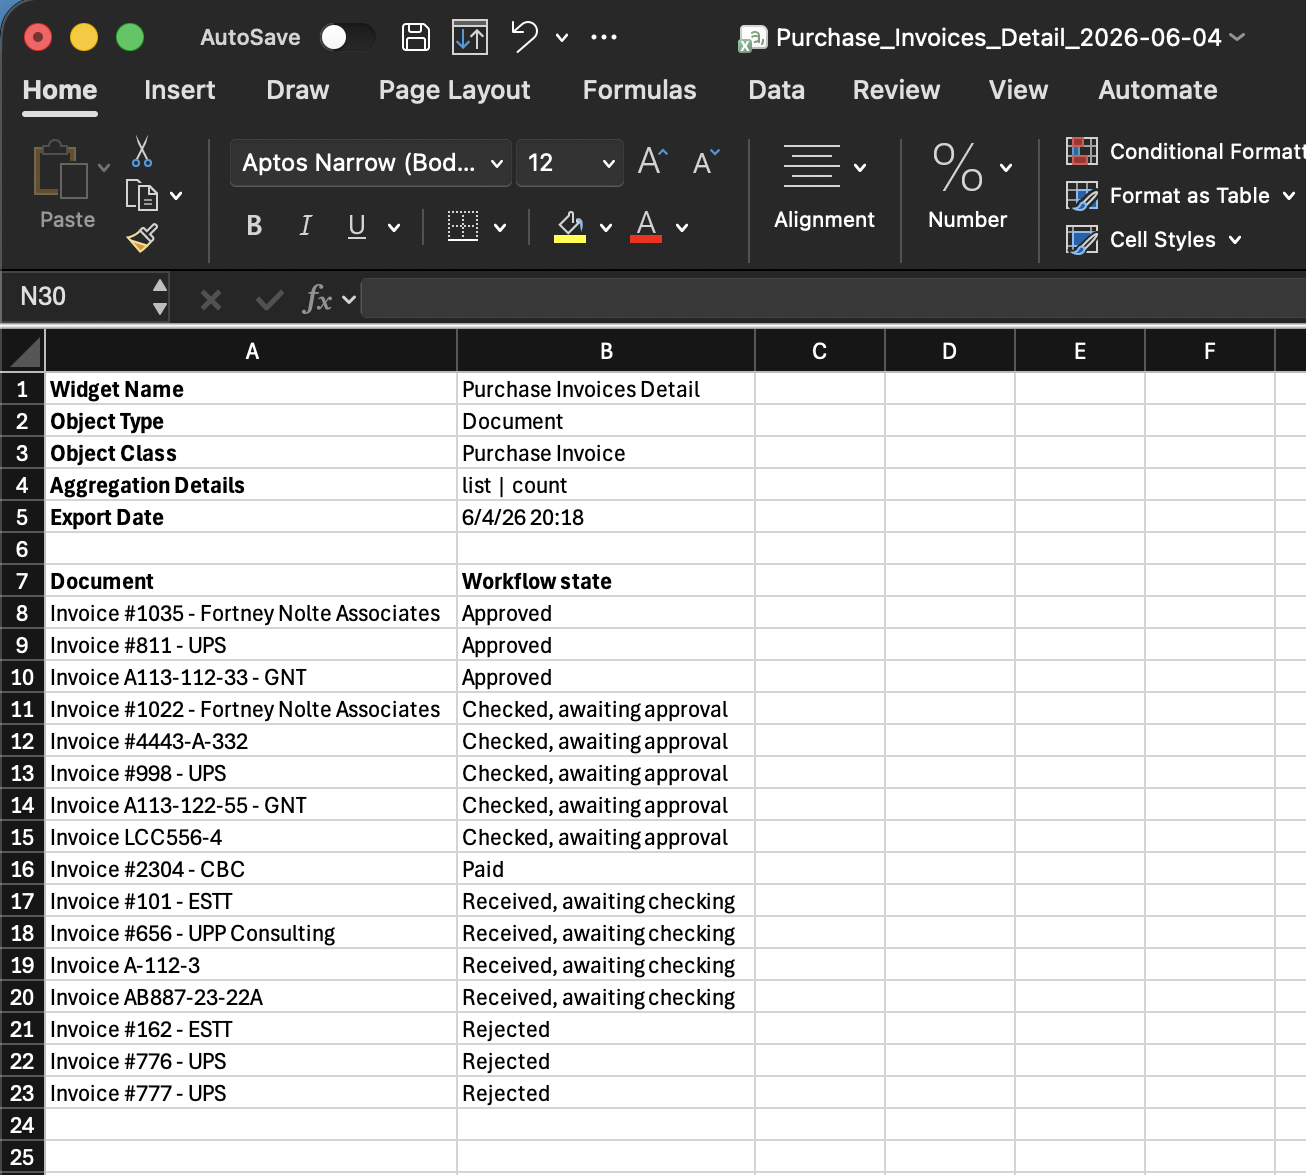
The file starts with a small metadata block describing what the data represents / how it was fetched:
Widget Name,Active Contracts
Object Type,Document
Object Class,Contract or Agreement
Filter #1,Effective through greaterOrEqual @today
Aggregation Details,summary | count
Export Date,2026-06-04 19:30:08
There might be two additional lines if the export is done on a specific group (a part of the initial results (e.g. after opening a donut’s slice modal details)) and if the widget is configured with multi-series. One line will describe which group is exported (category or time period) and another will describe the second dimension (the series).
The above metadata section is followed by a blank separator row (empty line), then the actual data rows (column headers and associated values). All rows currently held in the browser are exported, not just the page you are looking at. For example, if the table shows page 2 only (objects 16-30) but 120 results were fetched, then all 120 rows will be in the CSV.
The CSV file exported can then be opened in your preferred editor (Microsoft Excel, Euro-Office, LibreOffice, etc…). In the below image, I simply added the headers in Bold, but otherwise it’s the default outcome.
Note: similarly to the PDF export, the CSV will also respect table sorting, so that the rows exported will be in the exact same order as the one that you see on your screen.
9. Multiple favorite dashboards
If you use some dashboards far more often than the others, you can pin them as your favorites. There is a small star button (☆) in the top bar:
- Select the dashboard you want to pin.
- Click the ☆ button. It turns gold (★).
- From now on, when you open the Dashboard pane, the first dashboard you set as favorite will load first (instead of the last you viewed), and you can access your favorites at the top of the dashboard dropdown.
To unpin, click the ★ again. The favorites are stored under your account, so it follows you across clients and devices. Do it once and you can then enjoy forever.
10. Sharing a dashboard link
Right next to the favorite button, a small link button (🔗) can be used to share a link to a specific dashboard with someone else. In both M-Files Web and M-Files Desktop, the clipboard will be updated to contain a link to the current dashboard. For that purpose, the administrator will have to set the public facing URL of M-Files in the M-Files Admin configuration.
If this public URL isn’t defined, then it will still work on M-Files Web, by automatically fetching the current URL and appending it with the reference to the current dashboard ID. However, on M-Files Desktop, the URL is actually a local one, which nobody else will be able to use and therefore, the fallback is to copy the dashboard Name instead.
11. Indicators worth knowing
A few small visual indicators are worth recognizing:
- ⚠ Partial results (orange badge in the widget header). The server scan cap was reached; the widget may not reflect the full data. Section 5 above has the full explanation.
- Grey placeholder text inside a widget. The dashboard definition has a small mis-configuration. The administrator was normally warned about it when he designed the dashboard but he probably ignored it.
- Red error overlay that replaces a widget. The server returned an unexpected error. The dashboard definition has a configuration problem. The dashboard designer part (admin) doesn’t allow to Save/Publish dashboards with such errors, but someone might have bypassed the administrative tool and updated the database directly.
- Spinning overlay. The widget is loading. If it stays in that state for a long time, the vault may be under load. Use the per-widget refresh button to retry once the spinner disappears. I haven’t seen the spinner stays more than 2 seconds myself, but I guess it could happen.
- Numbers higher than what you see in your views. Dashboard widgets can use either user-level permissions (default) or server-level permissions, depending on the configuration done by the administrator. Some use-cases might require to give access to all M-Files users to some KPIs for example. In this case, a dashboard could use server-level permissions, so that the KPIs are accurate and the same for everybody, even people with no access to the underlying objects. The navigation (links) to the objects will always respect your actual user-level permissions, obviously. So the only thing that the dashboard can give you access to, if configured in that way by the administrator, is KPIs or some charts (possibly even without the drill-through – so you don’t have any details about the objects themselves).
12. What comes next
What I believe is genuinely useful about this module, is that it removes the small friction of “I just want to know quickly”. Opening a Power BI report takes a context switch; opening a saved view, scrolling and counting takes time. The Business Dashboard sits one click away in the M-Files window the user is already in, and it shows the answer he is looking for with nice visuals.
In the next post of this series, I will move to the other side of the panel: how an administrator configures a dashboard. I will start with the anatomy of a dashboard definition – the JSON structure that drives everything you just saw.
Want to know more about this Business Dashboard? Contact us and we will be happy to showcase it on M-Files.
![Thumbnail [60x60]](https://www.dbi-services.com/blog/wp-content/uploads/2022/08/MOP_web-min-scaled.jpg)
![Thumbnail [90x90]](https://www.dbi-services.com/blog/wp-content/uploads/2022/08/GME_web-min-scaled.jpg)
![Thumbnail [90x90]](https://www.dbi-services.com/blog/wp-content/uploads/2022/08/ATR_web-min-scaled.jpg)