Until now, in my previous blog posts, we did not cover one of the main features of any monitoring platform: Alarming. In Zabbix, it is named triggers.
Item and Trigger
Trigger is based on an item calculation. Thus, the first thing to do is to create an item.
So, let’s create a simple check HTTPS port like the following:
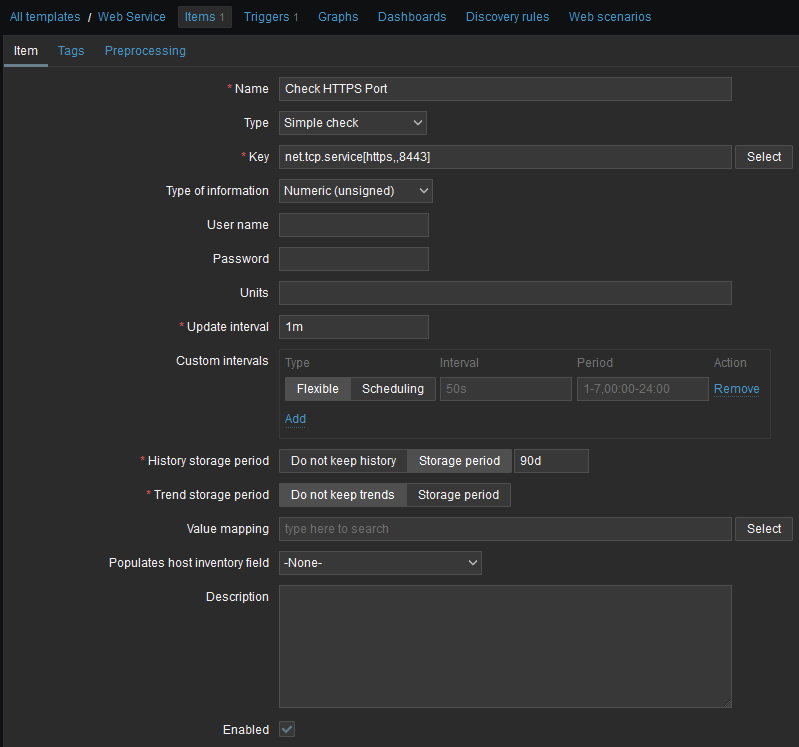
As you can see, this is of type Simple Check, and it tests if a service is running and accepting TCP connections. Note that this item was created in a template for easier setup.
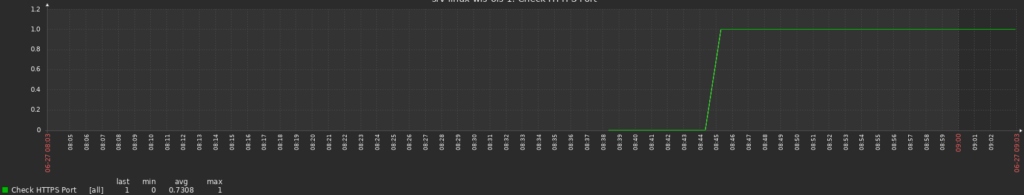
We can check the historical data of this status:
Trigger Setup
Next step is to define a trigger on this item. In the same Web Service template, I go into Triggers tab and click Create trigger button.
I name the trigger and select severity. The interesting part is the expression:
last(/Web Service/net.tcp.service[https,,8443],#1)=0
Let’s try to understand that formula by decomposing it:
last: Takes the last available value of the item/Web Service/net.tcp.service[https,,8443]: The template name followed by the check#1: Is the latest value available. You can go further by looking at N# most recent value=0: To indicate that trigger is raised when result of last evaluation is 0, meaning port is not reachable
This is a first try in an attempt of auto-recovery as this test does not really check that application is responding. Only TCP connectivity is tested (TCP might be OK, when web application is not).
Action and Script
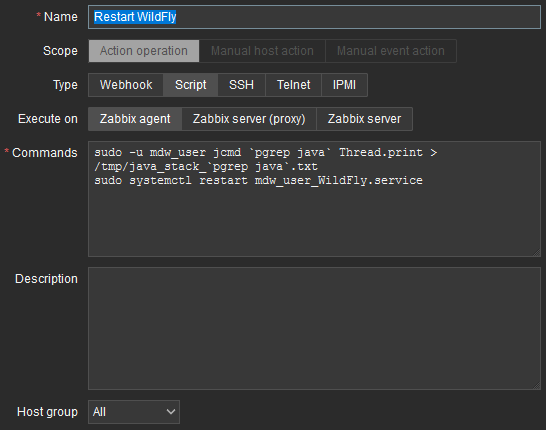
What follows is the creation of a script that will run when the trigger change to problem state. Go in Alerts and scripts. Scripts command are as follow:
sudo -u mdw_user jcmd `pgrep java` Thread.print > /tmp/java_stack_`pgrep java`.txt
sudo systemctl restart mdw_user_WildFly.service
Before doing the restart, I am getting a stack trace:
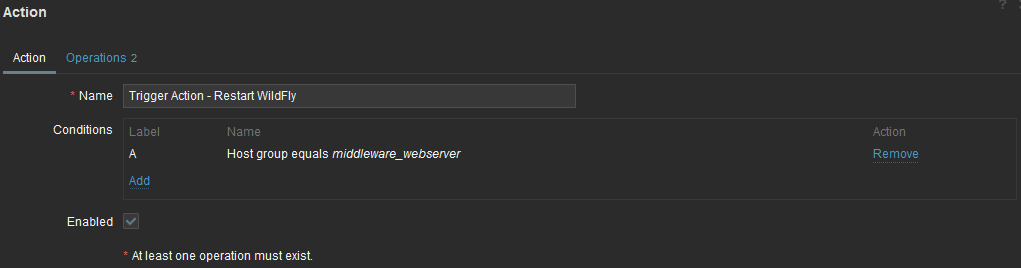
Then, we must create a trigger action. In Alerts, Actions, click trigger actions and click Create action button. Name the action and add conditions which are filters to better target the hosts where action could be triggered. In my case, I only filter on host group but you have many filtering possibilities:
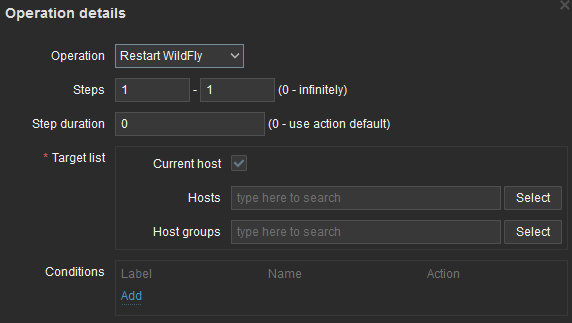
In the operations tab, you set what you want the action to do. I am adding an operation that is calling the script:
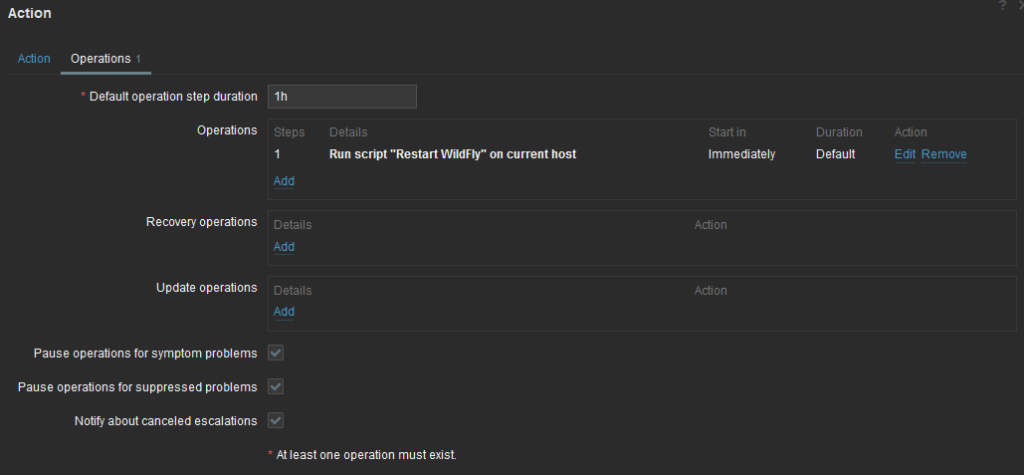
Once completed, Operations tab will look like that:
Testing
It is time to test our setup. For that, I will simply stop the service. Of course, thread dump will be empty in that case.
As soon as service is stopped, a high severity problem is raised:

After one minute, problem resolve itself:

In Actions column, I can click to get more information on what happened (most recent event on top):
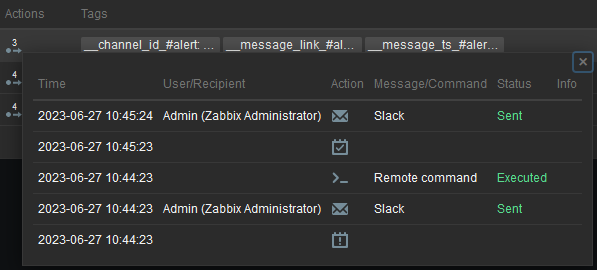
Not only you can see the remote command but also Slack notification I previously setup and tested.
Improvements
One possible improvement is to use Web scenario instead of simple TCP test as, in some situations, server keep port available, but application itself is not responding HTTP 200 code.
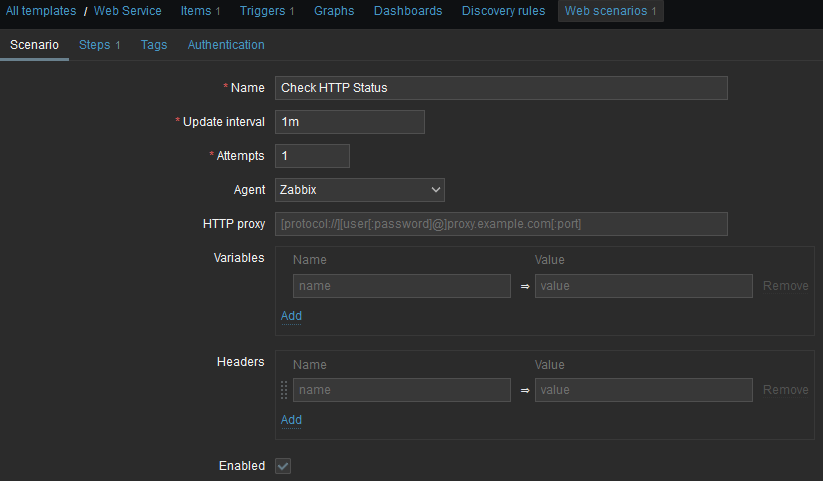
I will create a Web scenario with only one step as my web application is a simple Hello World application. I filled first scenario tab like that:
And first, and only step:
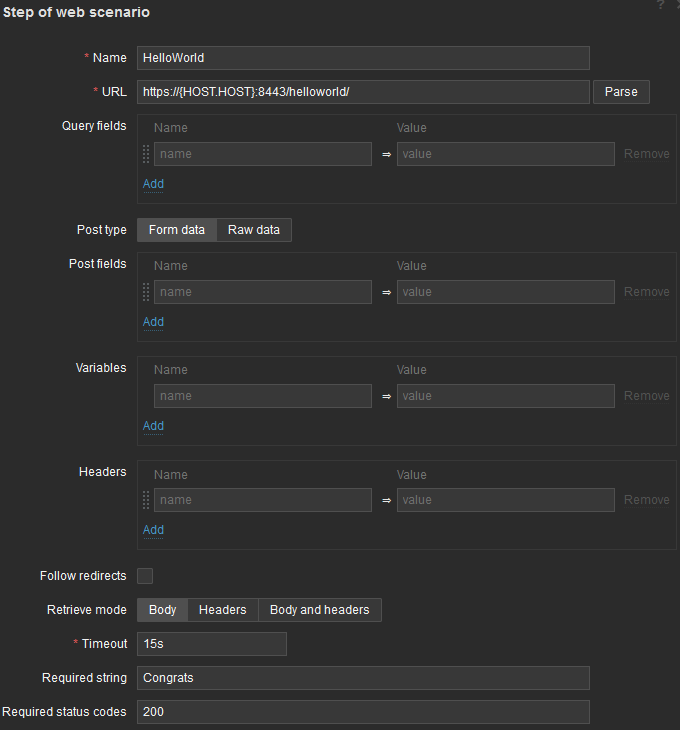
For step to be considered successful, it requires two conditions:
- Returned content must contain “Congrats” string
- Status code must be 200
As this scenario is in a template, URL must be generic, thus I used {HOST.HOST} built-in macro.
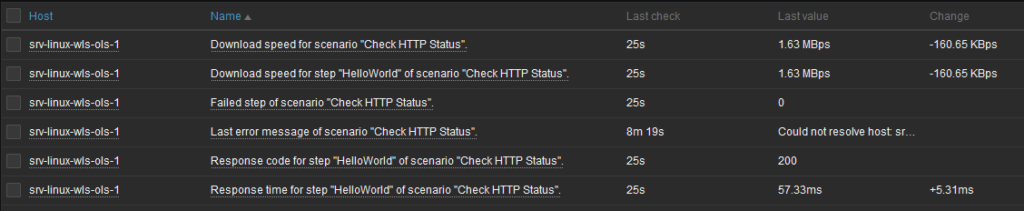
Another advantage of scenario is that it automatically creates few items on performance:
Finally, we can create a trigger as before with a different Expression:
last(/Web Service/web.test.fail[Check HTTP Status])<>0
When any step of the scenario is failed, meaning web.test.fail will be different from 0, then a problem will be raised and automatically resolved.

Et voilà !
Conclusion
I am not a fan of auto-recovery if nothing is really done to prevent issues from happening, but how this trigger has been defined, it will automatically gather logs and recover just after. That I like very much!
![Thumbnail [90x90]](https://www.dbi-services.com/blog/wp-content/uploads/2022/09/DDI_web-min-scaled.jpg)