In this blog, we will see how to add custom monitoring metric into Zabbix and, more precisely, get Java Virtual Machine (JVM) garbage collector heap statics.
jstat
OpenJDK includes an interesting tool to monitor a JVM: jstat.
Let’s see what we have when running it:
$ /app/Java/jdk/bin/jstat -gc `pgrep java`
 S0C    S1C    S0U    S1U      EC       EU        OC         OU       MC     MU    CCSC   CCSU   YGC     YGCT    FGC    FGCT    CGC    CGCT     GCT
 0.0   11264.0  0.0   11264.0 649216.0 252928.0  388096.0   70777.5   131840.0 119912.0 18048.0 14451.3     27    1.867   0      0.000   2      1.027    2.895
I am providing two arguments. -gc to get garbage-collected heap statistics and the JVM PID. Note that this will work only if one java process is running on the host.
Each column represents a size, capacity or count:
S0C: Current survivor space 0 capacity (kB).S1C: Current survivor space 1 capacity (kB).S0U: Survivor space 0 utilization (kB).S1U: Survivor space 1 utilization (kB).EC: Current eden space capacity (kB).EU: Eden space utilization (kB).OC: Current old space capacity (kB).OU: Old space utilization (kB).MC: Metaspace capacity (kB).MU: Metaspace utilization (kB).CCSC: Compressed class space capacity (kB).CCSU: Compressed class space used (kB).YGC: Number of young generation garbage collection events.YGCT: Young generation garbage collection time.FGC: Number of full GC events.FGCT: Full garbage collection time.GCT: Total garbage collection time.
I will not go in detail of these counters, but I will explain how to monitor them with Zabbix.
system.run
At first, we need to define an item that will:
- Run
jstatcommand - Convert result to JSON format
Go on Hosts list and click on Items on a host which is running a JVM (note that could be done in a template as well):

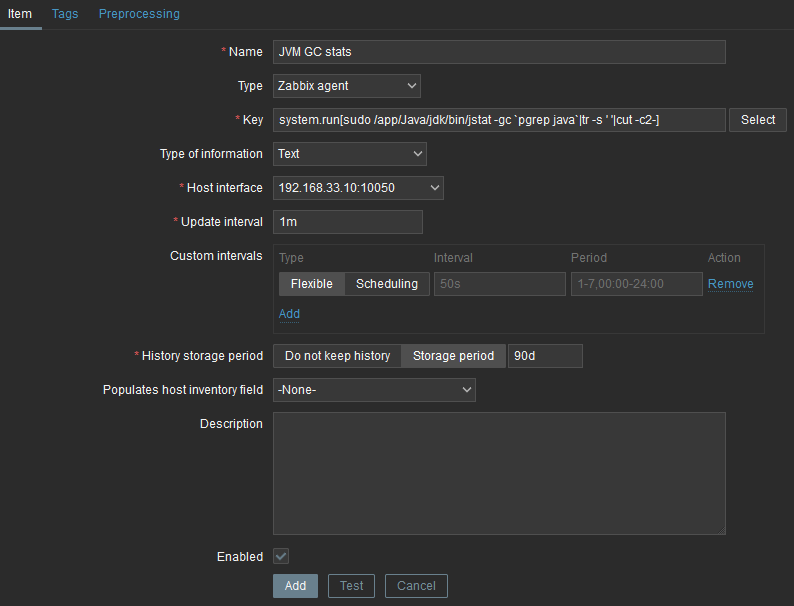
Click “Create Item” and fill in the black:
- Set a name (ie. JVM GC stats)
- Add the following key:
system.run[sudo /app/Java/jdk/bin/jstat -gc`pgrep java`|tr -s ' '|cut -c2-]
Unfortunately, I did not find a way, natively with Zabbix (maybe you know one?) to convert this to JSON directly, so I used bash tricks. tr -s ' ' will remove any repeating space and cut -c2- will remove the extra space from the beginning.
And, by the way, system.run is the way to call a command on an agent.
First screen looks like that:
Access to jstat
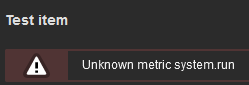
By default, Zabbix server is not allowed to call any commands from agent, so we must allow it in agent configuration. If not, you will have this not-so-clear error:
For obvious security reasons, all system.run are denied by default, so we must explicitly allow it. This is done by adding AllowKey=system.run[sudo /app/Java/jdk/bin/jstat*] in /etc/zabbix/zabbix_agent2.conf, followed by a service restart (systemctl restart zabbix-agent2.service).
We must also allow zabbix user to run sudo as well. With visudo /etc/sudoers:
zabbix ALL=(ALL) NOPASSWD: /app/Java/jdk/bin/jstat
Now, we can trigger a test by clicking Test button and Get value and test from newly opened window:
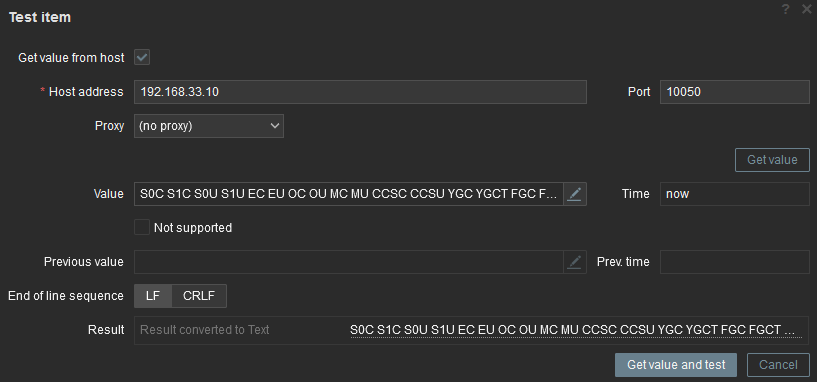
As you can see, the result is there but not very easy to use. Now, we have to convert it to JSON format.
Preprocessing
To convert to JSON, we will use Preprocessing feature. After I closed Test item windows, I go in Preprocessing tab of the item. All the formatting part is done in the command, so converting to JSON is just a matter of adding one preprocessing step:
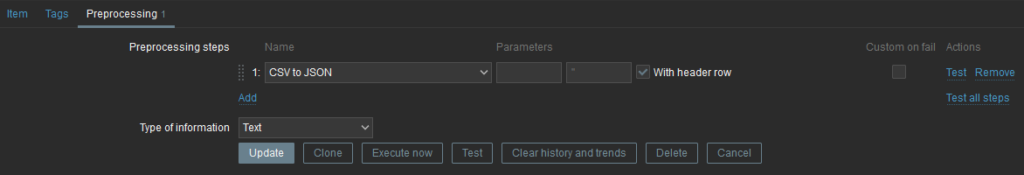
Note that Parameters cell contains one space which is the column delimiter. We can also test it:
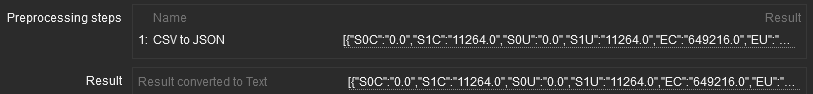
At this time, we can see we have a JSON formatted string. To have one metric in item, we could either add another step as JSONPath to extract the metric we want of create a dependent item. I will go for option two as: It will avoid some useless (repeating) load on each item. jstat command as well as CSV to JSON parsing will be run once only per period.
Dependent item
Let’s create a new item which will be dependent from previously created item: In Type, I am selecting Dependent item. and then JVM GC stats as Master item:
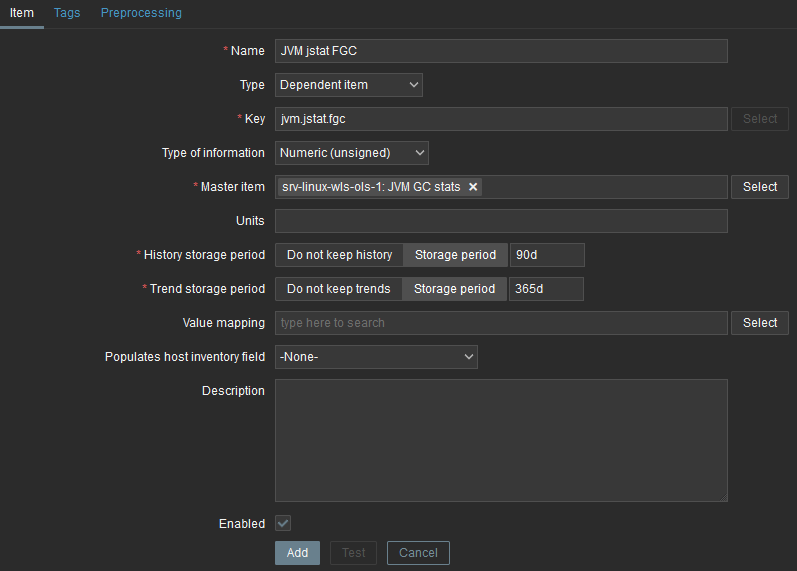
Name and Key are up to you.
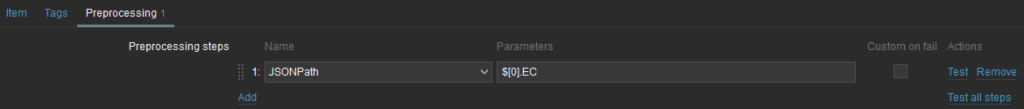
To extract the value of EU (Eden space utilization (kB)), I will use JSONPath preprocessing steps with parameter $[0].EU. 0 is the first line of the JSON array which contains anyway only one and EU is the column name:
Here it is not possible to test the item, but the preprocessing step (Test all steps button). Unfortunately, you must provide the result of the master item to be able to test it. In my case, result of master item was:
[{"S0C":"0.0","S1C":"11264.0","S0U":"0.0","S1U":"11264.0","EC":"649216.0","EU":"159744.0","OC":"388096.0","OU":"70933.5","MC":"131840.0","MU":"119991.7","CCSC":"18048.0","CCSU":"14451.8","YGC":"29","YGCT":"2.163","FGC":"0","FGCT":"0.000","CGC":"2","CGCT":"1.027","GCT":"3.191","":""}]
After a click on Test, we will see the result:

And we can see the historical evolution of it:
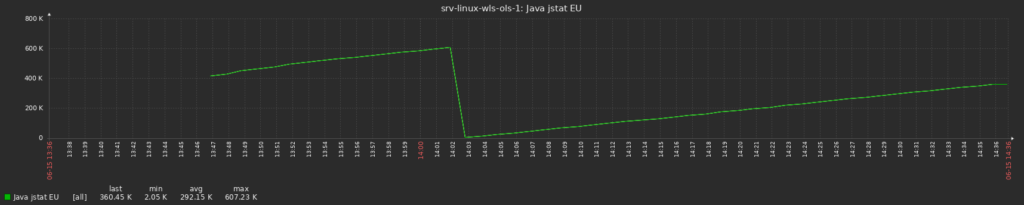
We can even see that one garbage collection happened between 14:01 and 14:02.
And Next?
Afterwards, you have to create as many dependent item as you want to monitor metrics from jstat. The more direct solution is to clone previous item. There a several other possibilities to automatically create them all, but I did not had time to try them yet.
And you, do you have any easy ( lazy 🙂 ) way to achieve this?
![Thumbnail [90x90]](https://www.dbi-services.com/blog/wp-content/uploads/2022/09/DDI_web-min-scaled.jpg)