Zabbix is a fully featured open-source monitoring solution. I wanted to evaluate how easy it is to monitor an application server like WildFly.
Server Installation
First component to install is the server which also requires a database (PostgreSQL in my case). As it was already explained by Daniel’s blog, I will not go into too much details. For the server to be able to gather detailed information about WildFly, Zabbix requires a Java gateway. When Zabbix software repository is already setup, installation is easy:
dnf install zabbix-java-gateway
Java gateway will be a proxy to all JMX requests that Zabbix will send to JMX-enabled hosts.
Configuration file path for Java gateway is /etc/zabbix/zabbix_java_gateway.conf. For my installation, I did not need to modify this one, but the main zabbix configuration file: /etc/zabbix/zabbix_server.conf
I modified as follow:
- Uncomment line 8 and put IP of Java Gateway server (hosted on same server as Zabbix server).
- Uncomment line 16 and put port of Java Gateway. 10052 is the default port.
- Uncomment line 24 and put 5.
File content look like this (extract):
[...]
### Option: JavaGateway
#       IP address (or hostname) of Zabbix Java gateway.
#       Only required if Java pollers are started.
#
# Mandatory: no
# Default:
JavaGateway=<***.***.***.***>

### Option: JavaGatewayPort
#       Port that Zabbix Java gateway listens on.
#
# Mandatory: no
# Range: 1024-32767
# Default:
JavaGatewayPort=10052

### Option: StartJavaPollers
#       Number of pre-forked instances of Java pollers.
#
# Mandatory: no
# Range: 0-1000
# Default:
StartJavaPollers=5
[...]
For Java Gateway to connect to WildFly, it will require jboss-client.jar library. It can be found under bin/client in WildFly home directory and it must be copied in /usr/share/zabbix-java-gateway/lib/ on Zabbix server.
A zabbix-server service restart is required for configuration changes to be taken into account and a restart of zabbix-java-gateway service for new library.
Add JMX Host
During my previous tests of Zabbix, I already added a host with a Zabbix agent into the configuration. Now, I want to add WildFly monitoring which will be done by a adding JMX interface. I need to go in hosts list and edit the host:
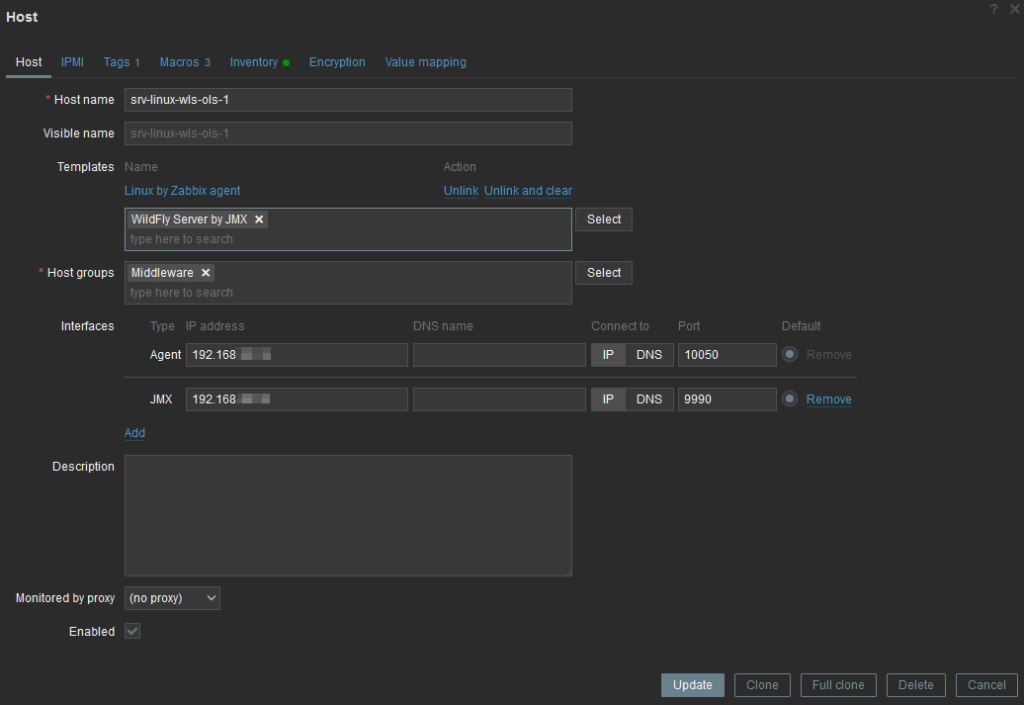
As you can see, I have added an extra template named WildFly Server by JMX as well as a JMX interface to my existing host. The port corresponds to WildFly management port.
Next, we need to define macros (ie. variables) for Java Gateway to connect to WildFly:
- {$WILDFLY.JMX.PROTOCOL}
- {$WILDFLY.PASSWORD}
- {$WILDFLY.USER}
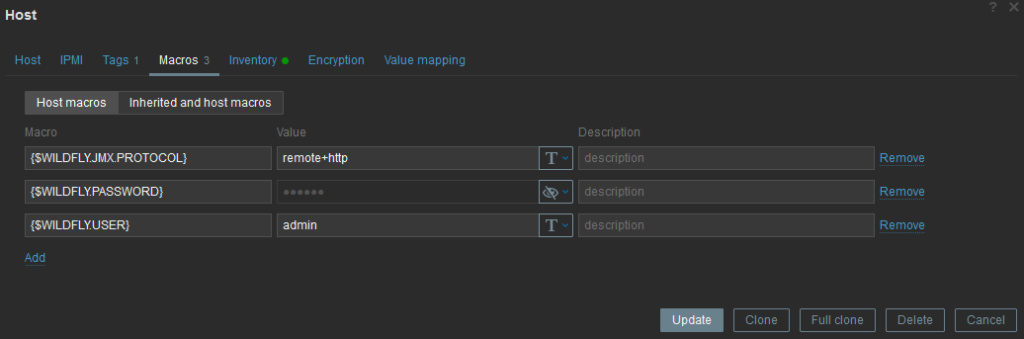
Finally, I click update.
After few seconds and a refresh, I can see that JMX interface become green as well:

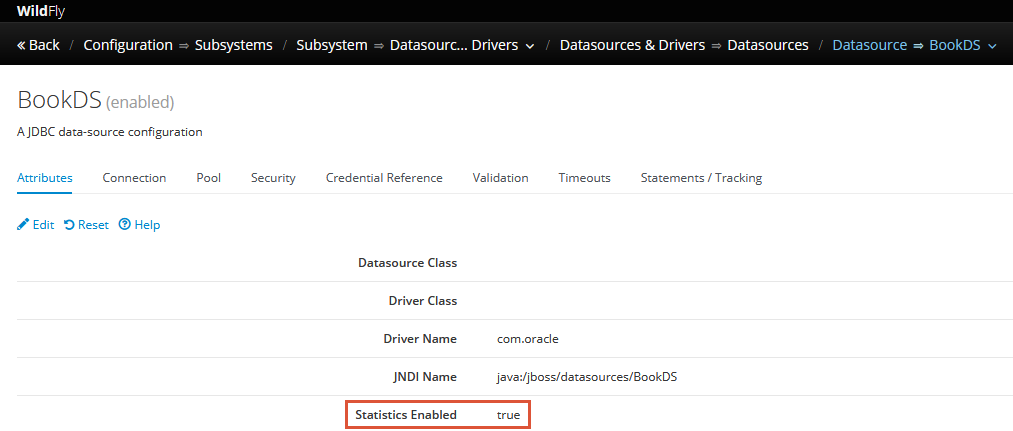
After one more minute, I see new problems raised concerning datasource: They did not have statistics enabled. For that, I just need to enable that in WildFly configuration:
Likewise for Web subsystem Undertow:
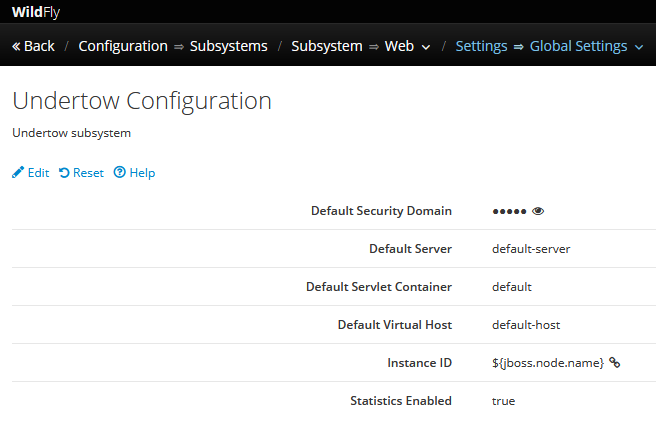
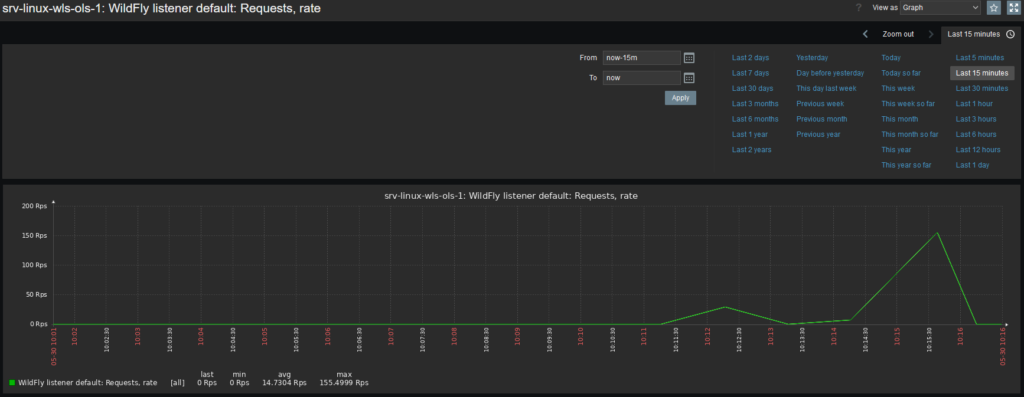
After that, I can plot a graph for Request per second:
Note that provided template will only get metrics for http and not https as per discovery rule definition: jboss.as:subsystem=undertow,server=,http-listener=*
This comes from selected template. We could either create our own template or modify existing template, but this is another topic.
![Thumbnail [90x90]](https://www.dbi-services.com/blog/wp-content/uploads/2022/09/DDI_web-min-scaled.jpg)
mimo
07.06.2023I have been trying to get Wildfly monitored in Zabbix 6.0 LTS for a while now, but with no luck so far - we have 50+ Linux servers with Wildfly and a java application on top.
I have followed your excellent and simple guide to try again, but I get the same error I have been struggling with all along, namely the following,
192.168.40.67:9990 Not available Unsupported protocol: remote+http: service:jmx:remote+http://192.168.40.67:9990
It should be mentioned that I am using Zabbix Agent2 and Zabbix Agent Active.
Do you have any idea what this could be?
With kind regards
Michael
Hi Michael,
Thanks for posting your question.
I had the same issue when jboss-client.jar file was not copied in lib directory of Zabbix. You also have to restart both zabbix-server and zabbix-java-gateway services for library to be loaded.
Regards,
Olivier