In a previous blog post, I explained how to monitor Apache Tomcat with Prometheus with help of JMX exporter. It is not always desirable to use JMX as it requires:
- An additional service setup (which runs another JVM)
- Extra ports opening
- Complex settings for security (encryption and access)
Fortunately, it is possible to instrument a JVM directly with an additional javaagent argument.
Java Agent
Once we downloaded the java exporter from github repo, we simply need to add the following arguments to the JVM startup command:
-javaagent:/opt/monitoring/jmx_prometheus_javaagent-0.20.0.jar=9115:/opt/monitoring/config.yaml
If we split the argument by the semi column, we have these:
-javaagent/opt/monitoring/jmx_prometheus_javaagent-0.20.0.jar=9115/opt/monitoring/config.yaml
First argument tells JVM to consider this the instrumentation setting. Second is the path to the binary which will listen on port 9115. Third, and last, is the path to the Java exporter configuration file.
Configuration file is identical to what we have created in the blog with JMX:
rules:
- pattern: ".*"
I extended it by enabling an authentication method and SSL configuration like that:
httpServer:
  authentication:
    basic:
      username: Prometheus
      password: <secret>
  ssl:
    keyStore:
      filename: /etc/opt/alfresco/rmi-ssl/keystore.p12
      password: <keystorepass>
    certificate:
      alias: alfresco
Restart tomcat and check if port is listening:
netstat -lnp | grep 9115
And we can check if we can reach the metrics with command:
curl -s -u Prometheus: https://localhost:9115/metrics
Output example:
# HELP jvm_gc_collection_seconds Time spent in a given JVM garbage collector in seconds.
# TYPE jvm_gc_collection_seconds summary
jvm_gc_collection_seconds_count{gc="G1 Young Generation",} 8.0
jvm_gc_collection_seconds_sum{gc="G1 Young Generation",} 0.219
jvm_gc_collection_seconds_count{gc="G1 Old Generation",} 0.0
jvm_gc_collection_seconds_sum{gc="G1 Old Generation",} 0.0
# HELP jvm_info VM version info
# TYPE jvm_info gauge
jvm_info{runtime="OpenJDK Runtime Environment",vendor="Eclipse Adoptium",version="17.0.3+7",} 1.0
...
Next step will be to configure Prometheus to pull these metrics.
Prometheus
Simply add a new job in scrape_config section of Prometheus configuration file:
  - job_name: tomcat
    static_configs:
      - targets:
        - <alfresco>:9115
    scheme: https
    basic_auth:
      username: Prometheus
      password: <secret>
Next, we send a SIGHUP signal to the process for configuration reload:
sudo kill -s SIGHUP <pid>
And the target should go in Up state in Prometheus Web UI:

Now, we can run a PromQL query (jvm_memory_bytes_used{job="tomcat"}) as a final check before going to Grafana:

Grafana
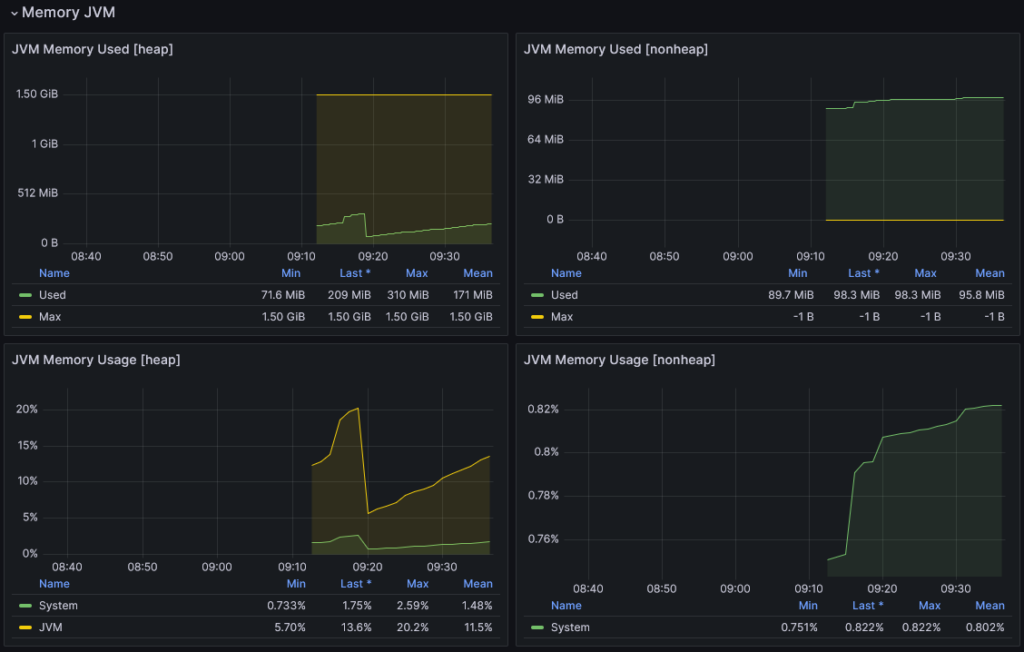
In Grafana, we can import a simple dashboard like this one which will look like this:
What Next?
Note that this procedure can apply to any JVM, not only Apache Tomcat.
![Thumbnail [90x90]](https://www.dbi-services.com/blog/wp-content/uploads/2022/09/DDI_web-min-scaled.jpg)