Skip to content

Monitoring

Watching sql statements in PostgreSQL

Back in 2012 I wrote a small blog post about watching the results of commands in Linux. Well, the same can be done in psql: (postgres@[local]:4448) [postgres] > create table t1 ( a int ); CREATE TABLE (postgres@[local]:4448) [postgres] > insert into t1 values ( generate_series ( 1, 10)); INSERT 0 10 (postgres@[local]:4448) [postgres] > select count(*) from t1; count… 

Monitoring tools for PostgreSQL – POWA

The last posts introduced the logging system, pg_stat_statements, pg_activity and pgcluu. This post will look at POWA: PostgreSQL Workload Analyzer. For getting the most out of POWA the following extension should be installed in the PostgreSQL instance you want to monitor: pg_stat_statements (see last post) pg_stat_kcache: gathers statistics about reads and writes done by the file system layer pg_qualstats: gathers… 

Monitoring tools for PostgreSQL – pgcluu

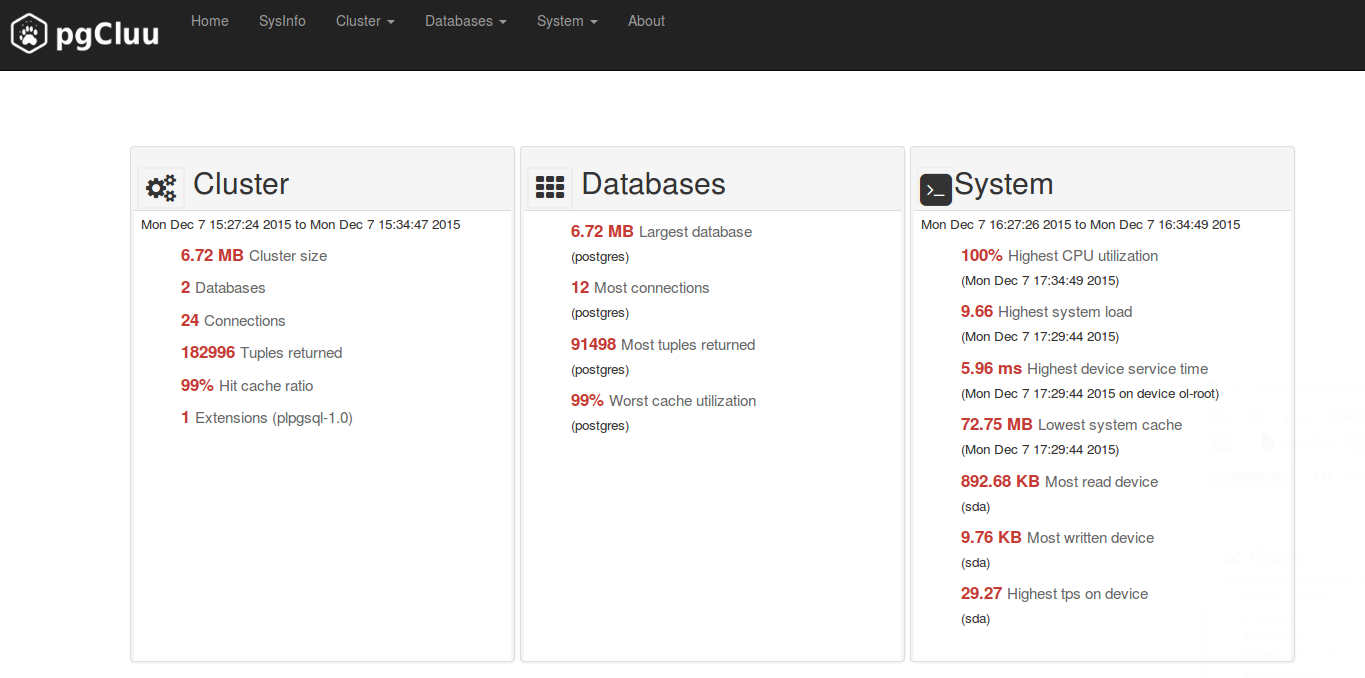
The last posts introduced the logging system, pg_stat_statements and pg_activity. All of these can be used to monitor sql statements the PostgreSQL server is executing. In this post I’ll look into pgcluu: PostgreSQL Cluster utilization! This is a more complete monitoring solution as it is not only focused on sql statements but gives you information about the database cluster itself… 

SQL Monitoring in PostgreSQL (3) – pg_activity

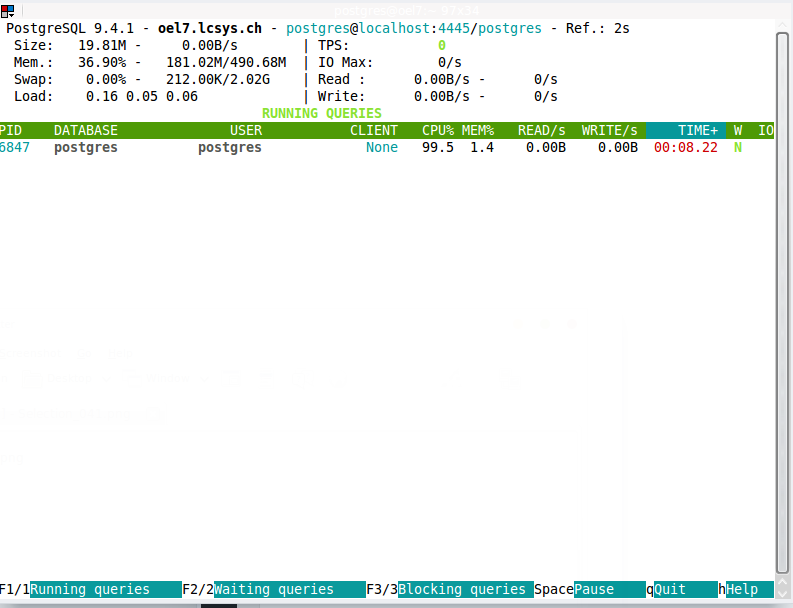
The last posts looked at how the logging system and the pg_stat_statements extension can be used to monitor sql statements in PostgreSQL. This post will introduce pg_activity which is very similar to htop. There are some dependencies which need to be installed before we can start installing pg_activity. The first one is python. As I am on a redhat based… 

SQL Monitoring in PostgreSQL (2) – pg_stat_statements

The last post looked into how you can monitor queries using the logging system. This post will introduce pg_stat_statements. pg_stat_statements is a module that needs to be loaded and is not available in the default configuration. Loading it is quite easy. Create the extension as usual: postgres@oel7:/home/postgres/ [PG6] sqh Null display is “NULL”. Timing is on. psql (9.5alpha2) Type “help”… 

SQL Monitoring in PostgreSQL (1) – the logging system

When developing an application as well as when the application is in production there is the need to identify long running queries. In Oracle one tool you might use for that is the SQL Monitor. In this post I’ll look into what PostgreSQL provides in this area. PostgreSQL has a very strong logging system. This system can be used to… 

Oracle EM Cloud Control 12c (CC12c)- Repeat alert notification

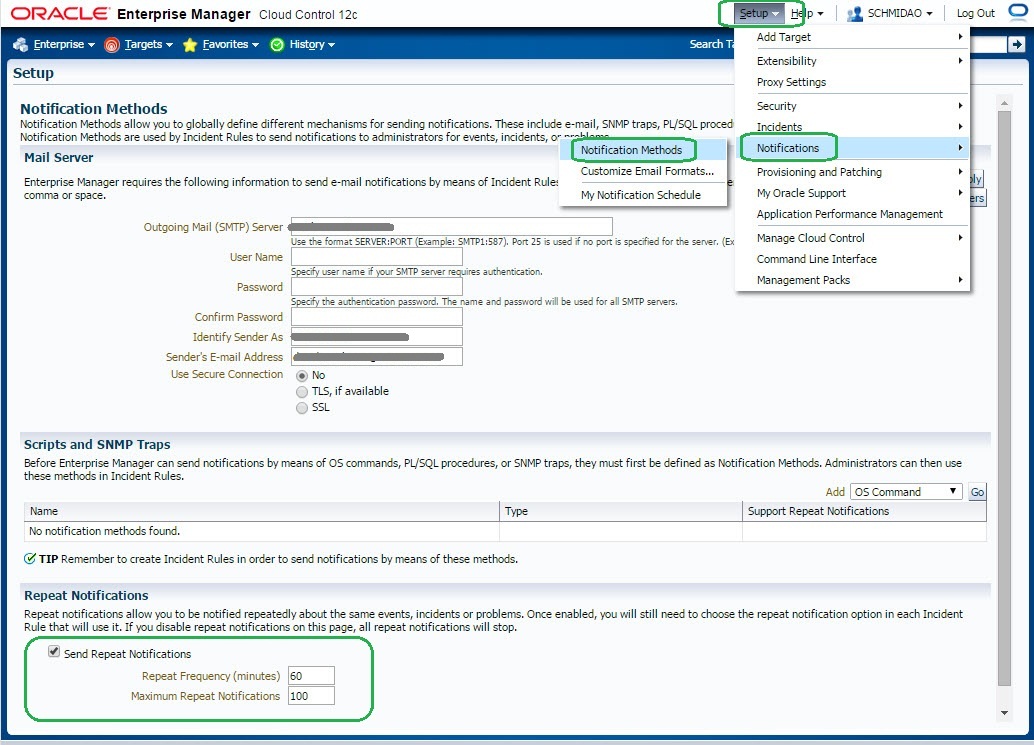
Oracle EM Cloud Control 12c (CC12c) – Repeat alert notification In your EM installation, CC12c will notify your different administrators when specific incidents, events, or problems occurs. But from standard configuration, you will receive only one warning or critical notification/alert … until the Clear or an Acknowledge of the alert. Some times and for different reasons (human error, email was… 

using dbms_server_alert in combination with a custom monitoring solution

Lot’s of companies do not use Grid- or Cloud Control for monitoring their Oracle databases for various reasons but rather use open source tools like nagios. And lot of those either implemented custom script frameworks or rely on plug-ins available for the monitoring solution of choice. This post shall show on how you can let Oracle check a lot of… 

SQL Server monitoring with nagios: utilisation

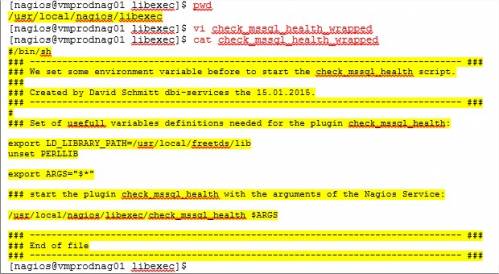
We saw in my last blog how to install the SQL Server plugin for Nagios. In this new blog, I will explain: how to create a wrapper to avoid the unset of the PERLLIB variable how to create and configure a configuration file by monitoring instance how to create an SQL Login for nagios How to subscribe to an alert… 

SQL Server monitoring with nagios: installation

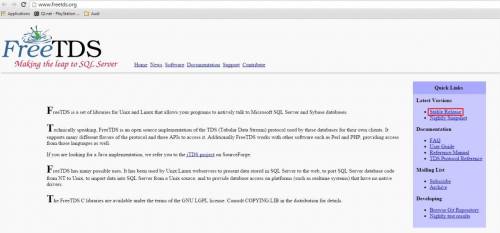
Nagios is an IT Infrastructure monitoring solution which is able to monitor SQL Server instances with a specific plugin. I have installed this plugin to test those functionalities and I will explain here how to do it. Prerequisites installation FreeTDS installation FreeTDS is a set of libraries for Unix and Linux that allows your programs to natively talk to Microsoft… 

Linux: how to monitor the nproc limit

By Franck Pachot . You probably know about ‘nproc’ limits in Linux which are set in /etc/limits.conf and checked with ‘ulimit -u’. But do you know how to handle the monitoring and be alerted when you’re close the fixed limit? Nproc and ps Nproc is defined at OS level to limit the number of processes per user. Oracle 11.2.0.4 documentation…