Skip to content

Monitoring

WildFly monitoring in Prometheus

In this blog, we will see how easy it is to add a WildFly server into a Prometheus setup. Metrics Fortunately, WildFly comes with a integrated metrics subsystem which is included in all out-of-the-box profiles. In the management console, we can go in subsystem and then metric menu to access settings: There are not many parameters, but I will not… 

AWS re:Invent day 3 – Gray failures mitigation

So again during the 3rd day of the re:Invent 2022 there were plenty of interesting information to take with us. However, the most interesting part was for sure the workshop about gray failures and how to mitigate them in a multi-AZ environment. Let me try to wrap this up for you… What are gray failures? No idea what “gray failures… 

What I really like about Percona PMM

Percona Monitoring and Management tool (PMM) is an Open Source product which was developed to help DBAs and developers to monitor and manage MySQL, PostgreSQL and MongoDB performances. In this blog post, we will see that we can do much more with it! I discovered this tool 2 years ago when I started a monitoring study for a customer, and… 

Monitoring – first steps with Prometheus

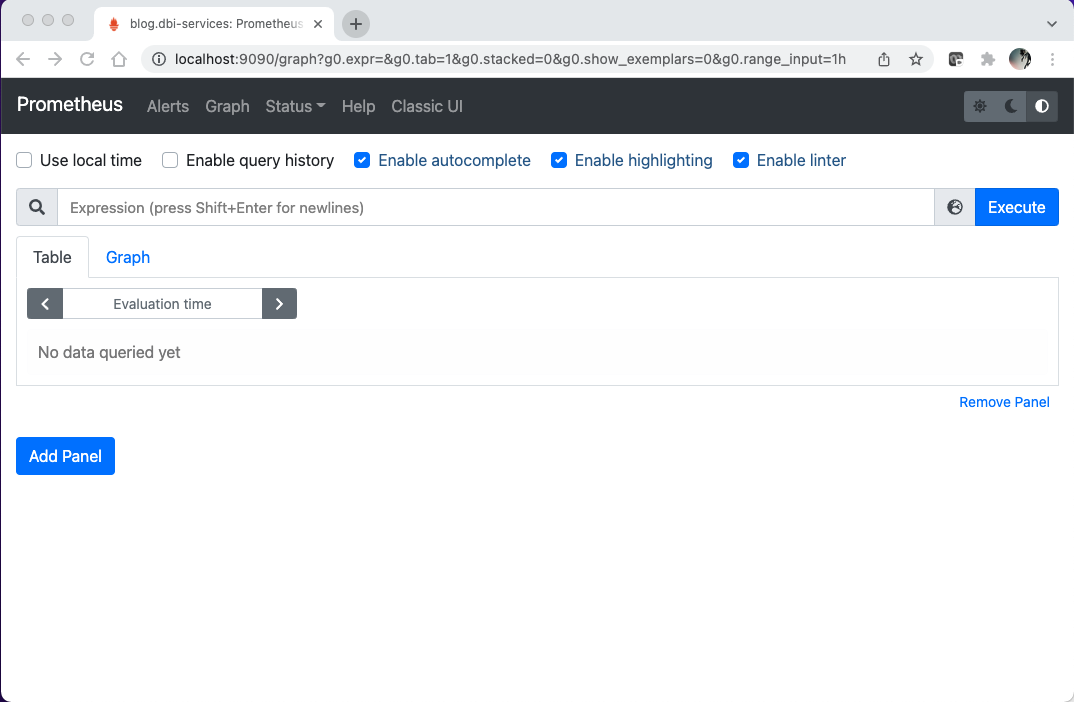
Monitoring is a crucial element of DevOps automation that has to be proactive, meaning it must find ways to improve applications quality before bugs appear. Therefore, we have to quickly and easily understand what is happening in our infrastructure, which is often more and more complex and constantly evolving. In this context, one tool stands out: Prometheus. Prometheus is an… 

Open source monitoring solutions (1) – Zabbix server setup

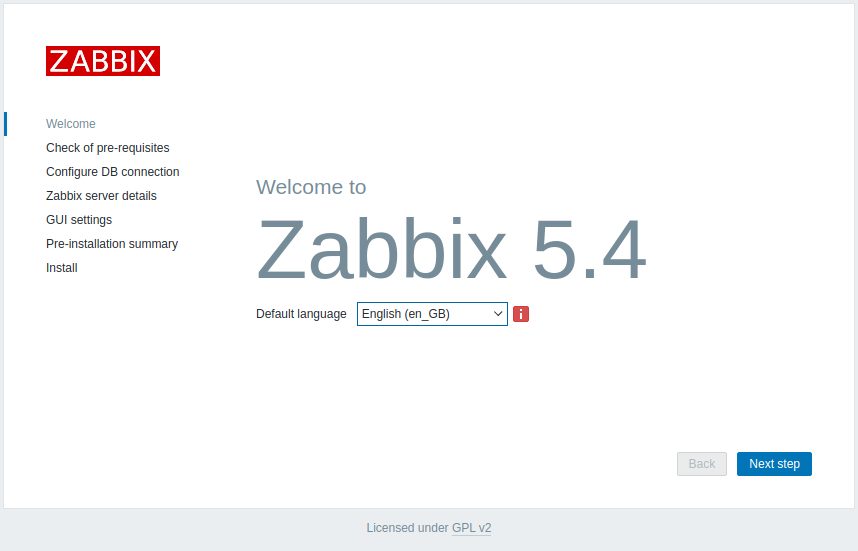
We are often asked which monitoring solution we recommend for PostgreSQL, by people attending our PostgreSQL workshops. We usually answer: What do you have in place already? If a solution already is in place, the most obvious way is trying to integrate into the existing solution. If nothing is there already, you have plenty of choices. You can find some… 

SQL Server: Analysis of SCOM Warning on the Health Check

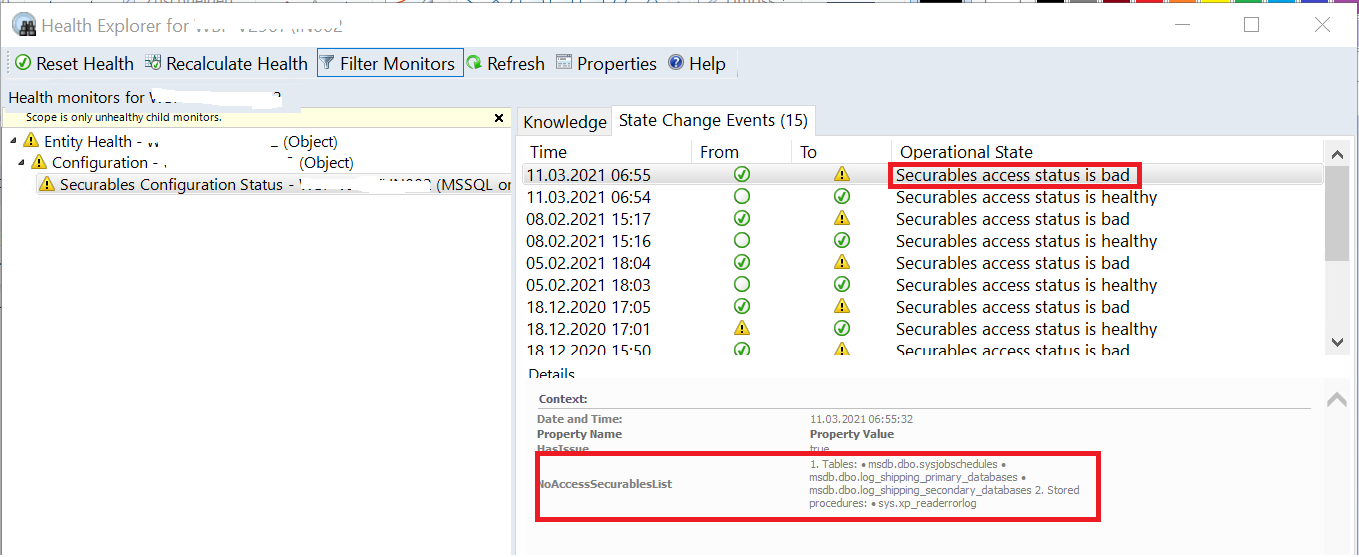
Sometimes, it’s hard to find how to analyze a Warning in the SCOM Interface and correct the problem. By a customer, we install new instances in SQL Server 2019 and change the version of SCOM. All new servers have a warning on the Health. The first step in the SCOM interface is to go to the SQL Server Roles: On… 

temBoard on SLES15 – 2 – The agent

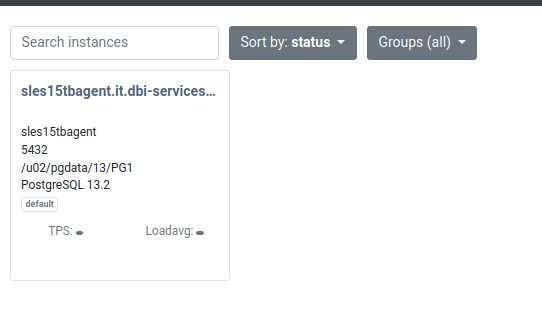
In the last post we’ve installed the temBoard repository and the UI. As this alone is not so much fun, we’ll be installing the temBoard agent on another SLES 15 machine in this post. We’ll end up with one PostgreSQL instance registered in the temBoard repository and this instance is constantly monitored. With the repository and the UI we had… 

temBoard on SLES15 – 1 – The WebUI

During our last SwissPUG online meeting there was a presentation about monitoring PostgreSQL with temBoard. A question that came up afterwards was: How to install that on SLES 15 as there are only packages for Debian and CentOS/RHEL. As temBoard is written in Python you can also install it using pip. That requires a bit more work compared to the… 

Install & configure a Nagios Server

What is Nagios ? “Nagios is a powerful monitoring system that enables organizations to identify and resolve IT infrastructure problems before they affect critical business processes.” https://www.nagios.org/ In simple words, you can monitor your servers (linux, MSSSQL, etc …) and databases (Oracle, SQL Server, Postgres, MySQL, MariaDB, etc …) with nagios.   We use the free version !!! 😀  … 

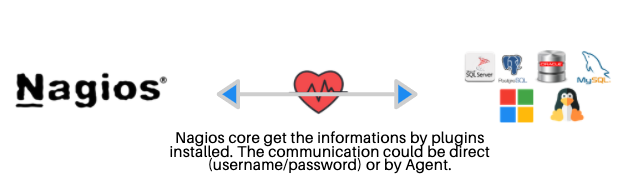
Nagios architecture

WebLogic – Update on the WLST monitoring

A few years ago, I wrote this blog about a WLST script to monitor a WebLogic Server. At that time, we were managing a Documentum Platform with 115 servers and now, it’s more than 700 servers so I wanted to come back in this blog with an update on the WLST script. 1. Update of the WLST script needed Over… 

Documentum story – Monitoring of WebLogic Servers

As you already know if you are following our Documentum Story, we are building, working and managing, for some time now, a huge Documentum Platform with more than 115 servers so far (still growing). To be able to manage properly this platform, we need an efficient monitoring tool. In this blog, I will not talk about Documentum but rather I…