Percona Monitoring and Management tool (PMM) is an Open Source product which was developed to help DBAs and developers to monitor and manage MySQL, PostgreSQL and MongoDB performances. In this blog post, we will see that we can do much more with it!
I discovered this tool 2 years ago when I started a monitoring study for a customer, and ever since, I’ve been in love with it. I will explain you why.

It’s Open Source!
Even if money is not everything…

PMM is completely Open Source, and this is not surprising coming from Percona. But as we know, the advantage of Open Source is not only the fact of being free…
Let’s contribute

One of the keys of Open Source is contribution. When I started using PMM and sometimes I cannot find all the information I needed and more details in the official documentation, or when I discover a bug or have a question, or even if I would like to have a new feature implemented, a whole community is there to support and share knowledge in a very impressive short time:
– A JIRA issue tracker to submit a bug report.
– A very useful blog with plenty of posts about new features, technical step-by-step deployment information, tips and much more. And obviously the possibility to write to the author.
– A Percona Community Forum to exchange with Percona experts.
Evolution

Open Source means also quick evolution of the product. PMM is getting better every month, with continuous improvements, new features, corrections of bugs and so on.
One tool to monitor several technologies

If we speak about monitoring solutions, what makes the difference nowadays? Except rare cases, each of us works with a mix of different database solutions: Open Source vs proprietary, On-Premises vs Cloud. And when we want to identify performance issues on our application, we also need system benchmarks, replication metrics, etc… PMM is a platform that we can use to centralize our monitoring data, because:
– Exporters to collect metrics for MySQL, MariaDB, PostgreSQL and MongoDB instances and their replication, the ProxySQL and the HAProxy, instances hosted on Amazon RDS or on Google Cloud Platform are embedded in the PMM tool as well as pre-configured dashboards, so the monitoring can be easily put in place.
– Even proprietary technologies such as Oracle and SQL Server can be integrated to PMM through external exporters. In this case we have the choice to develop our own exporter and design our own dashboards or use what is already been developed and designed by other contributors. Here you can find the links to some Third-party exporters.
Less maintenance tasks

The PMM platform is based on a client-server model. The 2 main components on the server side are the following ones:
– VictoriaMetrics, a time series database (replacing Prometheus since PMM 2.12.0 version) that aggregates metrics collected by exporters
– Grafana allowing to visualize the aggregated data in a web interface.
But actually, we don’t have to care about that! We don’t need to install Prometheus or VictoriaMetrics components, install Grafana and then configure it to let them talk together. We can just see the PMM platform as a black box: we will have only one tool to install and to maintain.
Sexy dashboards
Integrated dashboards are designed with accuracy and provide a detailed and temporal analysis of our data.
Here my favorite ones:
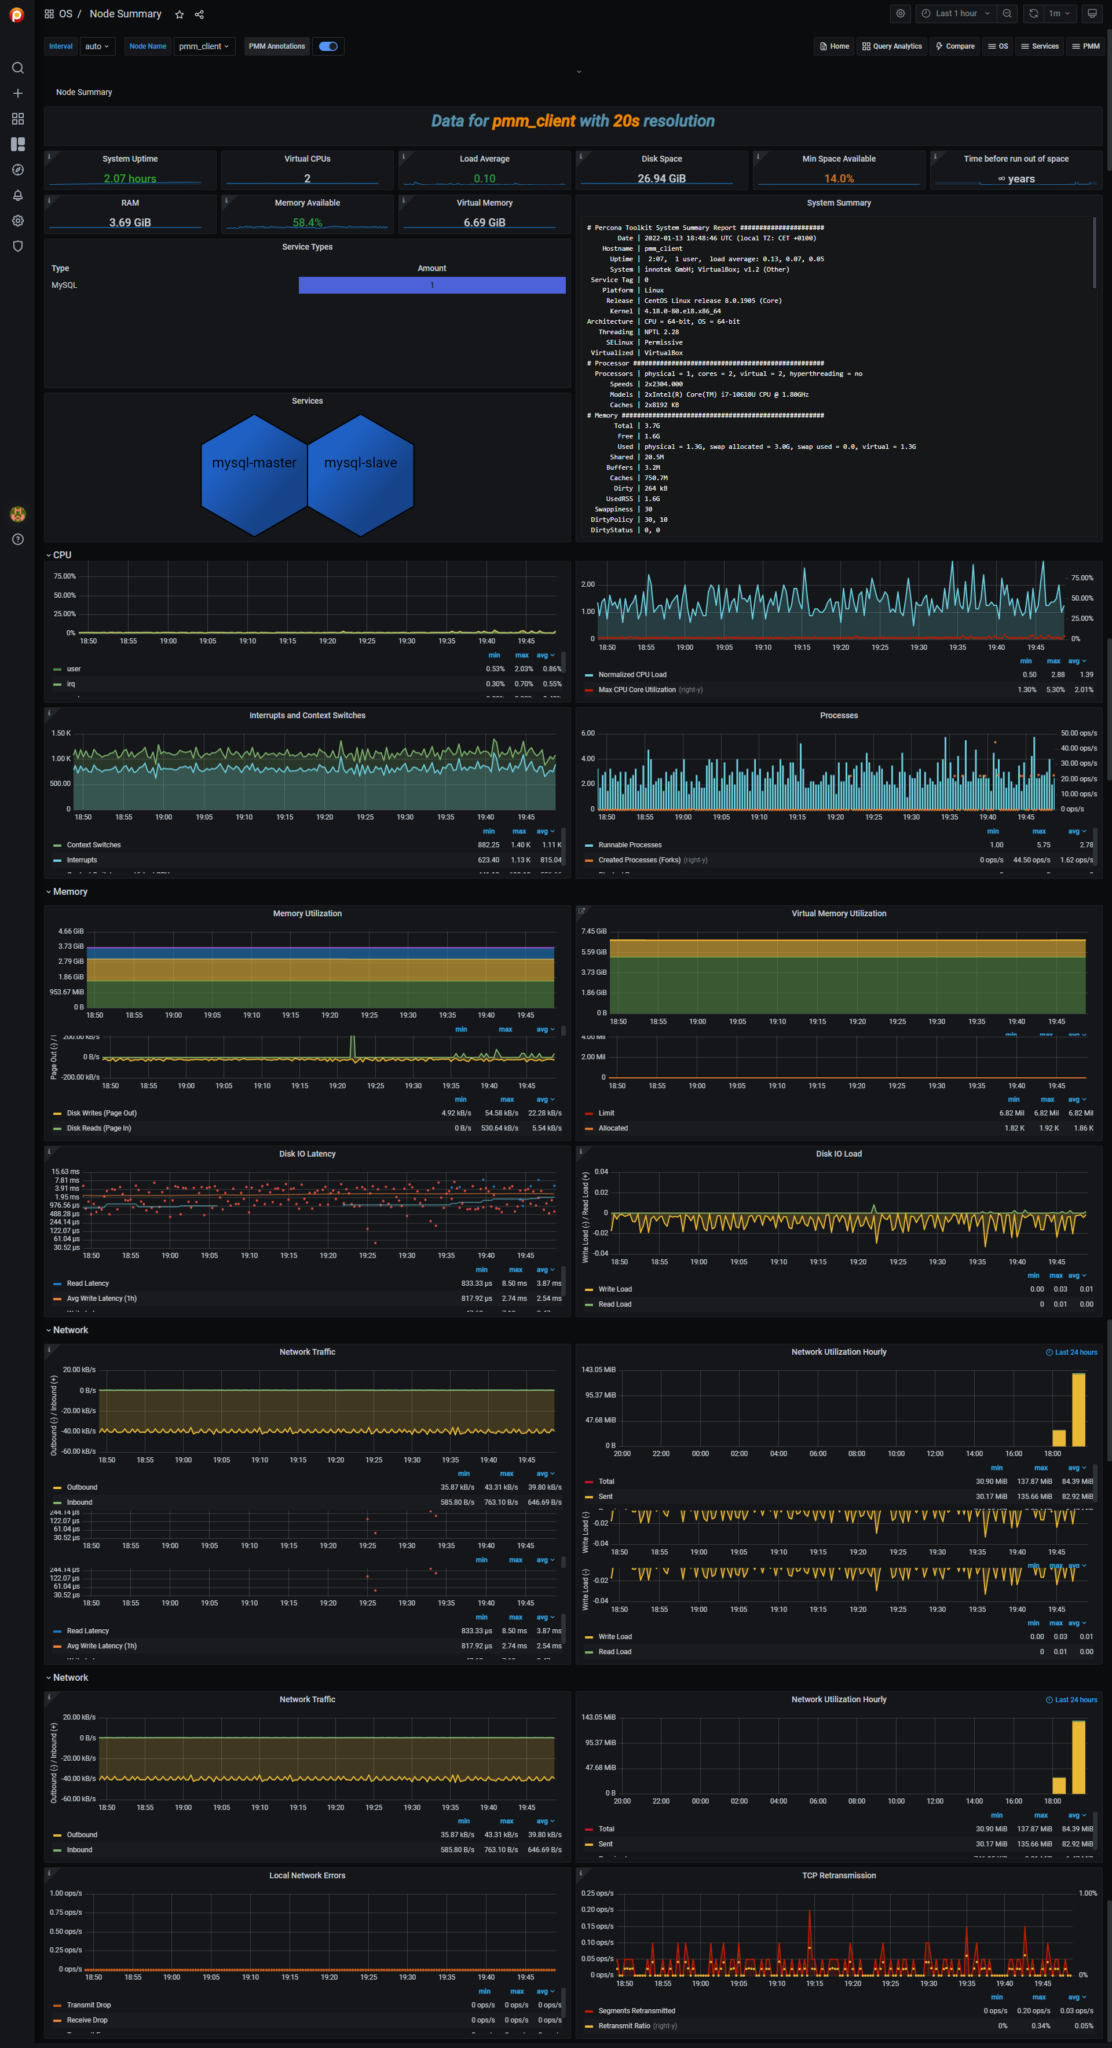
– Node Summary
It’s the system dashboard. We can visualize here metrics such as CPU, memory, disk occupation and performances, processes, network traffic and get some information about our system architecture:
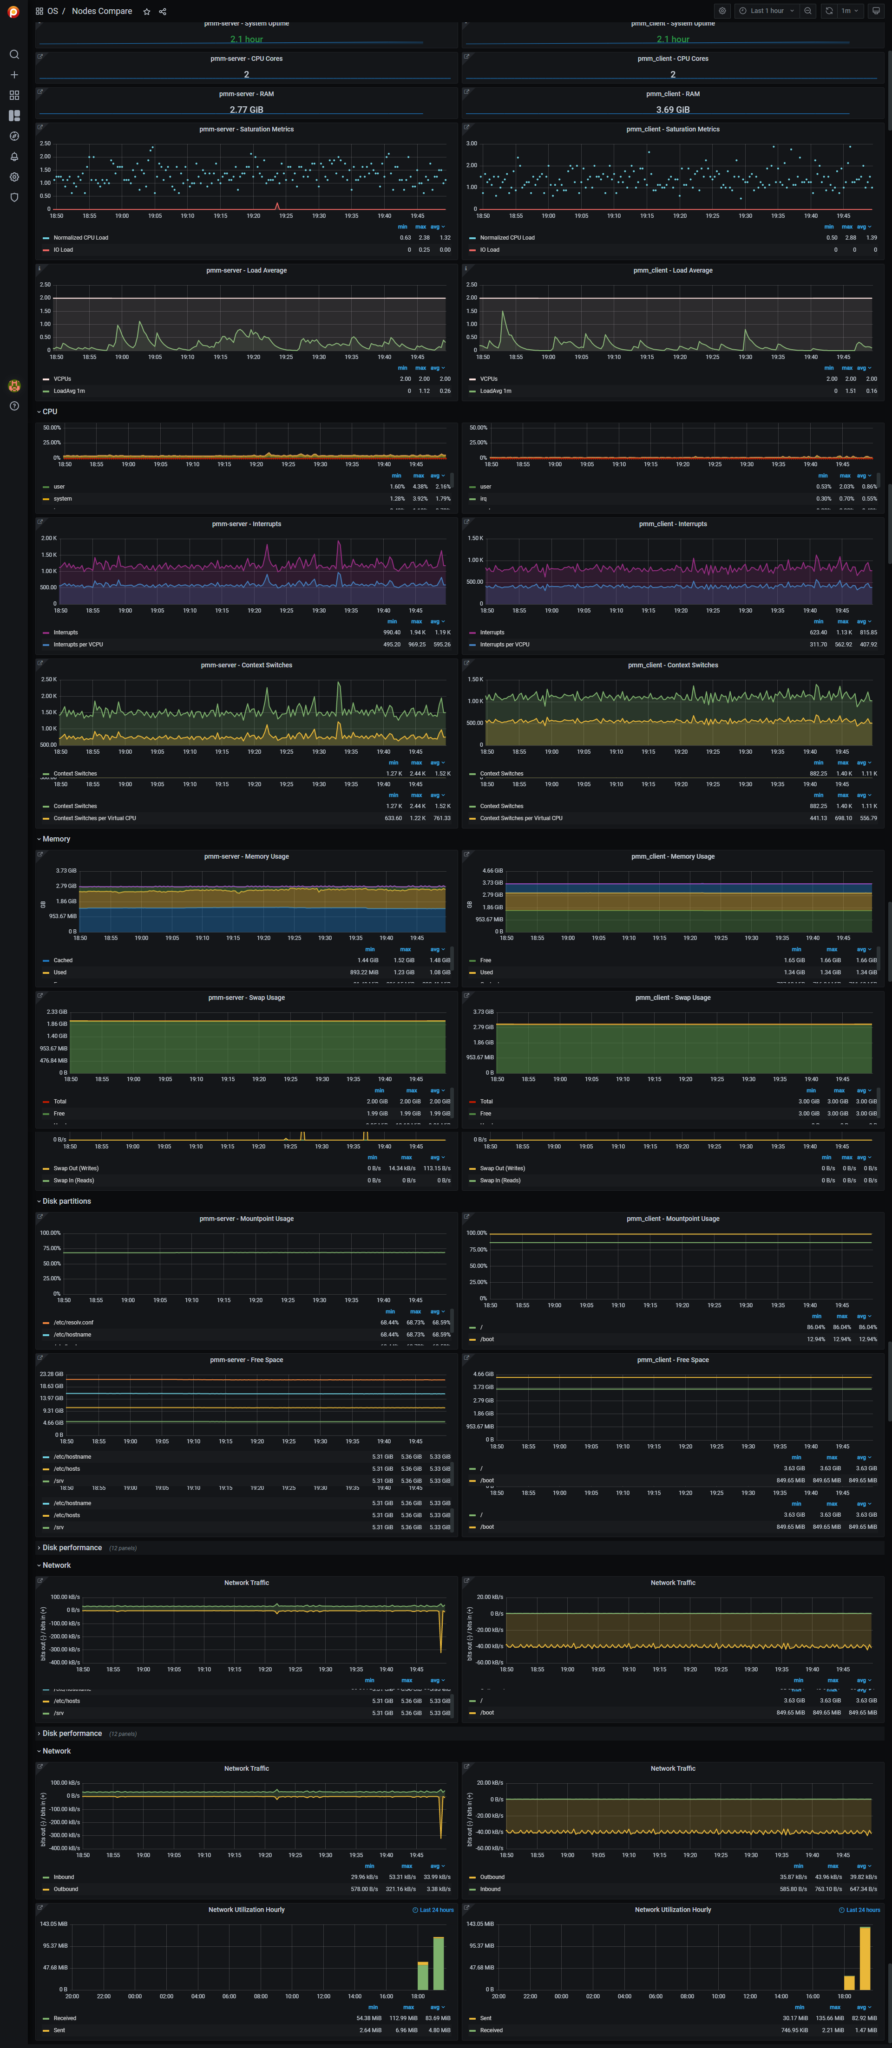
We have also the possibility to compare several nodes:
– MySQL Summary
It’s one of the MySQL dashboards which displays general metrics about our instance (uptime, version, InnoDB Buffer Pool size, connections, threads, table locks, traffic, and much more):
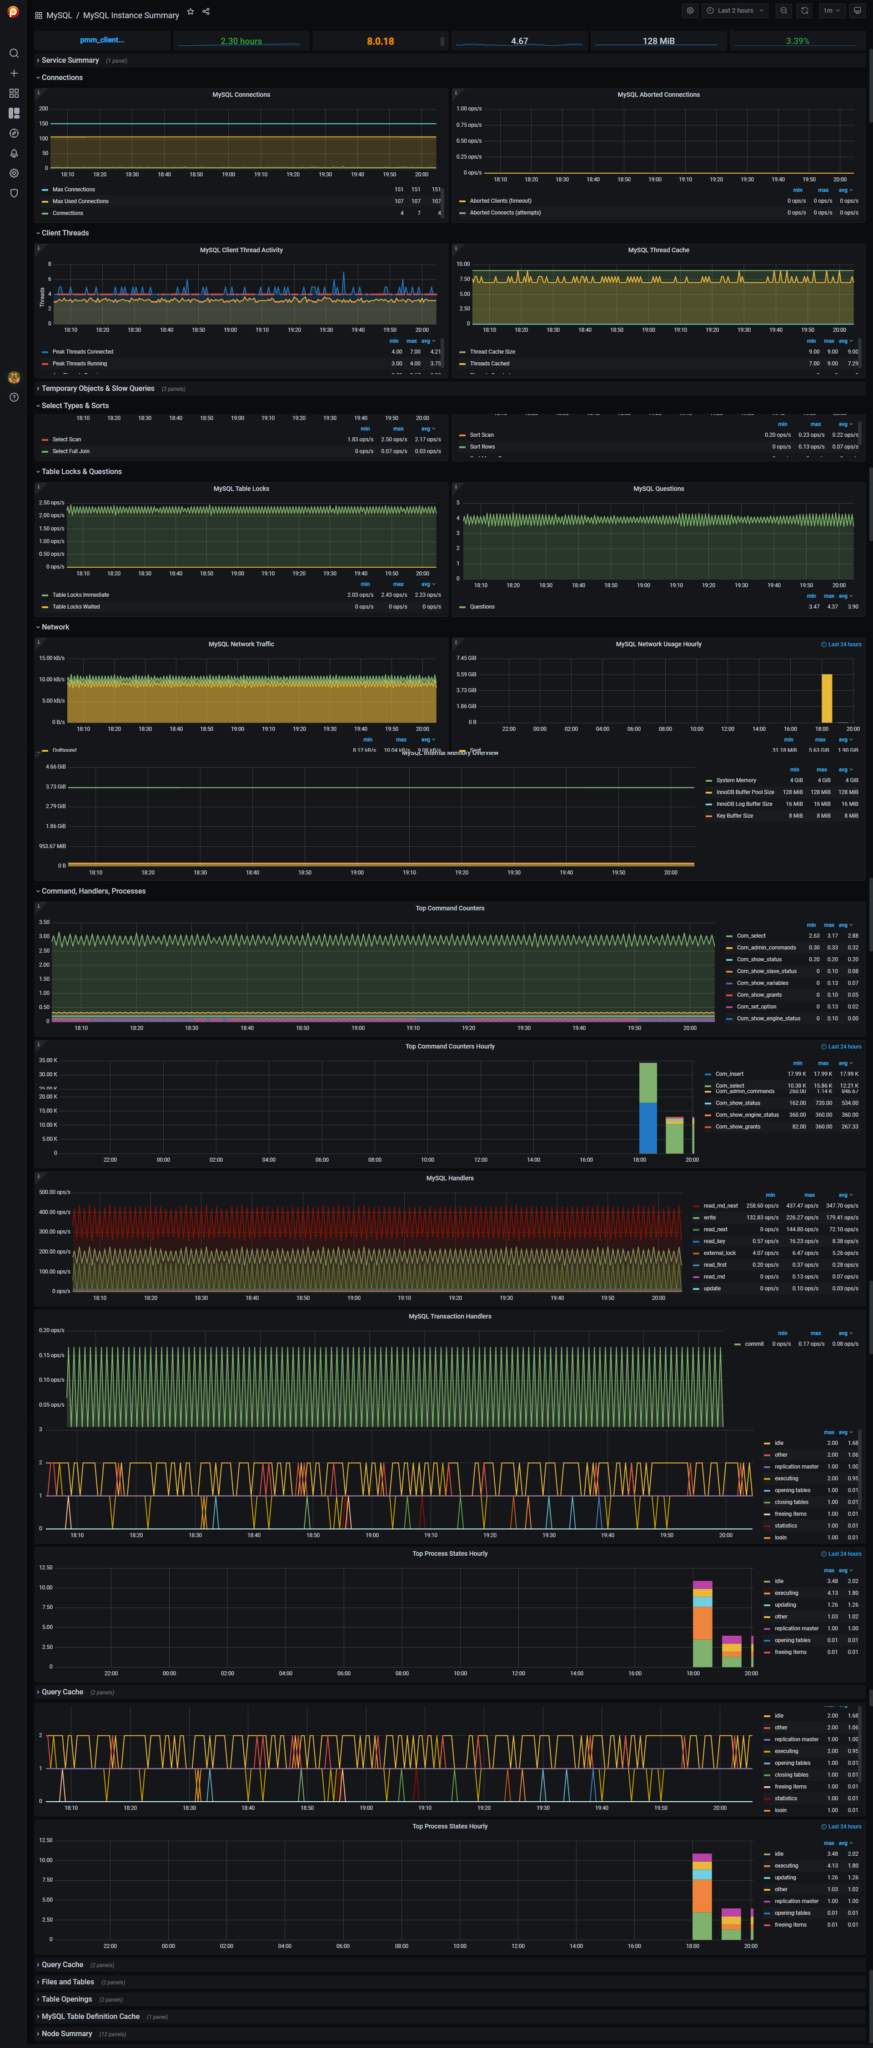
And we still have the option to compare different instances.
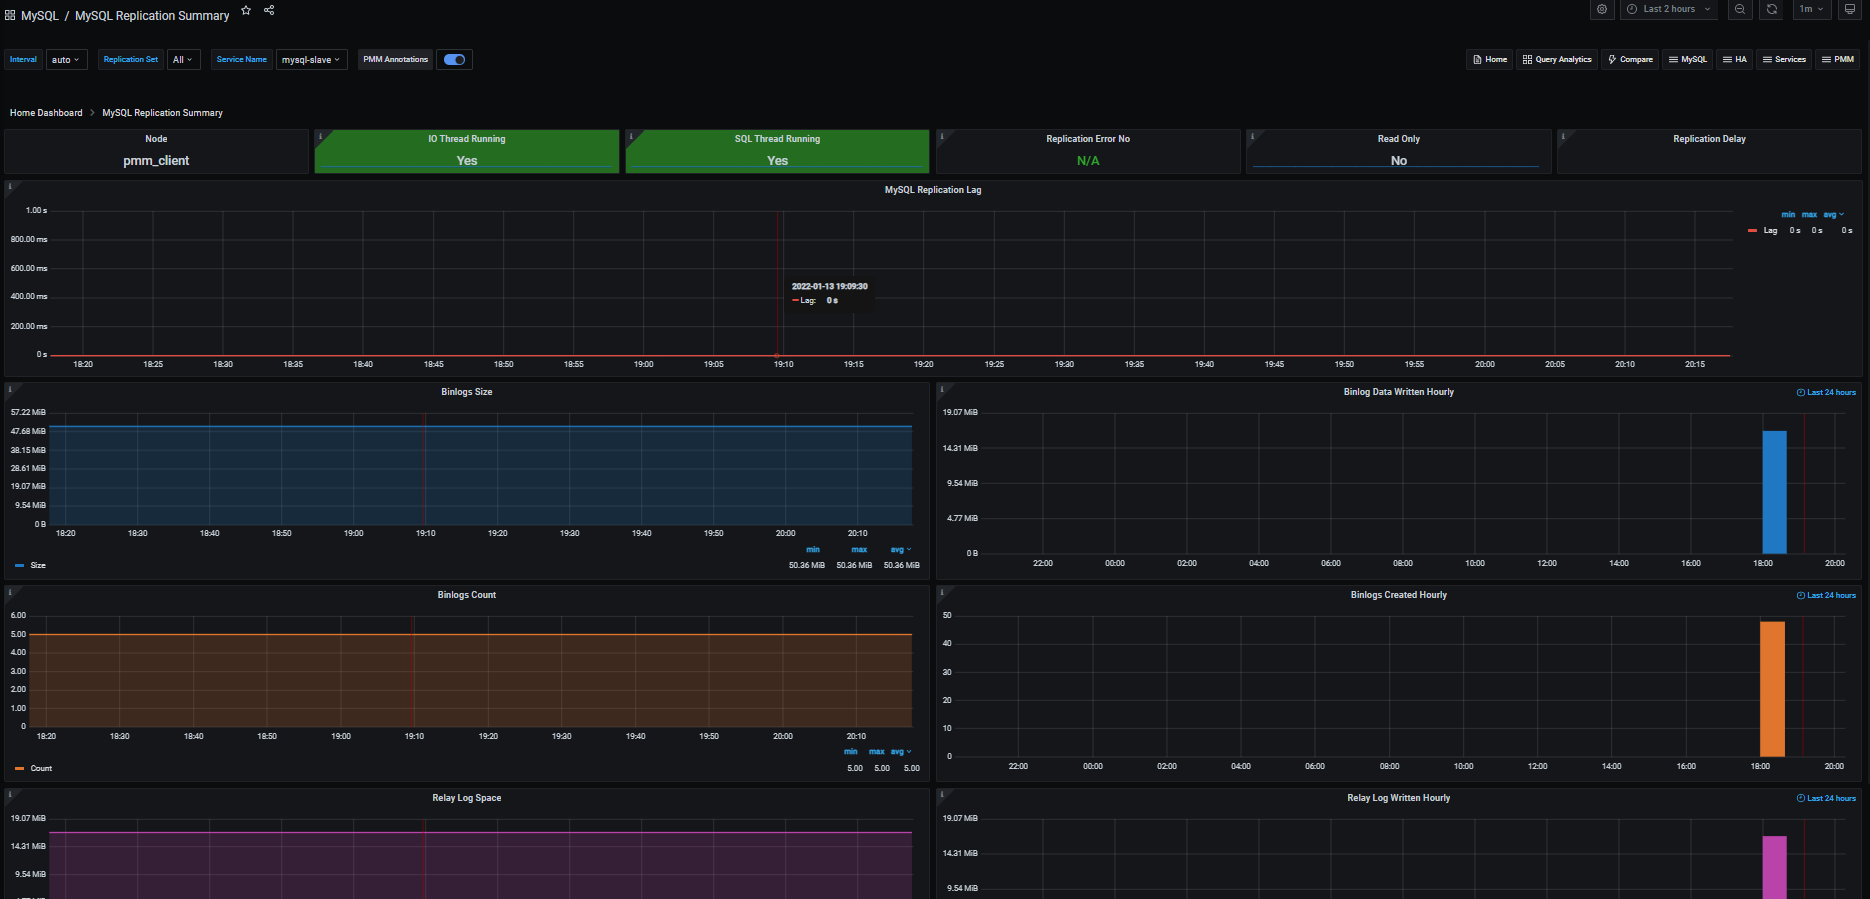
– MySQL Replication
It’s the dashboard which offers us an overview on the MySQL Master-Slave Replication:
– Query Analytics
QAN is a special dashboard that allows us to analyze MySQL and PostgreSQL databases queries over time:
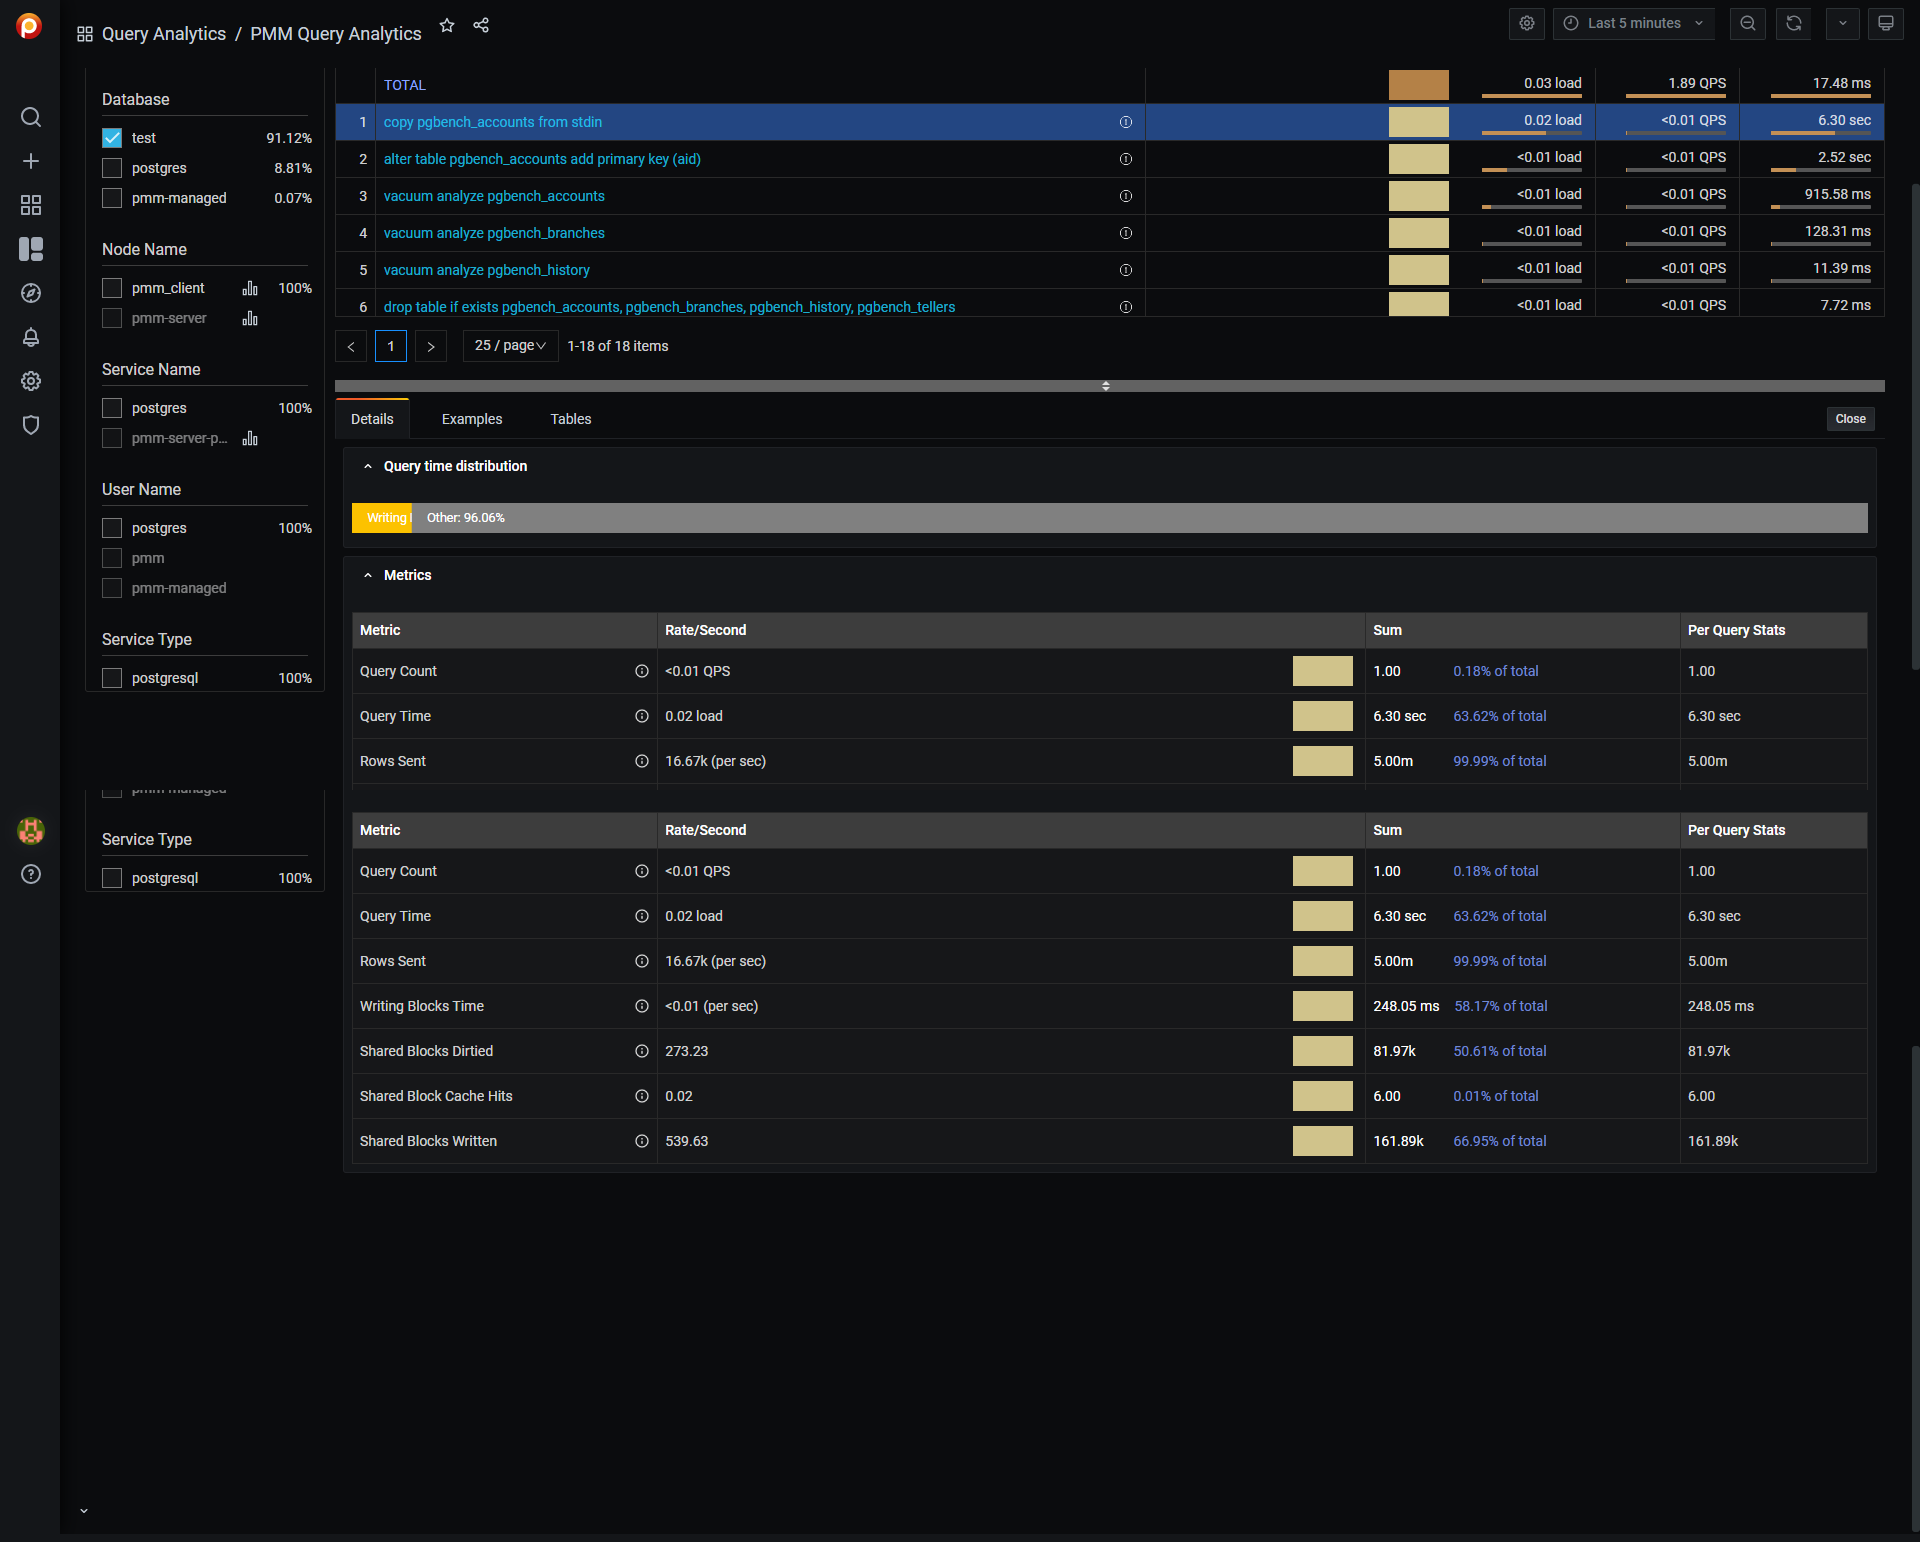
This can be very useful to identify performance problems.
Coming soon

Currently the last PMM stable release is 2.25.0. As we told just above, the tool is evolving a lot, and nice features are already available in technical preview:
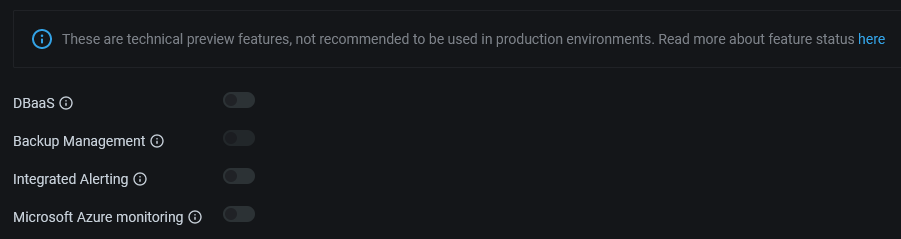
You can already play with that even if for the moment it’s not suggested to use them for production environments. I tested for example the Integrated Alerting and I cannot wait to have it available as a stable feature (we don’t need then anymore to configure an External Prometheus Alertmanager to be alerted if something goes wrong on our systems).
I hope you have enjoyed this introduction to PMM.
Now it’s up to you: don’t hesitate to test it! For my part, I will surely write again about PMM, so stay tuned! 🙂
![Thumbnail [60x60]](https://www.dbi-services.com/blog/wp-content/uploads/2022/10/ELU_web-min-1-scaled.jpg)
![Thumbnail [90x90]](https://www.dbi-services.com/blog/wp-content/uploads/2022/08/STH_web-min-scaled.jpg)
![Thumbnail [90x90]](https://www.dbi-services.com/blog/wp-content/uploads/2022/11/TBR-web-min-scaled.jpg)
![Thumbnail [90x90]](https://www.dbi-services.com/blog/wp-content/uploads/2025/11/LTO_WEB.jpg)
![Thumbnail [90x90]](https://www.dbi-services.com/blog/wp-content/uploads/2023/01/APY_web-scaled.jpg)