
Among the hidden features provided by SQL Server 2014 there is a very interesting dynamic management view named sys.dm_exec_query_profiles. This feature will help the database administrators and experienced developers to troubleshoot long running queries in real-time. I’m pretty sure you had to deal with the following questions: When will this query finish? What percentage of total workload is performed by this request? Which steps are the longest? Before SQL Server 2014 it was impossible to answer the questions above!
But first, I have to admit that this new DMV has raised of lot of questions during my tests. I will try to share my thoughts and findings with you in this post.
My test consisted of running this long query:
On my computer this query takes 05’’47’ to run. The parallelism is enabled. My SQL Server instance can use up to 8 processors. The first time I was disappointed by viewing the output of the sys.dm_exec_query_profiles DMV during my query execution:
![]()
… No output! Ok what are we supposed to do to see something with sys.dm_exec_query_profiles ? 😀 Keep good habits and go back to the SQL Server BOL that says:
To serialize the requests of sys.dm_exec_query_profiles and return the final results to SHOWPLAN XML, use SET STATISTICS PROFILE ON; or SET STATISTICS XML ON;
In other words, to have a chance to see something with this DMV we must use some session options like STATISTICS PROFILE, STATISTICS XML or force SQL Server to display the execution plan after execution query with SQL Server Management Studio. My first though was: why do we have to use some additional options to produce some output for this new DMV? These constraints severely limit the scenarios where we can use this DMV … After some reflexions and discussions with others French MVPs we can think that is normal because tracking the execution plan information is expensive and we could potentially bring a production server to its knees by enabling this feature for all the workload statements. But using additional session options can be impractical in production environments because it requires to execute itself the concerned query and it is not always possible. Fortunately Microsoft provides the query_post_execution_showplan event which can be used into a SQL Server trace or an extended event session. But the implementation design of this event has a significant impact to the performance of a SQL Server instance. Indeed, even with a short-circuit predicate this event will be triggered each time a SQL statement will be executed because the query duration is not known ahead of time (please refer to this Microsoft connect item). To summarize, using this event in OLTP production environment should be used in a short period for troubleshooting purposes. In OLAP environment the story is not the same because we don’t have to deal with a lot of short queries but only with long running queries issued by cube processing or ETL processes for example.
After discussing the pros and cons of this new feature let’s start with my precedent T-SQL statement and the use of the session option: SET STATISTICS PROFILE ON
In other session:
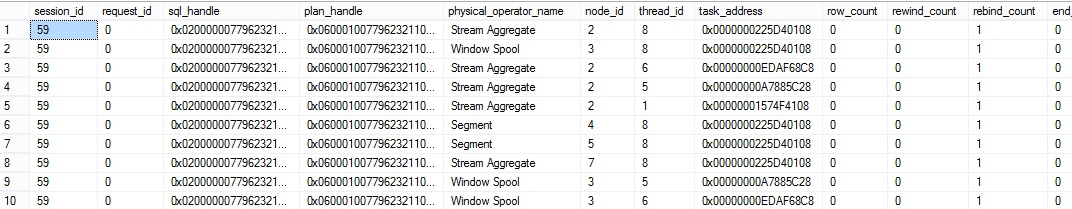
This DMV provides a lot of useful information. These information are more granular than SET STATISTICS IO because the counters returned are per operator per thread (node_id / physical_operator_name and thread_id columns). In my case the SQL Server instance can use up to 8 processors and we can notice that for some operators (node_id) we have several threads using in parallel (thread_id). Furthermore two others columns are interesting like estimate_row_count and row_count. The former is the number of estimated rows an operator should address and the latter is the current number of rows addressed by the same operator (remember these counters are per operator per thread …). We can compare these two columns to estimate a completion percentage per operator (or per operator per thread). Finally we can categorize some information provided by this DMV in two parts: information related either to the query execution engine (row_count, estimated_row_count) or the storage execution engine (logical_read_count, write_page_count, lob_logical_read_count etc.)
As you can see, this DMV provide a lot of information to us and you will certainly customize the final output yourself depending on what you want to focus on.
Here is an example of a custom script we can create that uses the sys.dm_exec_query_profiles, sys.objects, sys.indexes, sys.dm_exec_requets, sys.dm_exec_sessions, and sys.dm_os_waiting_tasks to cover both the real-time execution information and the related waits occurring in the same time.
The first section of the above script concerns the general information:
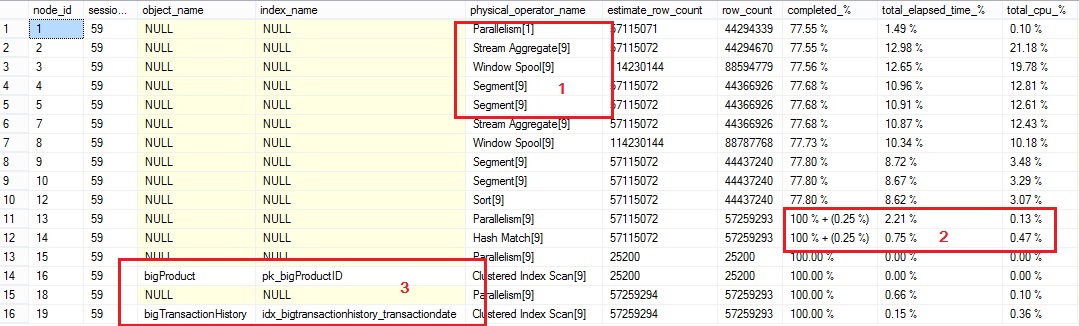
- This above script groups the information per operator. The information in brackets is the number of thread used for the concerned operator.
- Completion is provided as a ratio between rows addressed by the corresponding operator so far and the total estimated rows. As we can expect, the estimated rows and the real rows addressed by an operator can differ. The above script highlights this gap by showing the difference in percentage between brackets if row_count is greater than estimated_row_count. This information can be useful to “estimate” the general completion of the query.
However Total_elasped_time_% and total_cpu_% columns are the relative percentage of the elapsed time and cpu time consumed by all the query execution operators.
3. For some physical operators like Clustered Index Scan, Table Scan etc … we will show the related table and index objects
The second section concerns the storage engine statistic for the query execution:
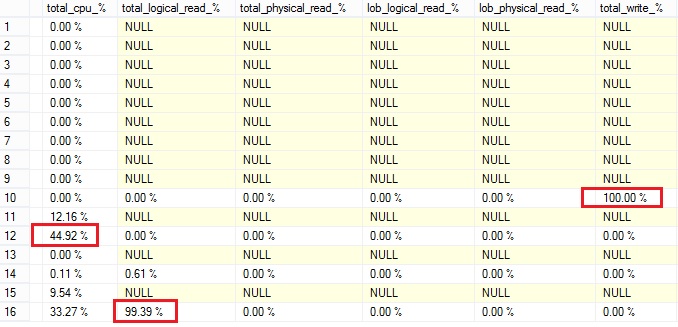
The above information can be useful to highlight the top operators depending on the resource or the operation type. For example, in my case I can notice that the cluster index scan of the bigTransactionHistory table is the main consuming physical operator for logical reads. Furthermore, we can observe that the sort operator is the root cause of spilling. Finally as expected we can notice that by design hash match operator consumes a lot of CPU and it’s the top operator in this case.
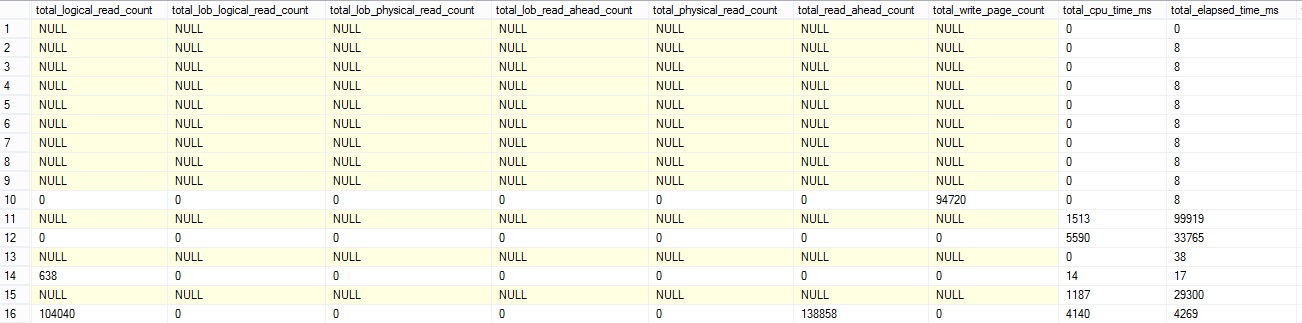
The next section shows the absolute values per operator per type of resources and operation:
Finally the last section shows the wait types and aggregated duration by all related threads in brackets during the query execution in a real time:
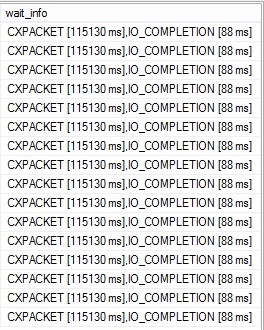
In my case we retrieve the wait type related to a query execution in parallel (CXPACKET) and certainly one of the root cause of the CXPACKET wait type (IO_COMPLETION) but here we don’t have sufficient information to verify it. We can just notice that the query execution generates CXPACKET and IO_COMPLETION wait types in a real time.
At this point we can ask why we don’t have a remaining time information. In fact, computing an accurate remaining time is very difficult because a lot of factors must be correlated together. We can have a naive approach by computing the remaining time with the row_count, estimated_row_count and elapsed time columns for each operator, but you will be disappointed when testing this… According to my own tests, I can claim that the result is never as accurate as you would expect. Please feel free to share your results or thoughts about computing an accurate remaining time with us!
The sys.dm_exec_query_profiles DMV can be correlated by external tools like XPERF or Perfmon. I will prepare a next blog post (as soon as I have some time) to share my experience with you.
Happy query profiling!
By David Barbarin
![Thumbnail [60x60]](https://www.dbi-services.com/blog/wp-content/uploads/2022/12/microsoft-square.png)
![Thumbnail [90x90]](https://www.dbi-services.com/blog/wp-content/uploads/2022/09/DDI_web-min-scaled.jpg)