It is not always possible to install an exporter on the server or equipment you must monitor, either because you don’t administrate that server, or it cannot run an exporter (ie. device with limited resources).
For that purpose, two exporters were built to be able to get metrics and status remotely:
In this blog, I will focus on configuring and integrating the SNMP exporter.
Simple Network Management Protocol
SNMP is mostly used for monitoring network equipment’s like router, switch or modem which have limited resources. Because of the lack of resources, it is not possible to run an exporter on it and as Prometheus is not able to scrap SNMP agent, we must have something in between. That something is the SNMP exporter. As I do not have any SNMP equipment, I choose to run an SNMP simulator (snmpsim).
Setup the SNMP Exporter
The SNMP exporter will make the interface between SNMP agent and Prometheus. It will gather status and metrics based on request arguments received from Prometheus server. SNMP exporter can run on Prometheus server itself or another host. Starting exporter, as a docker container, is a one-liner:
docker run -p 9116:9116 --name snmp-exporter prom/snmp-exporter
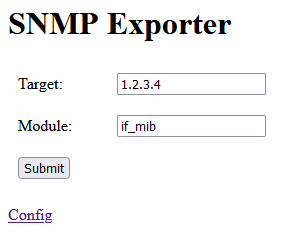
Let’s access the URL:

As you can see, scraping a SNMP host will require two arguments:
- target: obviously the IP running a SNMP agent
- module: the module as defined in snmp.yml (the SNMP exporter configuration)
For now, I will use if_mib to get metrics about network interfaces.
Before going to the next step, let’s git it a try by filling target IP and click submit. This is building a new URL and redirecting my browser to it http://localhost:9116/snmp?target=172.17.0.1&module=if_mib:
# HELP ifAdminStatus The desired state of the interface - 1.3.6.1.2.1.2.2.1.7
# TYPE ifAdminStatus gauge
ifAdminStatus{ifAlias="",ifDescr="eth0",ifIndex="2",ifName="eth0"} 1
ifAdminStatus{ifAlias="",ifDescr="lo",ifIndex="1",ifName="lo"} 1
# HELP ifConnectorPresent This object has the value 'true(1)' if the interface sublayer has a physical connector and the value 'false(2)' otherwise. - 1.3.6.1.2.1.31.1.1.1.17
# TYPE ifConnectorPresent gauge
ifConnectorPresent{ifAlias="",ifDescr="eth0",ifIndex="2",ifName="eth0"} 1
# HELP ifCounterDiscontinuityTime The value of sysUpTime on the most recent occasion at which any one or more of this interface's counters suffered a discontinuity - 1.3.6.1.2.1.31.1.1.1.19
# TYPE ifCounterDiscontinuityTime gauge
ifCounterDiscontinuityTime{ifAlias="",ifDescr="eth0",ifIndex="2",ifName="eth0"} 0
ifCounterDiscontinuityTime{ifAlias="",ifDescr="lo",ifIndex="1",ifName="lo"} 0
# HELP ifHCInBroadcastPkts The number of packets, delivered by this sub-layer to a higher (sub-)layer, which were addressed to a broadcast address at this sub-layer - 1.3.6.1.2.1.31.1.1.1.9
# TYPE ifHCInBroadcastPkts counter
ifHCInBroadcastPkts{ifAlias="",ifDescr="eth0",ifIndex="2",ifName="eth0"} 27475
ifHCInBroadcastPkts{ifAlias="",ifDescr="lo",ifIndex="1",ifName="lo"} 27483
[...]
It looks like a usual Prometheus metrics format.
Prometheus Configuration
Now, it is time to declare a new scraper job by adding the yaml below in prometheus.yml under scrape_configs:
  - job_name: 'snmp'
    static_configs:
      - targets:
        - 172.17.0.1 # SNMP device.
    metrics_path: /snmp
    params:
      module: [if_mib]
    relabel_configs:
      - source_labels: [__address__]
        target_label: __param_target
      - source_labels: [__param_target]
        target_label: instance
      - target_label: __address__
        replacement: 172.21.111.123:9116  # The SNMP exporter's real hostname:port.
In Prometheus, each metric has one or multiple labels for identifying the source of it and easier filtering. In this example, as a single SNMP exporter can scrap multiple SNMP targets, we must set labels (ie. relabel) dynamically based on which host it is currently scrapped. What is static will be under params node like module=if_mib.
Keep in mind that relabel_configs are applied before scrapping metrics.
Target Parameter
First URL parameter will be the target=172.17.0.1. For that, I am using internal label __param_target, where target will be the name of the parameter in the url and the value will be __address__ (ie. 172.17.0.1). This is line 9 and 10.
Relabeling Instance
Line 11 and 12 are required for instance label to be properly populated. Let’s compare what would happen if we omitted these lines. If we query ifAdminStatus{ifName="eth0"}, we will have this result:
ifAdminStatus{ifDescr="eth0", ifIndex="2", ifName="eth0", instance="172.21.111.123:9116", job="snmp"}
instance contains the IP/port of the scraped host which is the SNMP exporter IP whereas we want the final target information in that field. This is even more important if you scrap multiple SNMP hosts as all metrics will have same instance field, preventing you to really know from which host metric comes from. So, to avoid that, line 11 and 12 are relabeling instance by overwriting content of instance with __param_target. Let’s add these lines back and check what is query result:
ifAdminStatus{ifDescr="eth0", ifIndex="2", ifName="eth0", instance="172.17.0.1", job="snmp"}
Actual Target
__address__ is a label reserved for Prometheus that is used the actual target that is scraped. Without line 13 and 14, Prometheus will try to scrap SNMP Agent IP which will obviously not work. Just to give it a try, I commented out both lines. In the target menu of Prometheus, I can see the endpoint in down with error message:
Get "http://172.17.0.1:80/snmp?module=if_mib&target=172.17.0.1": dial tcp 172.17.0.1:80: connect: connection refused
Conclusion and what’s next?
Relabeling is an important and powerful feature which is also used for blackbox exporter. In this blog, we covered the aim of all 3 labels defined in SNMP job. Next, Prometheus will store results and Grafana could query them.
![Thumbnail [90x90]](https://www.dbi-services.com/blog/wp-content/uploads/2022/09/DDI_web-min-scaled.jpg)
![Thumbnail [90x90]](https://www.dbi-services.com/blog/wp-content/uploads/2025/05/JDE_Web-1-scaled.jpg)
msaeed
11.04.2024Hi
Thanks for providing the guide
Just quick question
Which module we can use to get CPU and memory metrics via SNMP exporter as if_mib doesn't provide those.
Kind Regards
Mehran
Hello Mehran,
IF_MIB is specific to interfaces metrics and mainly for network switches/routers. For host related metrics, you can have a look at RFC 2790 MIB.
Regards,
Olivier