Introduction:
Monitoring our Redis database is one of the first thing we want to do : Checking the database status , the queries consumption and also make a report on it.
For that, we will use Grafana:
It is an open source analytics & monitoring solution for every database.
Grafana can add some plugins to work on a specific database.I guess you have understood that the today’s topic is to add a Redis plugin to Grafana in order to have some dashboard and graphs.
What is Grafana?
Grafana is a free software application licensed under the GNU Affero General Public License Version 32 (formerly under the Apache 2.0 license until April 2021)
It enables data visualisation.
It can be used to create dashboards and graphs from a number of sources, including temporal databases such as Graphite, InfluxDB and OpenTSDB.
How to install Grafana
You have many ways to install this tool and it is supported on many operating systems:
Below you will have the list of the operating systems ( I will probably make another post to go deeper in details )
- Debian or Ubuntu
- RHEL or Fedora
- SUSE or openSUSE
- Grafana Docker image
- Grafana on Kubernetes
- macOS
- Windows
As we have many installation choices, we will review that later in a incoming Blog.For this post I have chosen the Docker images method.
Run Grafana Docker image
This installation will be made in two steps:
- We will see how to install the Grafana image on Docker
- We will see how to add our famous Redis plugin ( it is possible to run directly the Grafana image containing also the Redis plugin! )
Grafana docker image
Grafana Docker images come in two editions:
- Grafana Enterprise:
grafana/grafana-enterprise - Grafana Open Source:
grafana/grafana-oss
For my case I have chosen the Grafana Open source Image
Docker useful commands for your grafana container
To run the latest stable version of Grafana, run the following command:
docker run -d -p 3000:3000 --name=grafana grafana/grafana-enterprisedocker run -d -p 3000:3000 --name=grafana grafana/grafana-oss- Stop the Grafana container
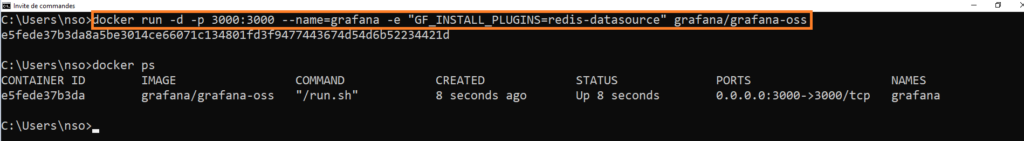
Use the docker ps command to show the processes running in Docker:
C:\Users\nso>docker ps

CONTAINER ID IMAGE COMMAND CREATED STATUS PORTS NAMES
e5fede37b3da grafana/grafana-oss "/run.sh" 8 seconds ago Up 8 seconds 0.0.0.0:3000->3000/tcp grafana
To stop the container use the command docker stop:
- docker stop CONTAINER-ID or use
- docker stop NAME, here it is
grafanaas previously defined
C:\Users\nso>docker stop grafana

grafana
Additional docker recommended actions
Additional actions are recommended ( we will not describe it now but it can be a topic for next time ) such as:
- Save your Grafana data
- Use Docker volumes
- Use bind mounts
- Use environment variables to configure Grafana
Run Grafana image with the Redis plugin
Install plugins in the Docker container
“You can install plugins in Grafana from the official and community plugins page or by using a custom URL to install a private plugin.
These plugins allow you to add new visualization types, data sources, and applications to help you better visualize your data.”
Grafana currently supports three types of plugins: panel, data source, and app.
For more information on managing plugins, refer to Plugin Management.
Extract from grafana official site
About Redis plugin
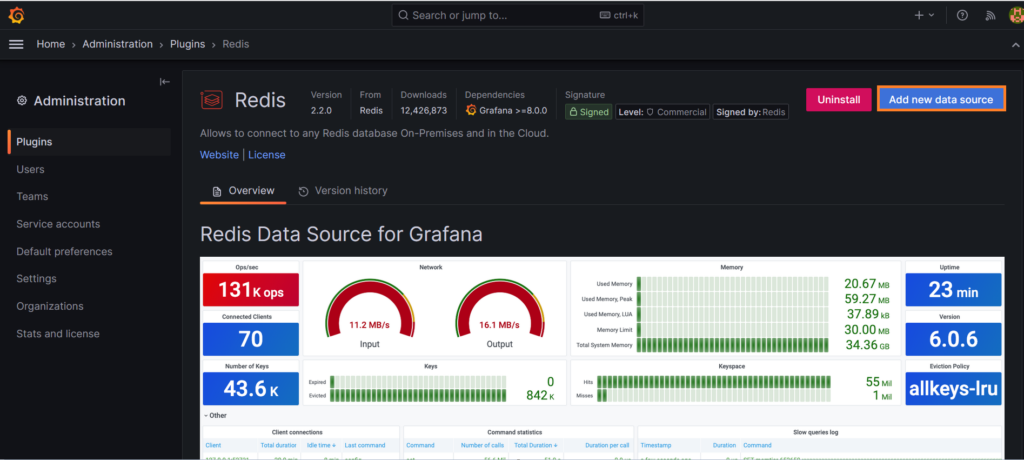
The Redis Data Source for Grafana allows users to connect to any Redis database On-Premises and in the Cloud.
It provides out-of-the-box predefined dashboards and lets you build customized dashboards to monitor Redis and application data.
Redis plugin requirements
- Grafana 8.0+ is required for Redis Data Source 2.X.
- Grafana 7.1+ is required for Redis Data Source 1.X.
Redis Application plugin
You can add as many data sources as you want to support multiple Redis databases. Redis Application plugin helps manage various Redis Data Sources and provides Custom panels.
Redis Explorer plugin
The Redis Explorer plugin connects to Redis Enterprise software clusters using REST API. It provides application pages to add Redis Data Sources for managed databases and dashboards to see cluster configuration.
Run the Redis plugin
Use the following command to run the Grafana image with the Redis plugins inside:
C:\Users\nso>docker run -d -p 3000:3000 --name=grafana -e "GF_INSTALL_PLUGINS=redis-datasource" grafana/grafana-ossHere we have added the plugin name ” redis-datasource” to the image “grafana-oss”
Open Grafana
Now you have launched the Garfana image, we will check if the plugin is here:
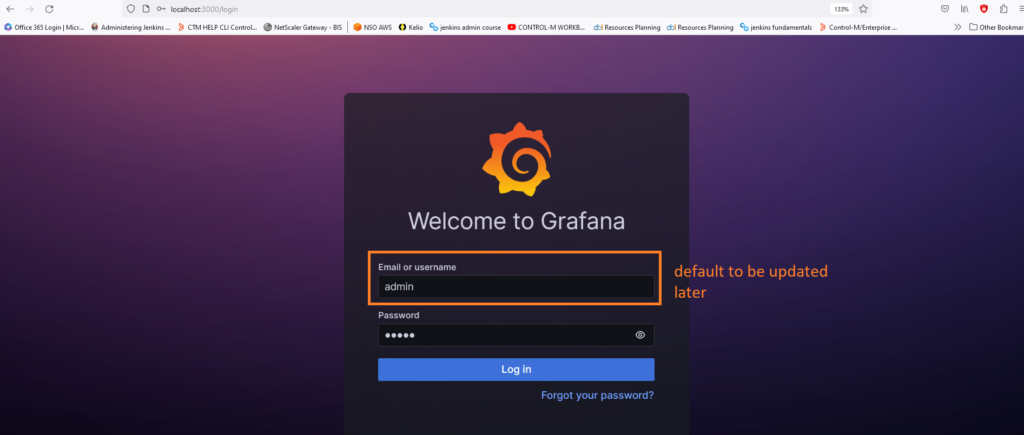
- Open an url to your address using port 3000
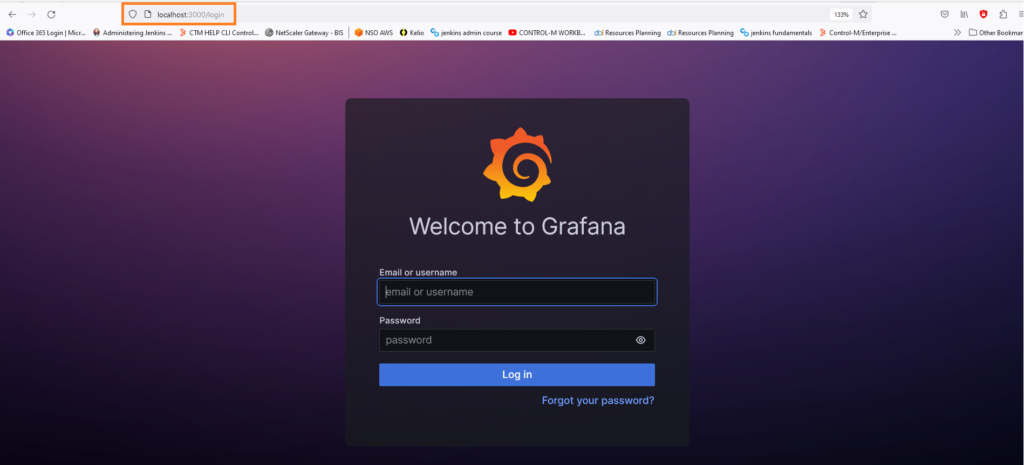
- Enter the default user and password ( admin , admin )
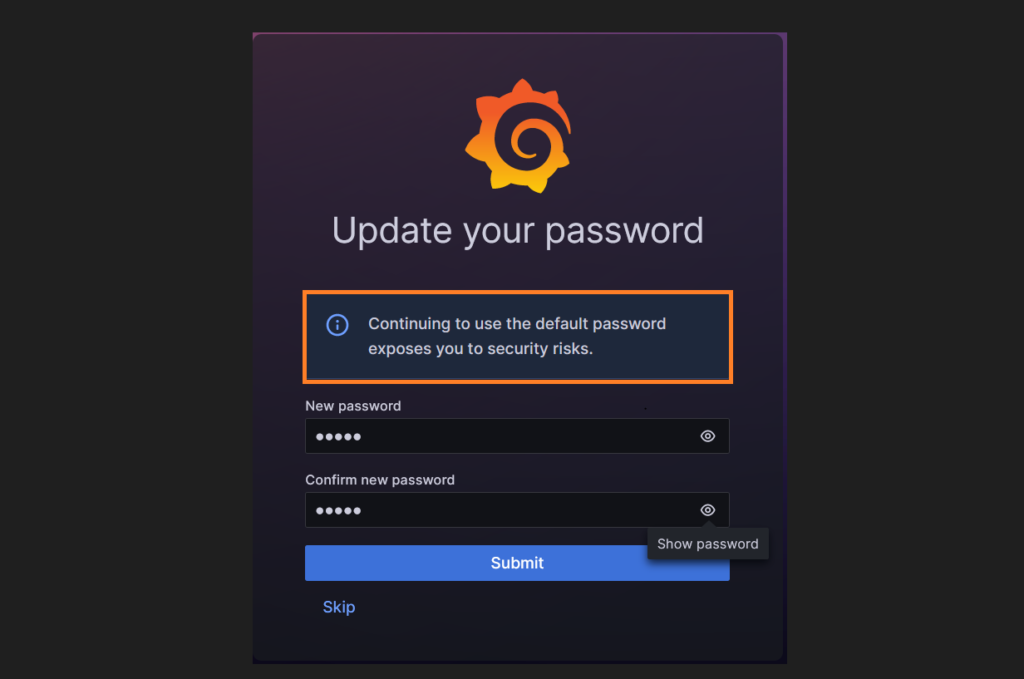
- When done it will be asked you to update the password for security matters
Connect your database
- On Grafana select home/connections/data sources
Configure your Redis plugin
- Go to home/administration/plugins
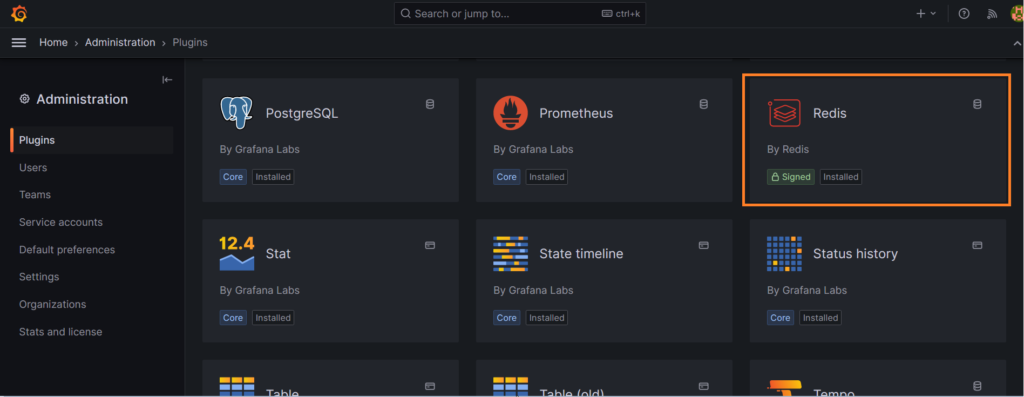
We see that some plugins are installed by default and other can be added , here Redis plugin installed and signed.We will open it and see what it is possible to do with it.
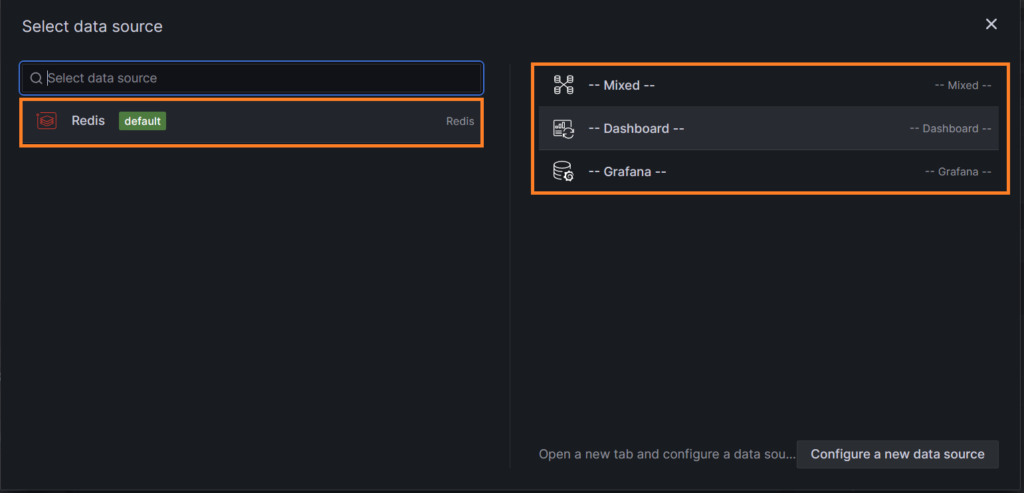
- Open Redis plugin
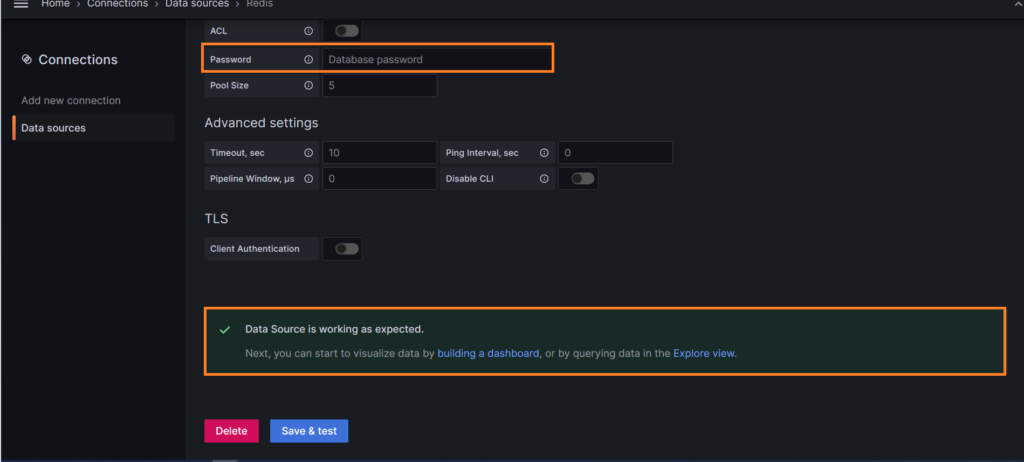
- Add your data source
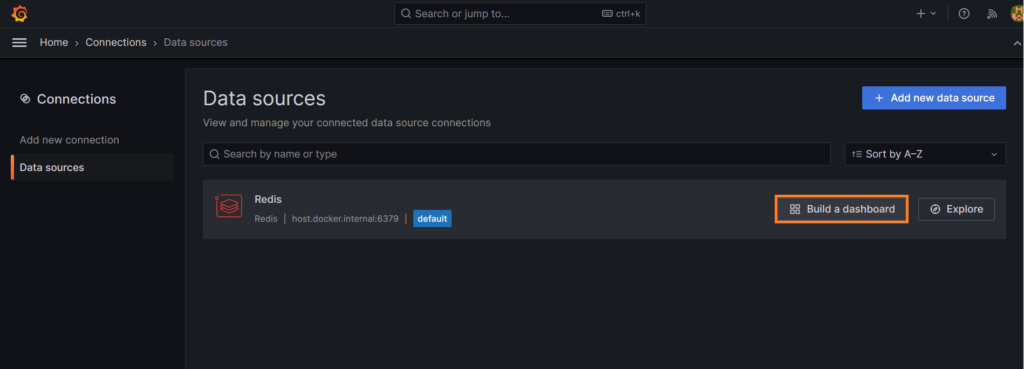
- You have the choice to explore or to build a new dashboard, let’s try it
- you have now the choice to add a visualization ( you are also able to import dashboard or add a library panel )
- Go to Home/Dashboards/ New dashboard and select “Add visualization”
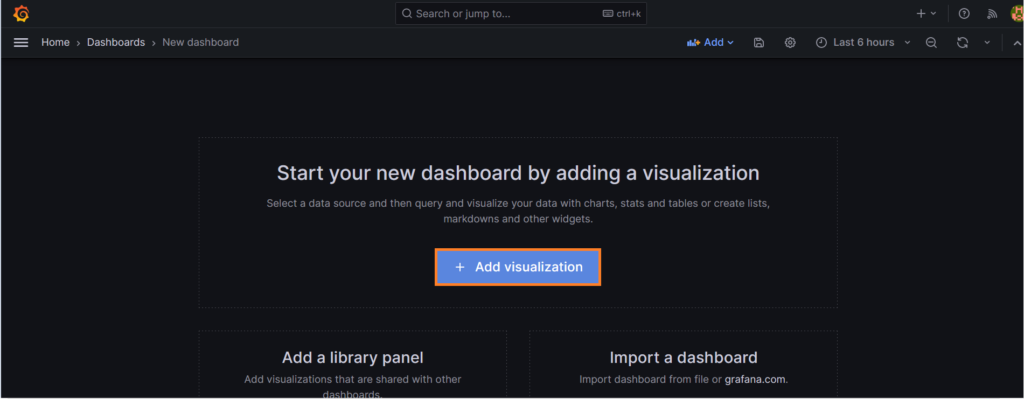
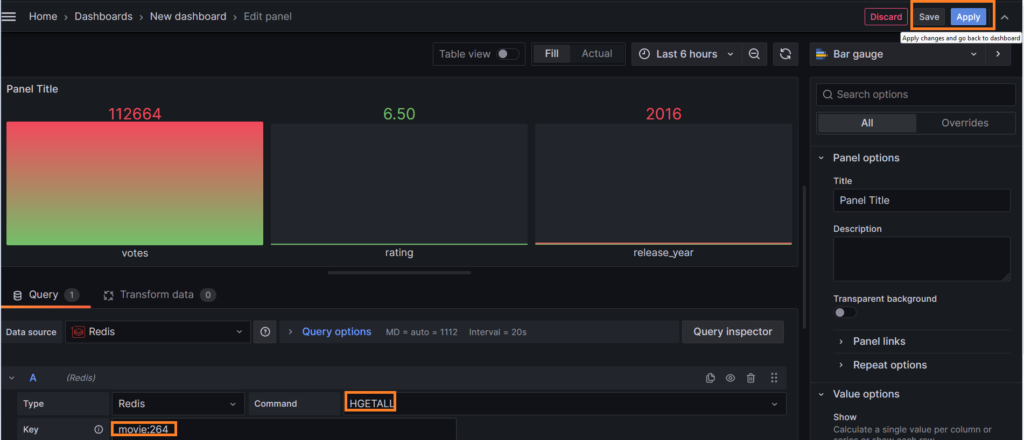
- Now we can chose how to display our results
- Select the display for example time series, a table or a Bar chart
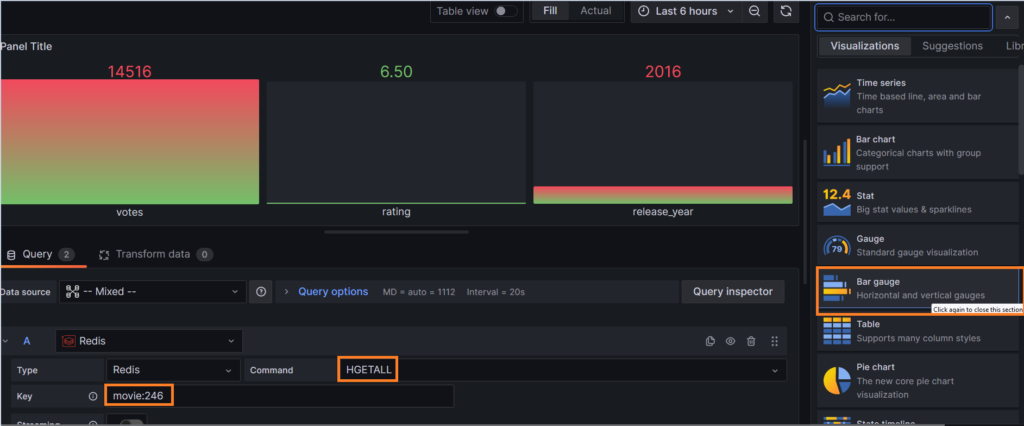
In the command part, you can use the Redis commands to interact with your database and of course the related keys.
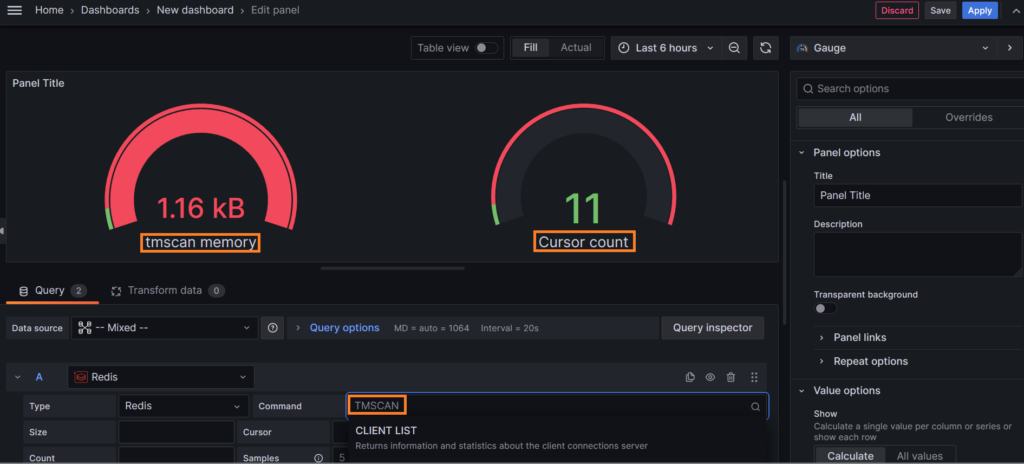
- Another example here with another display with a Gauge:
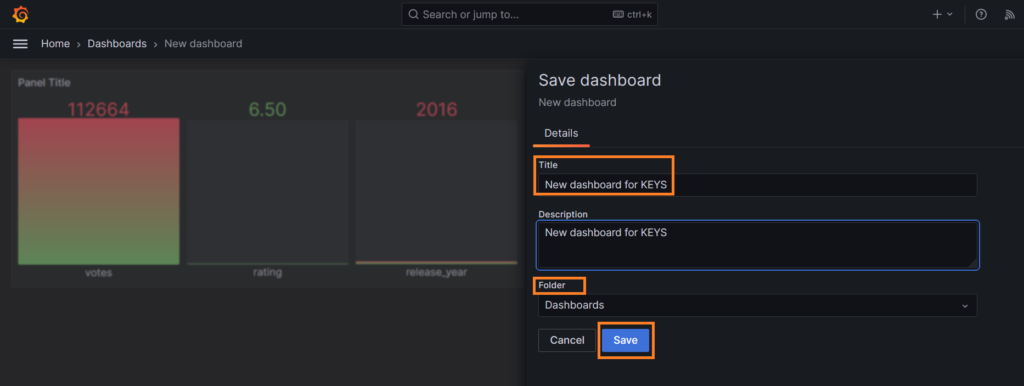
Save your dashboard
- Once your dashboard is ready you click on apply and save
- Give a name to your dashboard and save it
Load your dashboard
You can now load your presets and see your saved dashboards
- Go in home/dashboards
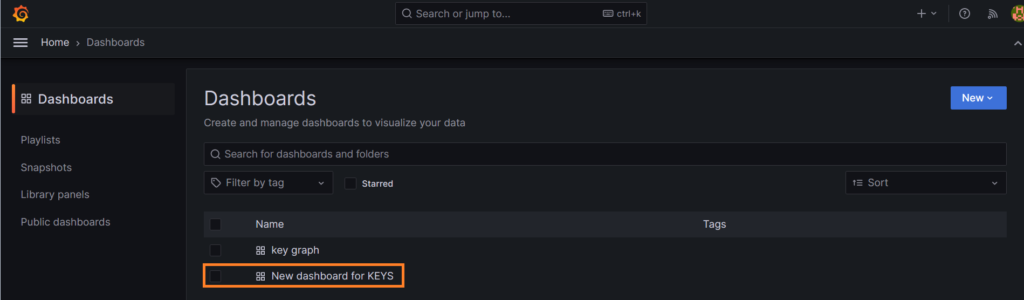
That’s is you know how to create your own dashboard!
Conclusion
Now you know how to use Grafana to work with your Redis database.You can download the plugin by some other ways, we can see that another time if you need it.
I hope you enjoyed this blog and you have tested it on your own side.
I will prepare a troubleshooting post for this Grafana plugin installation in order to avoid you some issue I have faced 😀
Stay tuned for next posts, you can also check my previous ones and also the dbi bloggers.
And of course don’t hesitate to take a look on the Grafana official site which is extremely well documented !
![Thumbnail [90x90]](https://www.dbi-services.com/blog/wp-content/uploads/2025/05/JDE_Web-1-scaled.jpg)