
In a previous blog entry, I started to share some Tips & Tricks about the installation and configuration of some QlikView components/software. I will try to complete this list with some other interesting things to know. On this blog entry, I will try to explain how to enable the Task Performance Summary, to debug or at least enable the Communication with Salesforce and how to install the QlikView Management Console Connector (QlikView Management API).
For the whole blog entry, let’s define the following values:
- %SYS_PROFILE% = C:/Windows/System32/config/systemprofile
- %QV_SRV_HOME% = D:/Apps/QlikView Server (defined during the QlikView Server installation)
- %DS_DATA_HOME% = D:/QlikView/DistributionService (defined in the QMC: System ˃ Setup ˃ Distribution Services ˃ QDS@hostname ˃ General ˃ Settings for QDS ˃ Application Data Folder)
- %PROXY_HOST% = your-proxy-url.domain.com
- %PROXY_PORT% = 11210
- %PROXY_PORT_S% = 11211
- %HOST_FQDN% = your-qlikview-hostname.domain.com
- %HOST_IP% = 160.160.20.20
- %HOST_ALIAS% = qlikview-alias.domain.com
- %QV_GRPS% = QV_GRP_SUP + QV_GRP_DEV + QV_GRP_ADM (some groups for QlikView, all under the domain “DOMAIN”)
- %QV_SYS_USER% = QV_SYS_USER (the “DOMAIN” user under which QlikView is running)
Each time you will see one of these parameters or values in the text below, don’t forget to replace them with YOUR OWN values. I only associate them for an example and to help you to find a match in your environment.
I. Task Performance Summary
Introduced in QlikView 11.2 SR7 and disabled by default, the Task Performance Summary is a new feature of QlikView to analyse the performance of the Tasks (I’m sure you already understood that from the title!). This new feature simply launch a little benchmark during the execution of all tasks to record some useful data like:
- Name of the process that ran the task with its PID
- CPU used by the process (Average, Peak)
- CPU used by the Windows Server (Peak)
- Virtual RAM used by the process (Average, Peak)
- Virtual RAM used by the Windows Server (Peak)
- Physical RAM used by the process (Average, Peak)
- Physical RAM used by the Windows Server (Peak)
- Duration of the reload task
For debugging, performance analysis and performance improvements, it’s pretty cool to have this kind of information. Enable the Task Performance Summary is quite simple:
- Login to the Windows Server with any Administrator account
- Open the file: %SYS_PROFILE%/AppData/Roaming/QlikTech/QlikViewBatch/Settings.ini
- Add at the end: EnableQVBProcessSummary=1
- Add an empty line at the end of the file (VERY IMPORTANT: the last line MUST be an empty line)
- Open a command prompt as Administrator and execute the command: “%QV_SRV_HOME%/Distribution Service/qvb.exe”
- In the command prompt, execute another command: services.msc
- Restart all QlikView Services
- Open the folder: %DS_DATA_HOME%/TaskResults/
- Refresh the folder’s content until there is a new file created (if nothing new appears, force the execution of a QlikView Task)
- Open the last created xml file and check that inside there is a line which include CPU and RAM consumption
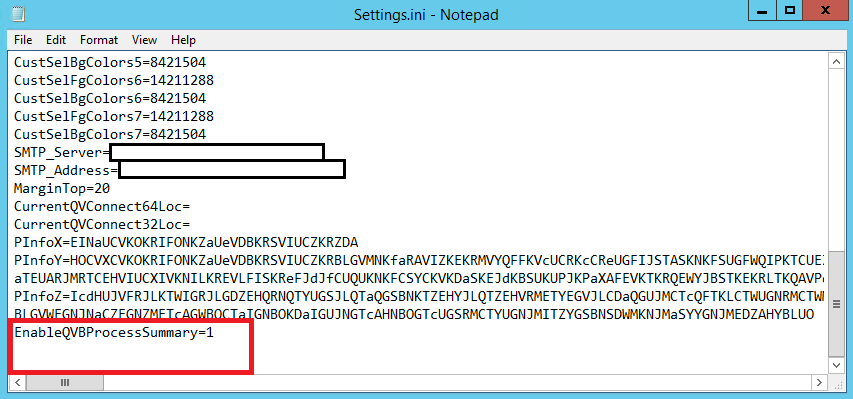 Modification of the Settings.ini file to enable the Task Performance Summary
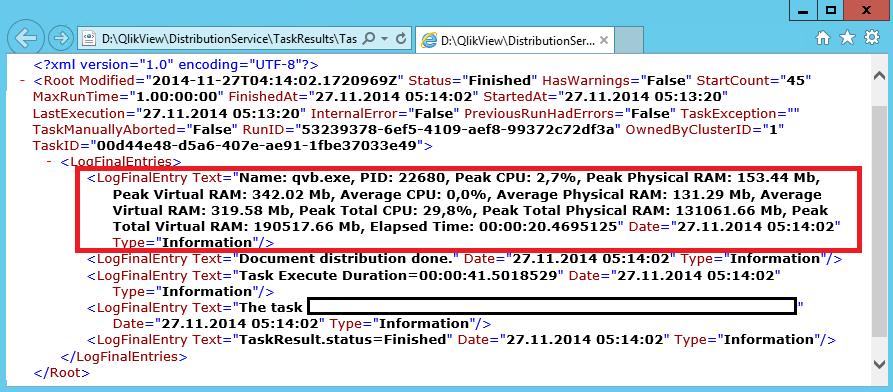 Line added in the TaskResults’ xml files by the Task Performance Summary
That’s it, the Task Performance Summary is now enabled and will record the performance of the future task’s executions.
II. Communication with Salesforce
If it’s your first time with the QlikView Salesforce Connector, then there is one thing that is essential to understand: the QlikView Salesforce Connector requires an internet access to work. To be more precise, the connector will have to be able to access to the Salesforce Website to retrieve some data models that will be used by QlikView for any communication with a Salesforce Data Source. Therefore, if your enterprise network uses a proxy or anything else to prevent or restrict the access to internet, then this will need to be fixed.
 Log file generated during a task execution when the proxy configuration isn’t done
 Log file generated during a task execution when the proxy configuration is properly done
On this section, I will just describe how to configure your Windows Server to allow the communication with the Salesforce Website by configuring the proxy settings:
- The QlikView Salesforce Connector must be properly installed
- Login to the Windows Server with the account under which QlikView is running
- Open: Internet Explorer ˃ Internet Options ˃ Connections ˃LAN settings
- Click on: Use a proxy server for your LAN
- Click on: Bypass proxy server for local addresses
- Click on: Advanced
- HTTP: Address = %PROXY_HOST%
- HTTP: Port = %PROXY_PORT%
- Secure: Address = %PROXY_HOST%
- Secure: Port = %PROXY_PORT_S%
- Exceptions = 127.0.0.1;localhost;%HOST_FQDN%;%HOST_IP%;%HOST_ALIAS%
- Click on: OK (3 times)
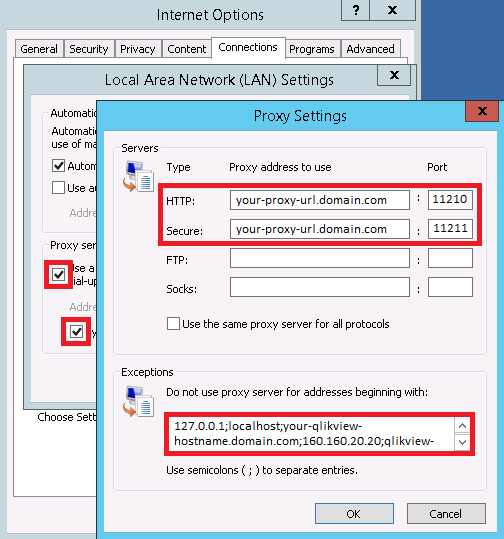 Configuration of the proxy in the Internet Explorer’s options
After this modification, the communication and therefore the reload of QlikView Documents using Salesforce as a Data Source should be successful.
III. QMC Connector
In QlikView by default, the license management through the QlikView Management Console is quite difficult… That’s why the QlikView Community is really active on this topic and some solutions have been developed to easily manage the QlikView licenses. The most common solution is to use the QMC Connector. This connector will use the QlikView Management API to manage a lot of things directly from a QlikView Document. The installation of this connector is quite easy:
- Download the QlikView Connector: QVSManager.zip
- Login to the Windows Server with any Administrator account
- Extract the QVSManager zip files into: C:/Program Files/Common Files/QlikTech/Custom Data/. This will create the folder “QVSManager” and in this folder, there should be 4 files
- Create a Windows local group:
- Open a command prompt as Administrator and execute: compmgmt.msc
- Open: System Tools ˃ Local Users and Groups ˃ Groups
- Create a new group with the following entries:
- Name = QlikView Management API
- Description = QlikView Management API
- Members = %QV_GRPS% + %QV_SYS_USER%
- Click on: Create
- Restart all QlikView Services
- Deploy the QlikView Document: QVSCALManager.qvw (I put it in a zip file for convenience)
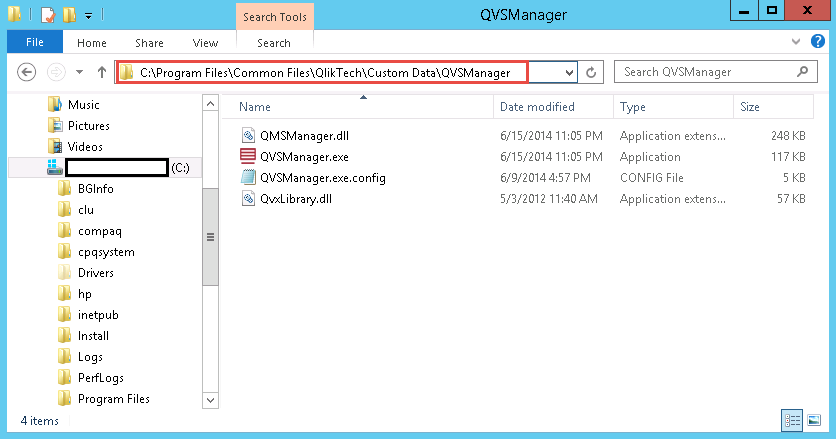 Deployment of the QVSManager.zip file in the “Custom Data” directory of QlikView
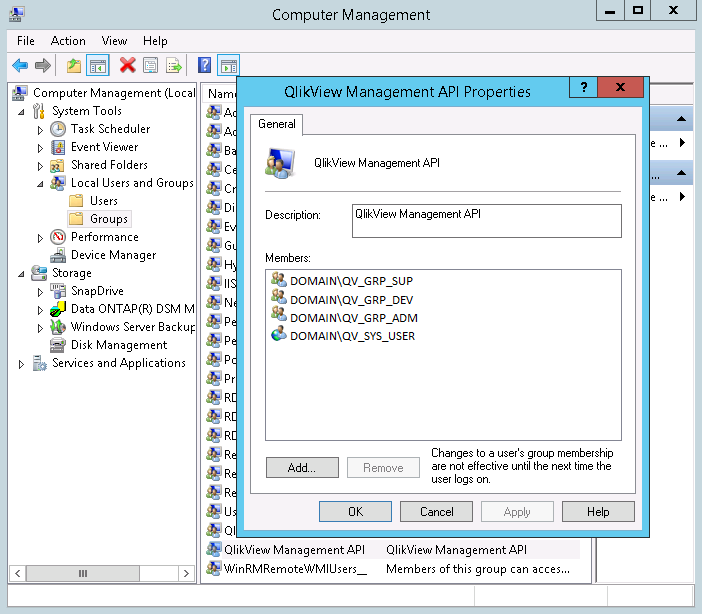 Creation and configuration of the Windows Server’s local group for the QVSManager
Once this new QlikView Document is ready (Document deployed, new task created and scheduled, aso…), you should be able to see it in the QlikView AccessPoint and manage the QlikView licenses directly from this new application. Believe me, it will greatly facilitate your work!
Okay, that was my second blog entry about QlikView, I guess that’s enough for now :). I hope some of you found these tips useful and if needed, don’t hesitate to let me a little comment below and I’ll do my best to help you. See you soon!
![Thumbnail [60x60]](https://www.dbi-services.com/blog/wp-content/uploads/2022/08/MOP_web-min-scaled.jpg)
![Thumbnail [90x90]](https://www.dbi-services.com/blog/wp-content/uploads/2022/08/ATR_web-min-scaled.jpg)