OctoPerf is a SaaS tool based on Apache JMeter, the load test functional behavior and measure performance reference tool. Among others, it has several advantages compared to JMeter:
- It can integrate with monitoring
- Run from different location by design
- It supports import of HTTP Archive (HAR) file format
To start creating a scenario with OctoPerf, the easiest is to record it with our browser.
HAR File Format
HAR file is a JSON-formatted file which contains all Web browser actions and results in the purpose of analyzing performance of a Web application. Even if the specification were never approved, the possibility to export into HAR exists in all major browser.
I will show you how to do it with FireFox.
Recording
OctoPerf provides a simple store application which I will use for this: https://petstore.octoperf.com/
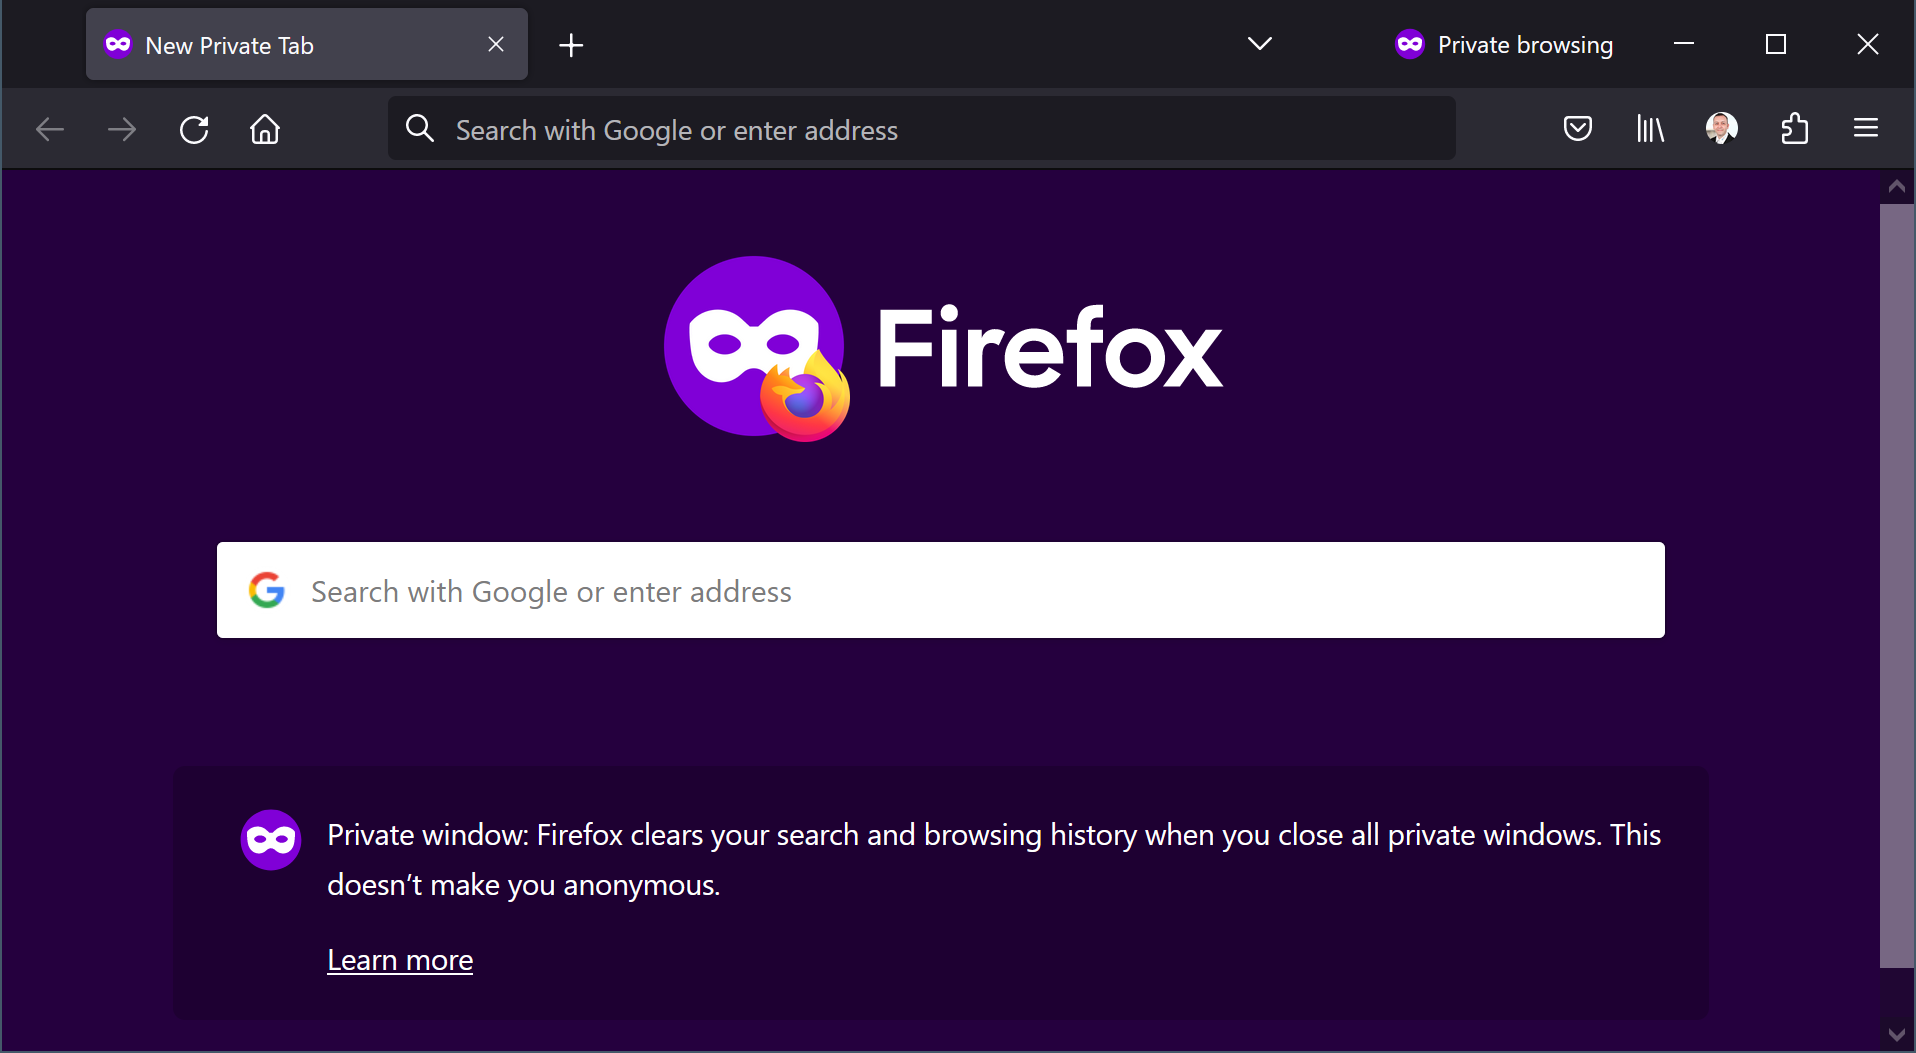
First, to avoid any side-effect of browser caching, it is recommended to open a Private window. Keyboard shortcut is Ctrl+Shift+P.
Then, I open the Developer Tools (Ctrl+Maj+I) and on Network tab, ensure Persist Log is checked:

Next, we can test the Web application. The scenario will be:
- Click “Enter the Store”
- Sign In
- Enter credentials and click Login
- Go into “Fish” category by clicking the link
- Select “Koi”
- Add Spotted Koi to the Cart
- Proceed to Checkout
- Click Continue and then Confirm
- Finally, Sign Out
Once, the scenario is completed, I export it in HAR:
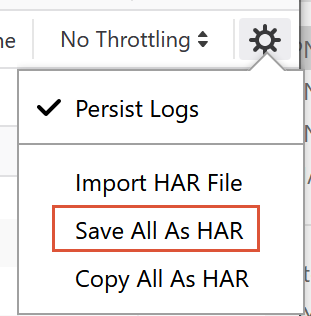
har file is ready.
OctoPerf Import
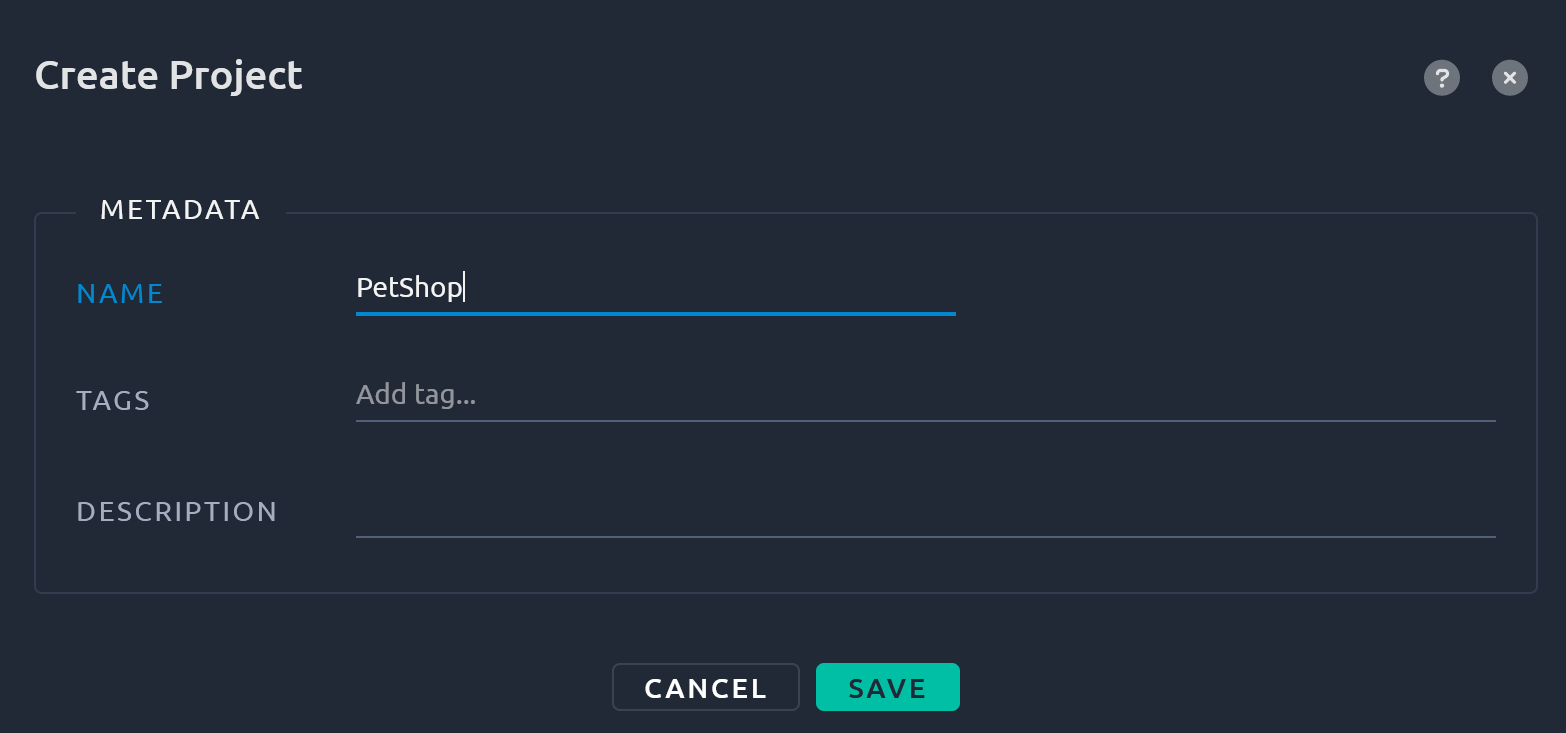
In OctoPerf Projects tab, click “Create Project” and name it:
Select the newly created project:
l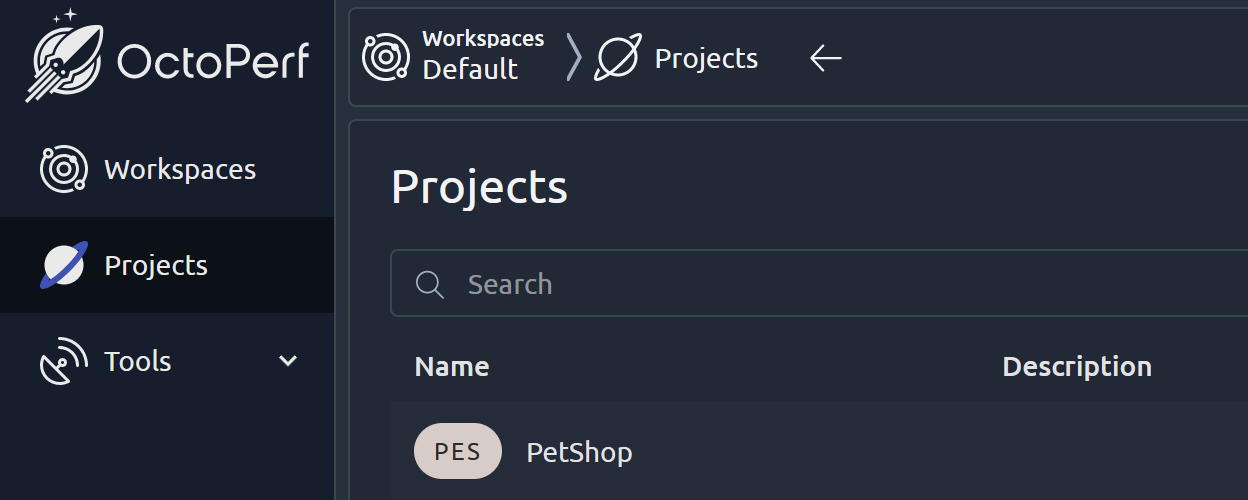
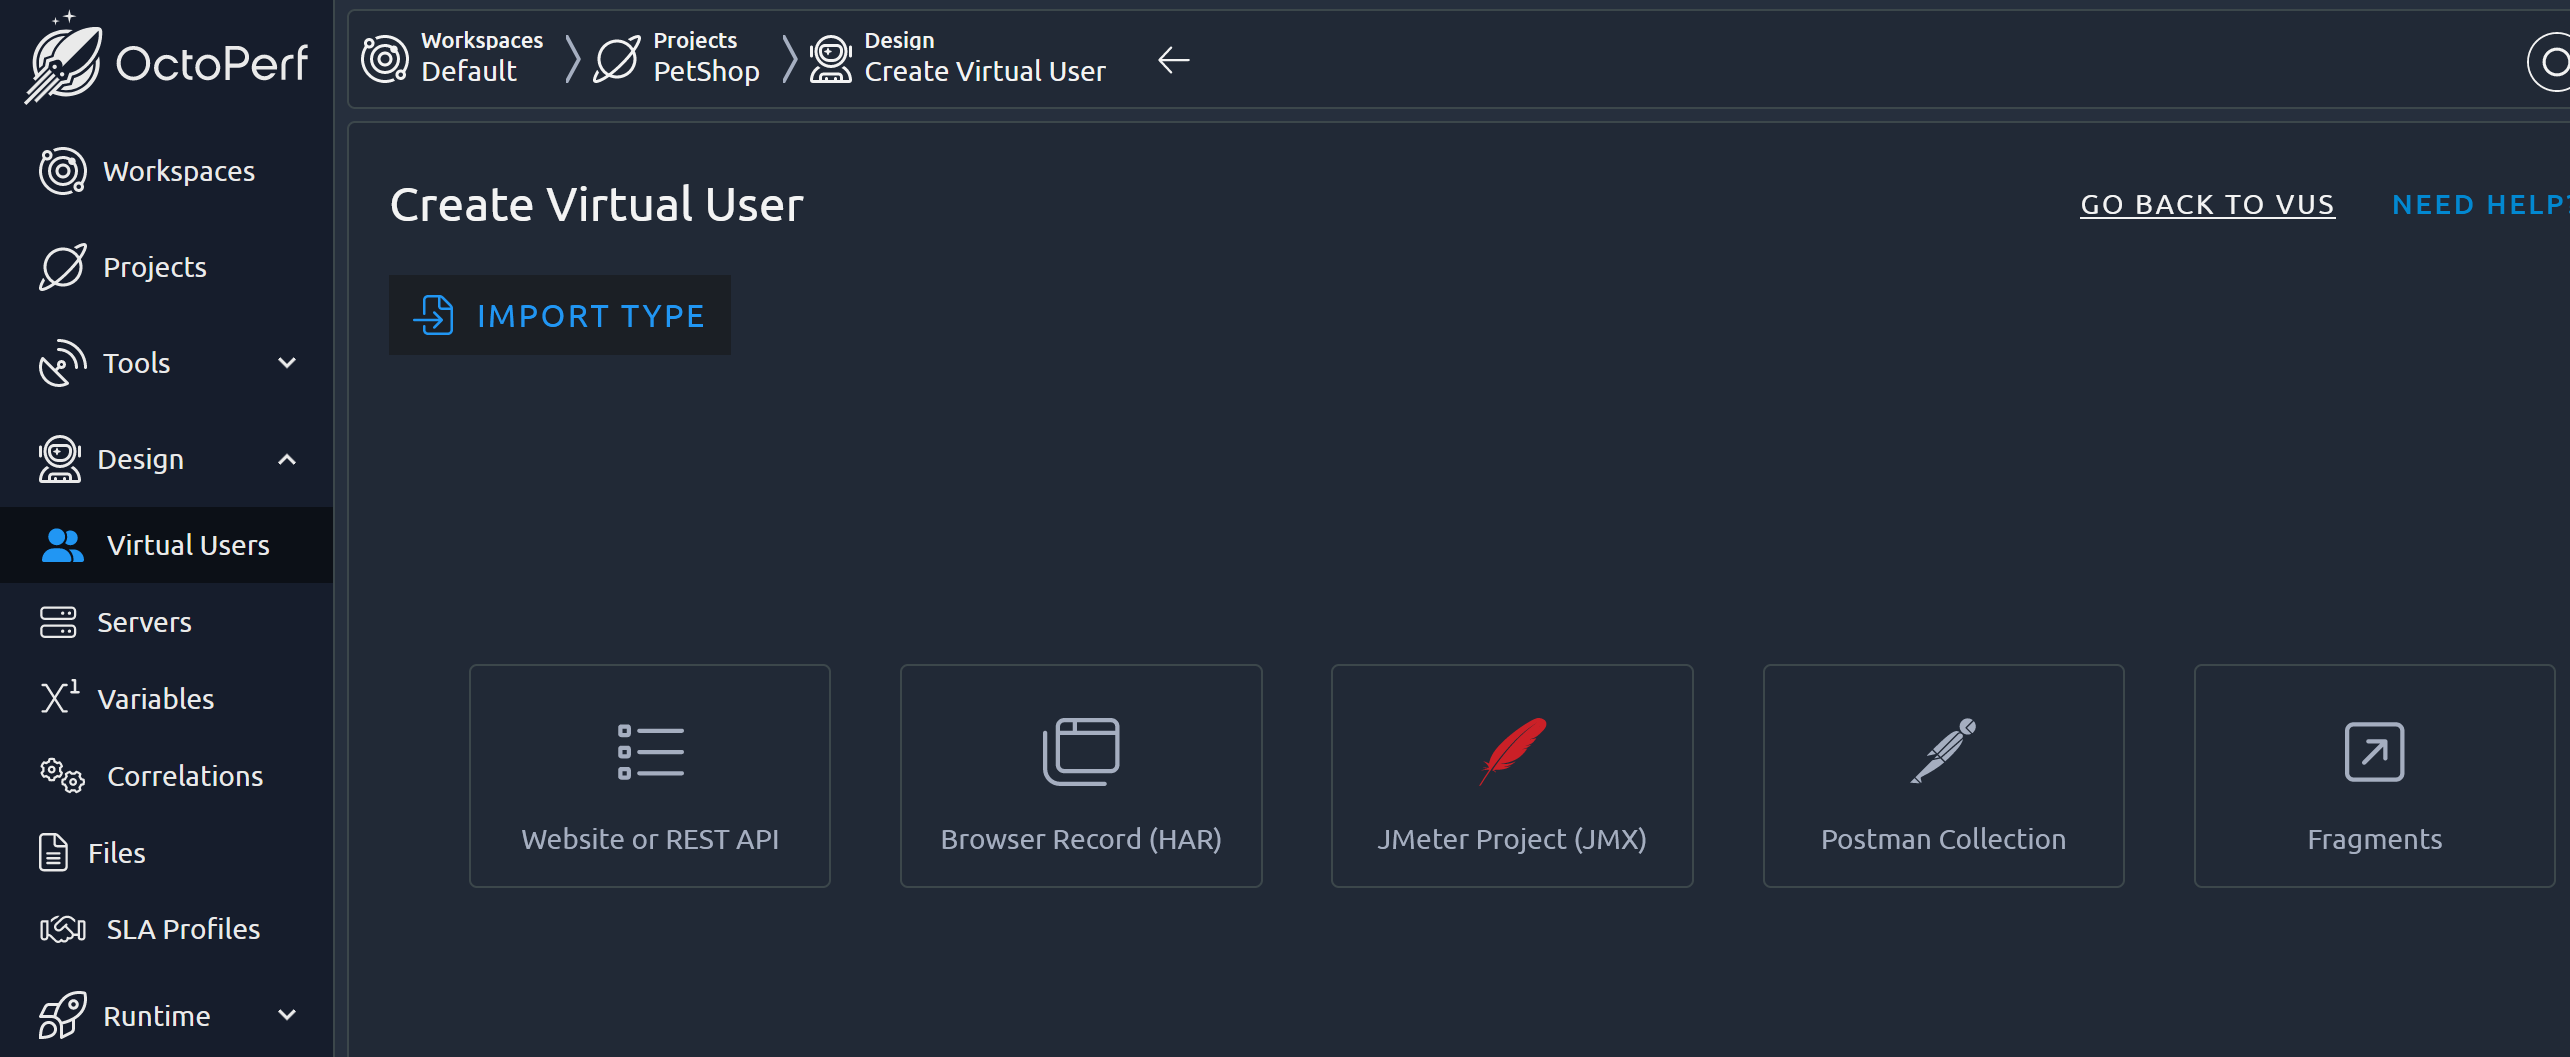
Next screen will be Virtual User (VU) creation where I select Browser Record (HAR):
Import Type will be obviously FireFox. I select the file:
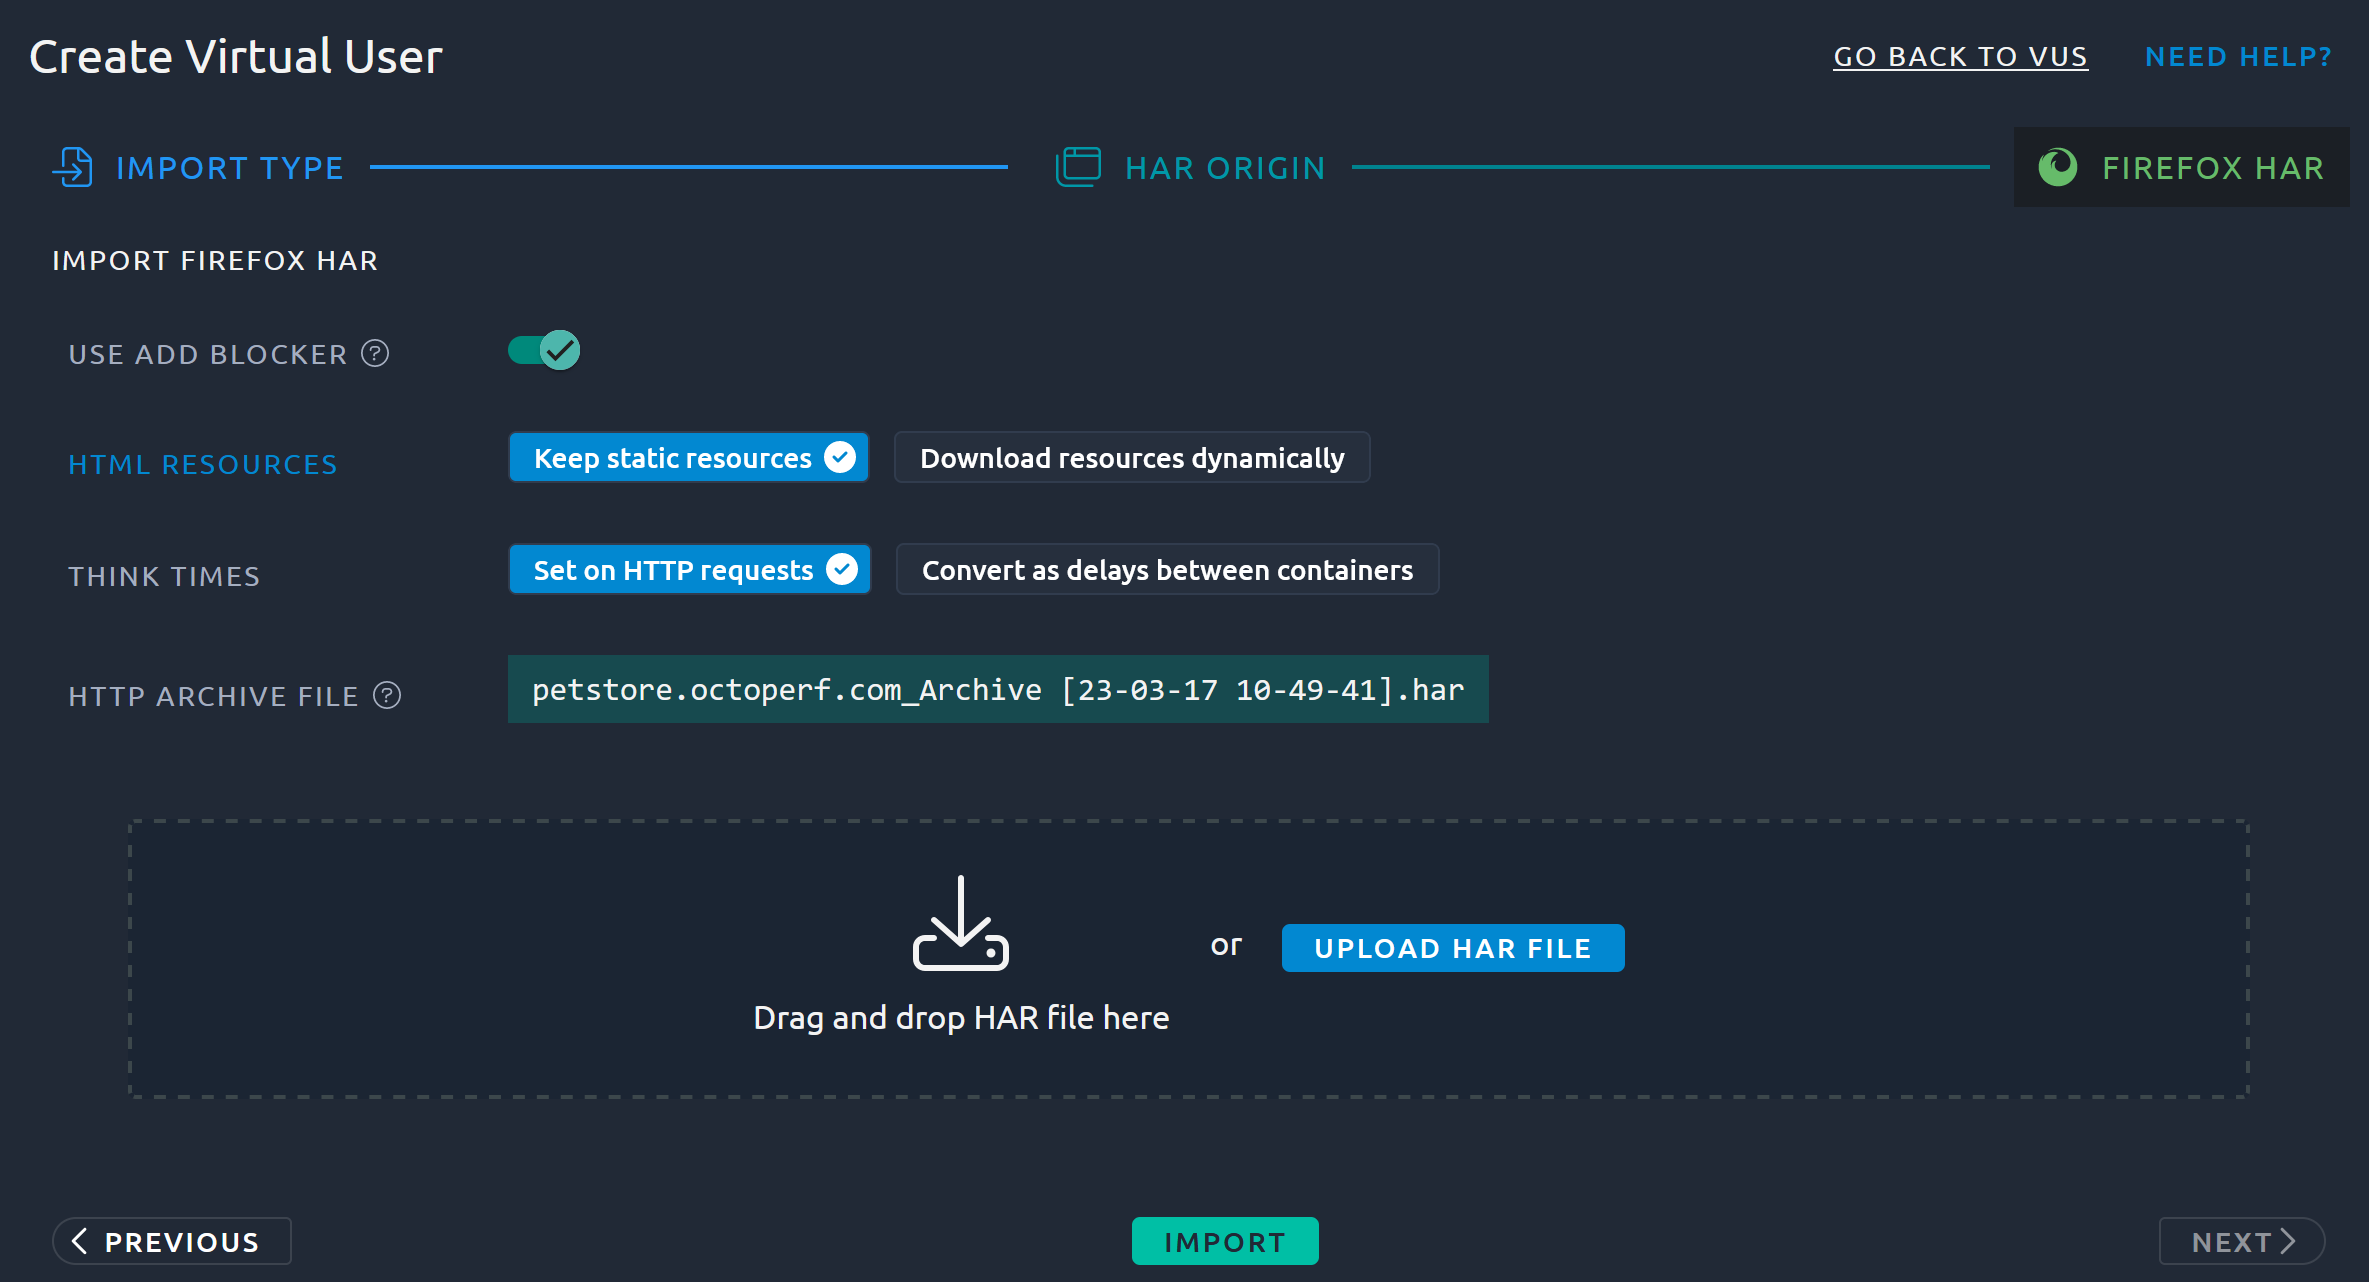
And click import. Then, double-click on the newly created VU.
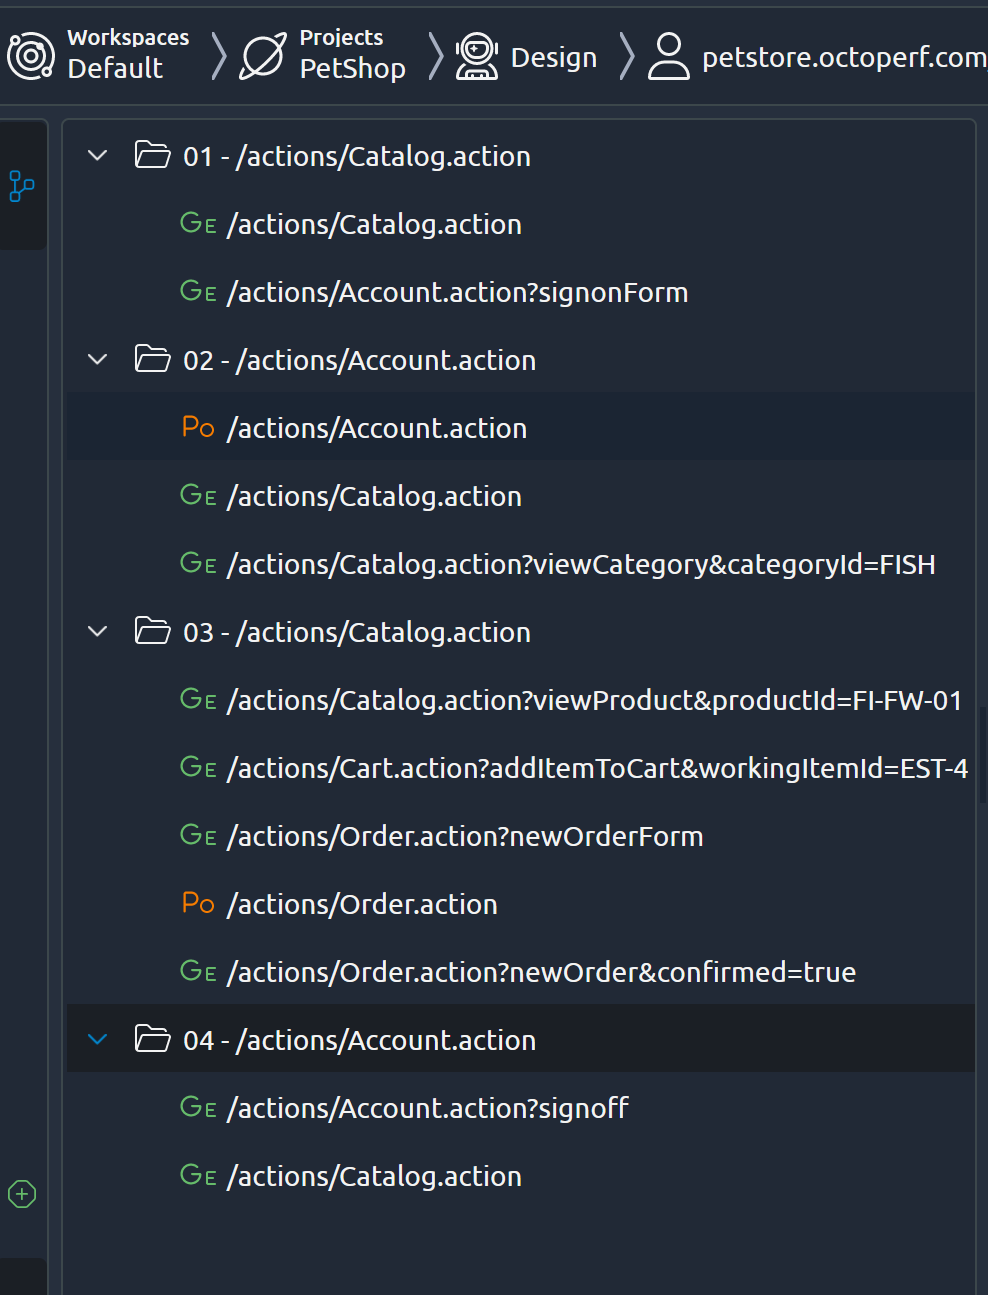
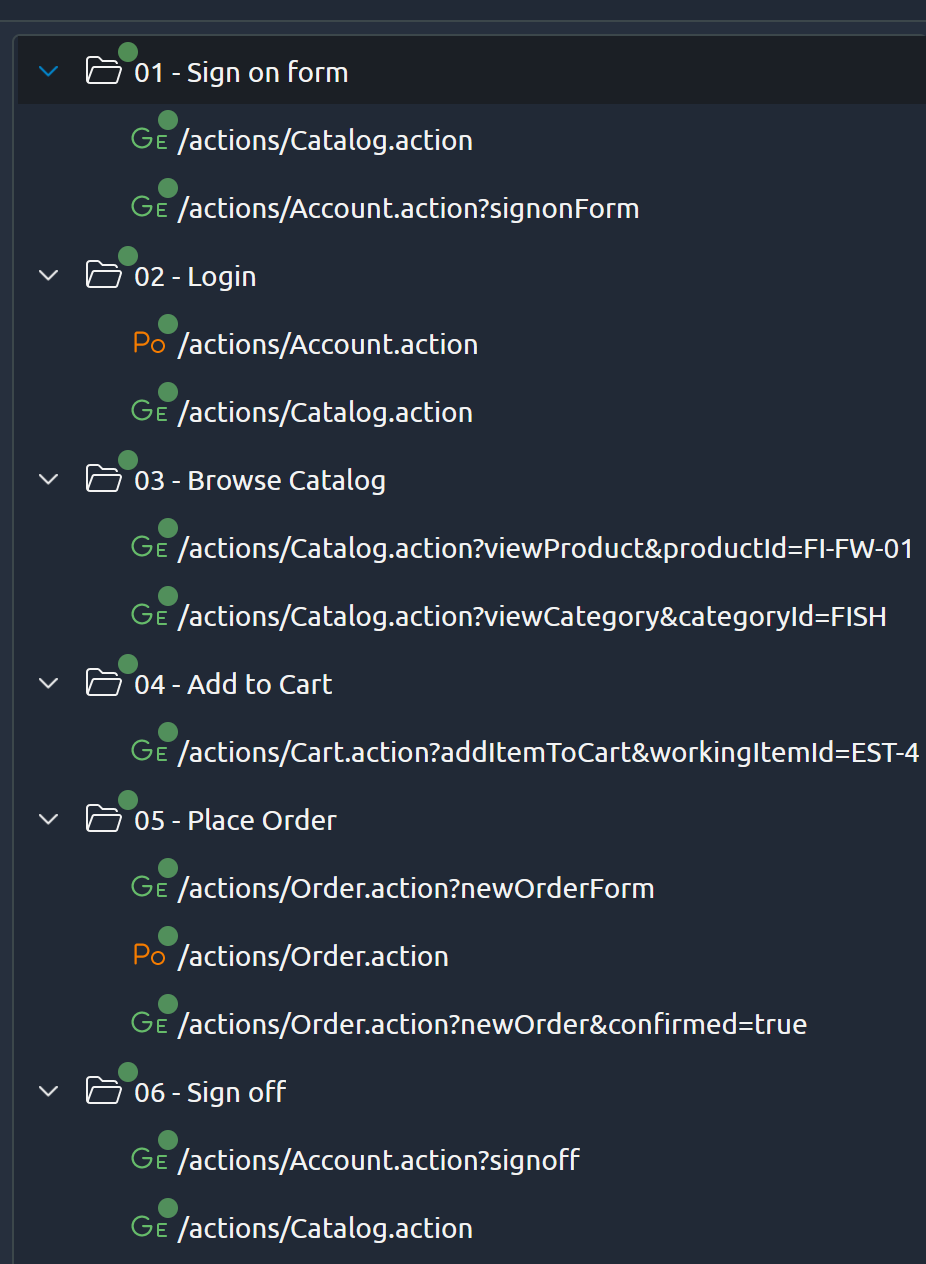
Now, we are seeing a list of containers. Let’s unfold everything for a better understanding:
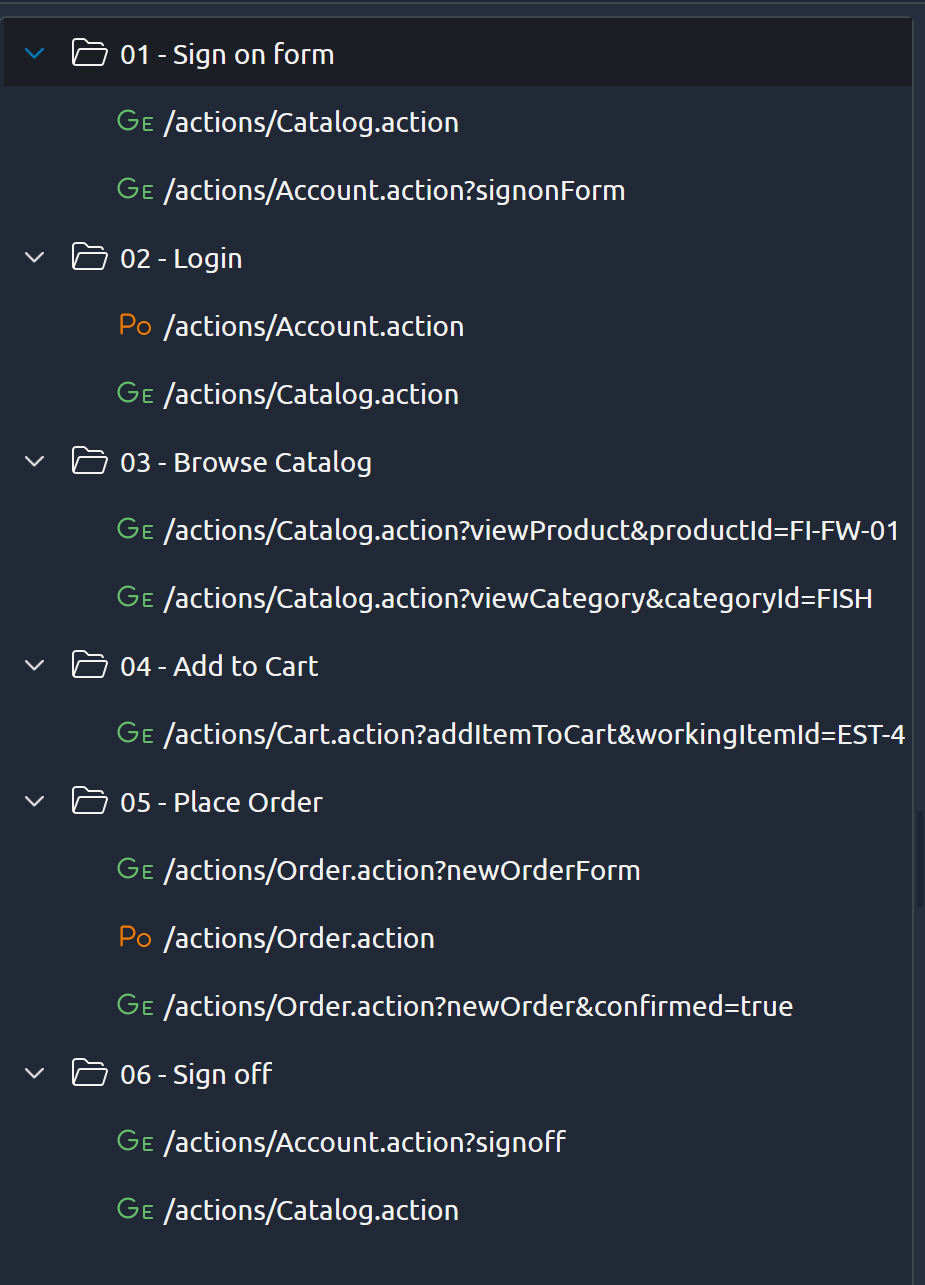
Let’s rename each one to make it clearer:
- Sign on form
- Login
- Browse catalog
- Add to cart
- Place order
- Sign off
New VU view is now like that:
Run VU
Before running at scale with a scenario, I will trigger one run to see how it behave. The tree changed a bit with small green dot:
This mean we can go in each an every request and access debugging information. Let’s see in the first HTTP POST:

In the bottom part of this windows, we have access to several information including:
- Metrics with response times
- Request headers
- Request bodies
- Response Headers
- Response Bodies
A very nice feature is the small icon near each information: ≠ or =
It tells you if the data between what the HAR is and if last run is different or not. This helps to focus on where variables extraction and injection could be added. For example, in the request bodies:
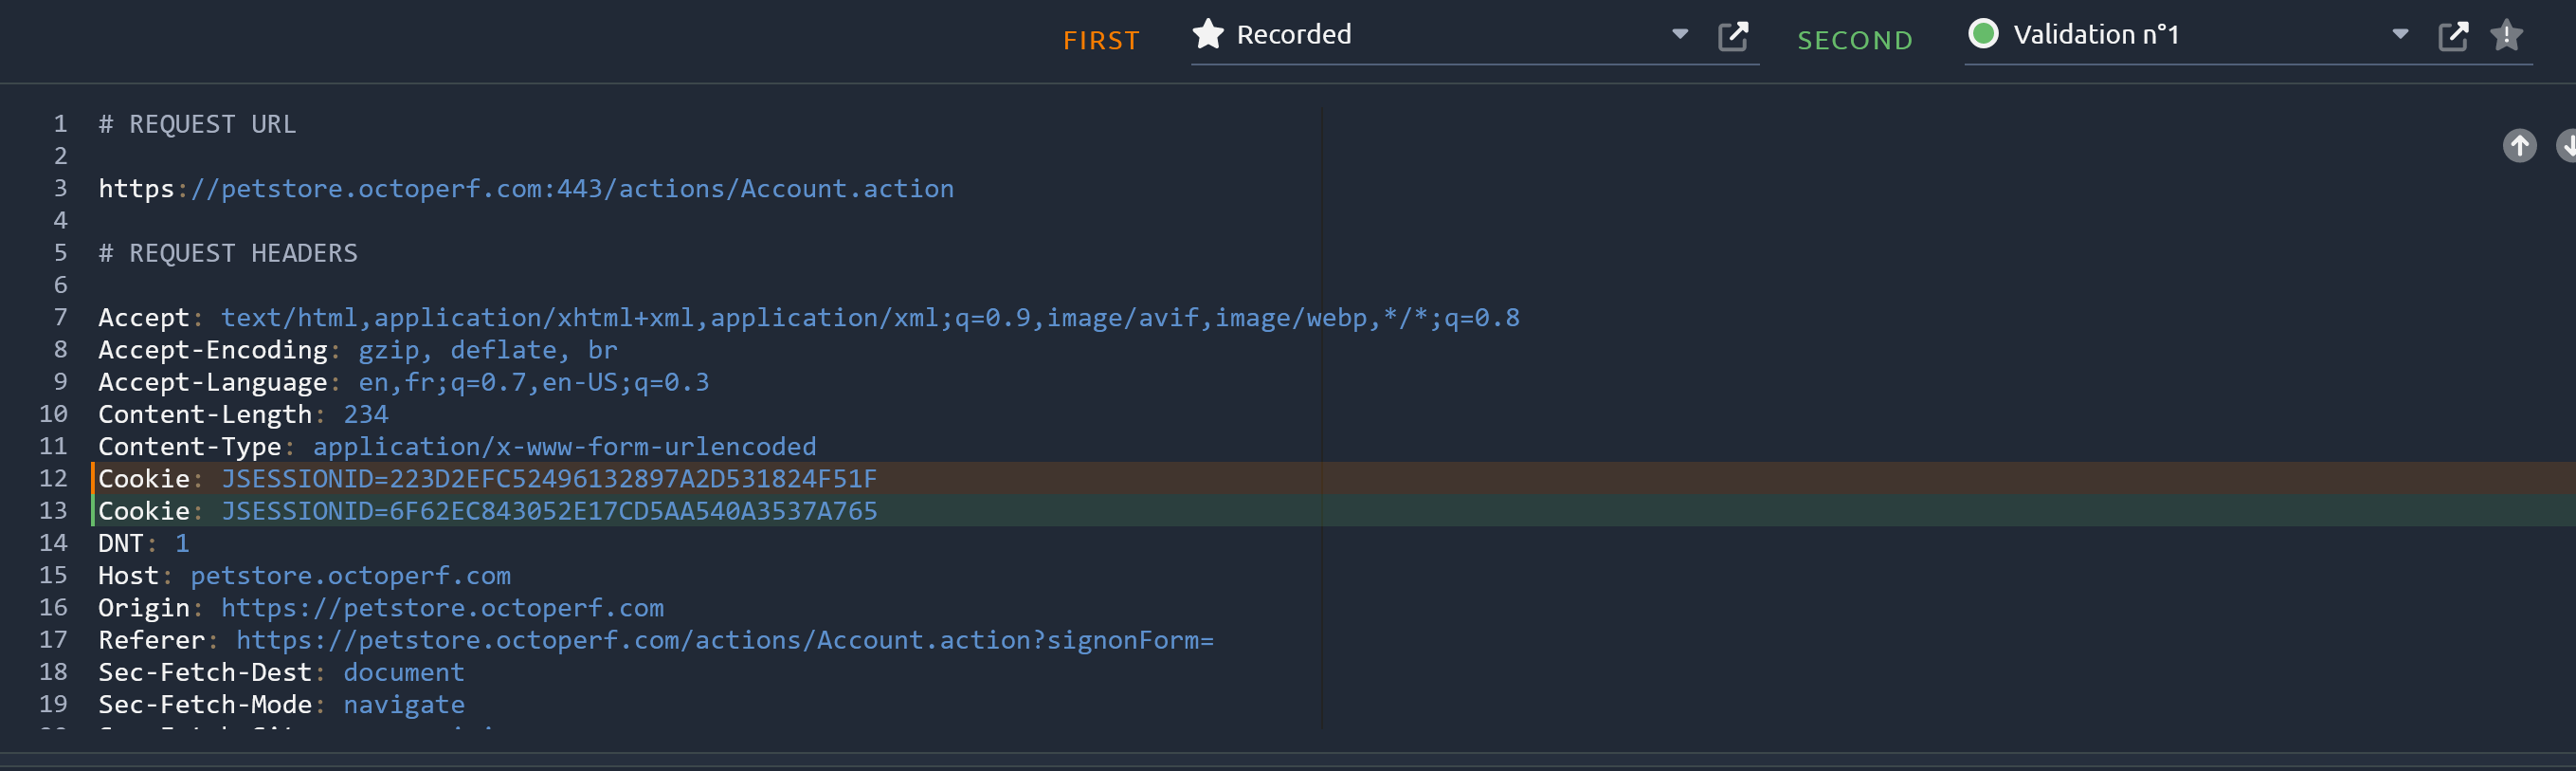
We can see that JSESSIONID changed which is obvious as every user (i.e. each run) will have a different session.
Assertion
Let’s add an assertion to ensure user is properly logged in. For that, I know that once I am logged, page contains “Welcome <username>!“.
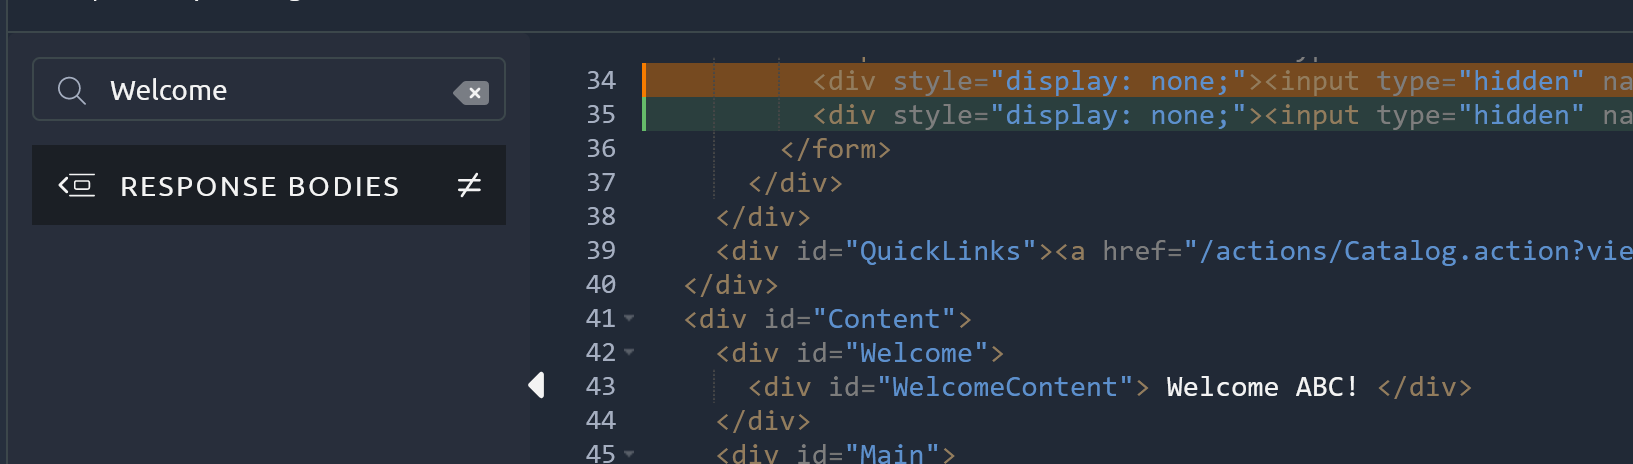
We could also focus on the WelcomeContent div presence.
To add an assertion, I right click on the action and select “insert child action”, “pre/post processcors” and “Response assertion”. Let’s name it “Logged in” and add “WelcomeContent” in Values to check:
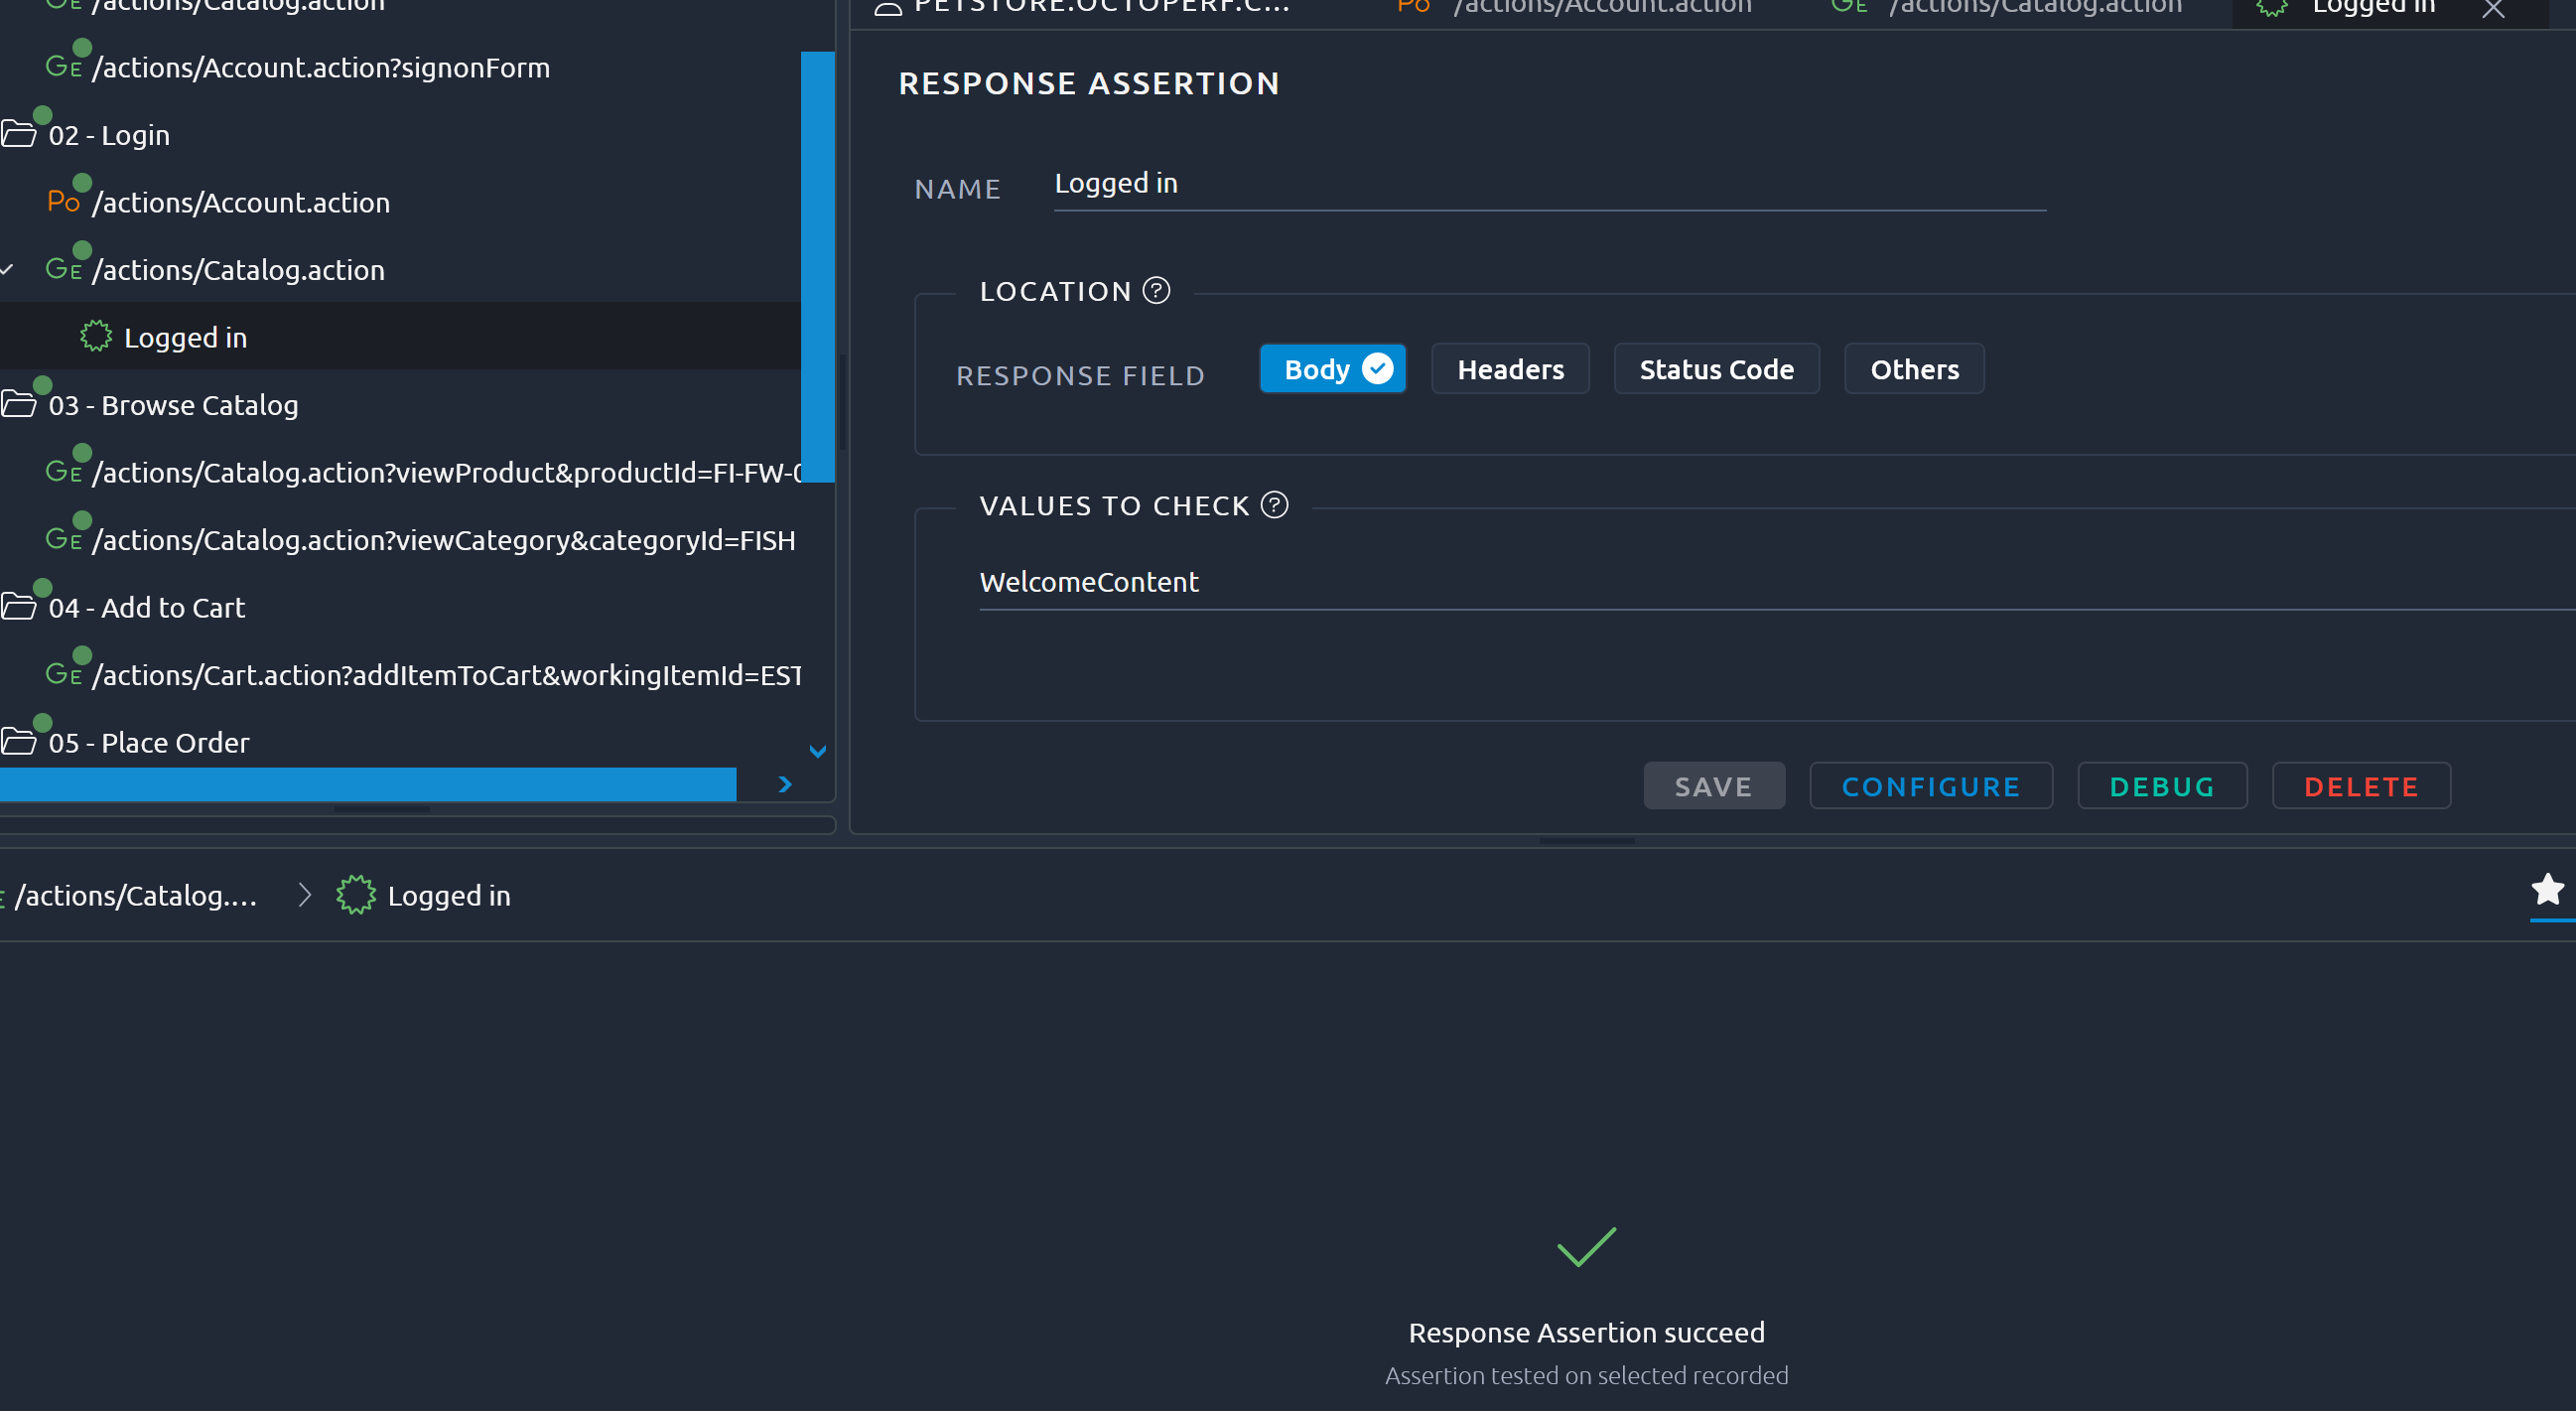
Another small but very nice feature is that you don’t need to run another debug test as it immediately validates assertion against recorded content.
Next Steps
In this first blog, we have seen how to create a simple static Virtual User and one assertion. As JMeter, there are many more features to explore with OctoPerf. For now, to run our first test at scale, we have few steps to add:
- Create a scenario to define amount of user to run, how it will scale from which location
- Run it
- Review the generated report
![Thumbnail [90x90]](https://www.dbi-services.com/blog/wp-content/uploads/2022/09/DDI_web-min-scaled.jpg)