One of the most common errors while running an application is “out of memory”. And Java is no different besides errors being named exceptions. The exact exception name you might have encountered is:
java.lang.OutOfMemoryError
And, in most cases, it is related to Java heap.
I will go through a few reminders on what Java heap is. How it works and how to monitor it.
Definitions
Java Heap
The Java heap stores all objects created by the application. To optimize garbage collection (more info about that in next chapter), JVM heap is divided in multiple zones:
- Young zone:
- Eden: Where new objects are created.
- Survivor0 and 1: Where objects are moved if they survive one GC.
- Old zone: If objects survive multiple GC, they will end in that zone. The amount of time before an object is moved into that zone depends on GC implementation.
When it is not possible to modify JVM startup arguments (because it requires a restart), jstat command could provide some information on zones usage and capacities.
An example of jstat command is:
jstat -gc <PID> 5000
where <PID> is the JVM process ID and 5000 is the period for getting metrics in milliseconds.
Output example:
 S0C    S1C    S0U    S1U      EC       EU        OC         OU       MC     MU    CCSC   CCSU   YGC     YGCT    FGC    FGCT    CGC    CGCT     GCT
 0.0   6144.0  0.0   6144.0 452608.0 43008.0   589824.0   68717.5   130560.0 117893.6 19456.0 14979.1     18    1.758   0      0.000   0      0.000    1.758
 0.0   6144.0  0.0   6144.0 452608.0 44032.0   589824.0   68717.5   130560.0 117893.6 19456.0 14979.1     18    1.758   0      0.000   0      0.000    1.758
 0.0   6144.0  0.0   6144.0 452608.0 45056.0   589824.0   68717.5   130560.0 117893.6 19456.0 14979.1     18    1.758   0      0.000   0      0.000    1.758
 0.0   6144.0  0.0   6144.0 452608.0 46080.0   589824.0   68717.5   130560.0 117893.6 19456.0 14979.1     18    1.758   0      0.000   0      0.000    1.758
As it does not tell when metrics where gathered, it might be useful to use a command like ts to prepend each line with a timestamp.
Additionally, output also provides information about garbage collection like counts and timings. I will go on that in more detail in next chapter.
Garbage Collection
As memory is not unlimited, there is a mechanism to remove useless objects: Garbage Collection. This is an automatic process and programmers do not need to worry about it.
It is phased in two steps (even more for more complex GC algorithms):
- first, identification of objects that can be deleted.
- second, actual deletion of objects identified at step 1
To avoid going through all objects in memory on each GC, there are two types of GC depending on the zone being worked on:
- Normal GC (aka Young GC)
- Full GC
There are also multiple garbage collection strategies which are aimed to have, for example, shortest pause or lowest memory usage. Currently, G1 (Garbage-First) is the default, and recommended, collector strategy for server JVM. It benefits from multiprocessors to decrease pause times and increase throughput. The algorithm is also much more complex than the two-phased approach described earlier.
Toolbox
For jmap
The first tool is Excel which is enough to plot jmap -gc results.
GC Logs
To have a more detailed view on how GC behave, additional arguments must be added to the JVM. It will be different on older Java releases (before Java 11).
-verbose:gc
This parameter implies other parameters related to log file storage for location (-Xlog:gc), file rotation (-XX:+UseGCLogFileRotation), number of files to keep (-XX:NumberOfGCLogFiles), files size limit (-XX:GCLogFileSize), etc.
A typical GC log will look like this:
[0.929s][info][gc] Using G1
[1.625s][info][gc] GC(0) Pause Young (Normal) (G1 Evacuation Pause) 31M->26M(512M) 37.499ms
[1.731s][info][gc] GC(1) Pause Young (Normal) (G1 Evacuation Pause) 52M->52M(512M) 44.428ms
[1.845s][info][gc] GC(2) Pause Young (Normal) (G1 Evacuation Pause) 73M->74M(512M) 50.657ms
[1.987s][info][gc] GC(3) Pause Young (Normal) (G1 Evacuation Pause) 104M->104M(512M) 53.909ms
[2.069s][info][gc] GC(4) Pause Young (Normal) (G1 Evacuation Pause) 125M->125M(512M) 46.043ms
[2.166s][info][gc] GC(5) Pause Young (Normal) (G1 Evacuation Pause) 146M->146M(512M) 67.730ms
[2.447s][info][gc] GC(6) Pause Young (Normal) (G1 Evacuation Pause) 184M->185M(512M) 110.586ms
[2.589s][info][gc] GC(7) Pause Young (Normal) (G1 Evacuation Pause) 206M->206M(512M) 68.388ms
[2.720s][info][gc] GC(8) Pause Young (Normal) (G1 Evacuation Pause) 227M->228M(512M) 64.378ms
[2.876s][info][gc] GC(9) Pause Young (Normal) (G1 Evacuation Pause) 249M->249M(512M) 67.766ms
[3.022s][info][gc] GC(10) Pause Young (Concurrent Start) (G1 Evacuation Pause) 270M->271M(512M) 65.774ms
[3.022s][info][gc] GC(11) Concurrent Cycle
[3.267s][info][gc] GC(12) Pause Young (Normal) (G1 Evacuation Pause) 292M->292M(512M) 64.186ms
[3.391s][info][gc] GC(13) Pause Young (Normal) (G1 Evacuation Pause) 313M->314M(512M) 75.695ms
[3.976s][info][gc] GC(14) Pause Full (System.gc()) 319M->292M(512M) 510.607ms
[3.977s][info][gc] GC(11) Concurrent Cycle 954.886ms
[4.101s][info][gc] GC(15) Pause Young (Normal) (G1 Evacuation Pause) 317M->293M(512M) 2.364ms
[4.165s][info][gc] GC(16) Pause Young (Concurrent Start) (G1 Evacuation Pause) 317M->293M(512M) 3.671ms
We can see:
- which method is used on line 1 (here G1)
- The type of GC (Young Normal)
- The zone memory usage (from line 18) before and after GC: 317M->293M
- The size of the zone between parenthesis: 512M
- Time spent by GC: 2.364ms
For even more details, option -XX:+PrintGCDetails can be added to startup arguments. Example output:
[1.545s][info][gc           ] GC(0) Pause Young (Normal) (G1 Evacuation Pause) 31M->26M(512M) 34.069ms
[1.545s][info][gc,cpu       ] GC(0) User=0.03s Sys=0.02s Real=0.03s
[1.624s][info][gc,start     ] GC(1) Pause Young (Normal) (G1 Evacuation Pause)
[1.624s][info][gc,task      ] GC(1) Using 2 workers of 2 for evacuation
[1.659s][info][gc,phases    ] GC(1)   Pre Evacuate Collection Set: 1.8ms
[1.659s][info][gc,phases    ] GC(1)   Evacuate Collection Set: 30.9ms
[1.659s][info][gc,phases    ] GC(1)   Post Evacuate Collection Set: 2.3ms
[1.659s][info][gc,phases    ] GC(1)   Other: 0.2ms
[1.659s][info][gc,heap      ] GC(1) Eden regions: 21->0(21)
[1.659s][info][gc,heap      ] GC(1) Survivor regions: 4->4(4)
[1.659s][info][gc,heap      ] GC(1) Old regions: 17->38
[1.659s][info][gc,heap      ] GC(1) Humongous regions: 11->11
[1.659s][info][gc,metaspace ] GC(1) Metaspace: 6718K(7040K)->6718K(7040K) NonClass: 6121K(6400K)->6121K(6400K) Class: 596K(640K)->596K(640K)
[1.659s][info][gc           ] GC(1) Pause Young (Normal) (G1 Evacuation Pause) 52M->52M(512M) 35.162ms
[1.659s][info][gc,cpu       ] GC(1) User=0.04s Sys=0.02s Real=0.04s
You might end up with too much information and get lost on what you are really trying to achieve.
Creating graphs based on that is not an easy task with Excel. I found this one: IBM Monitoring and Diagnostic Tools.
Heap Dump
Once you confirmed the memory leak by creating graph from previous metrics, you might wonder what part of the code (ie. class) is faulty. This could be achieved by creating heap dumps.
The command to do that is:
jmap -dump:file=heap.dmp <PID>
It is important to know that it will freeze the application and it can take some time which depends on the heap size and server performances (CPU and disk).
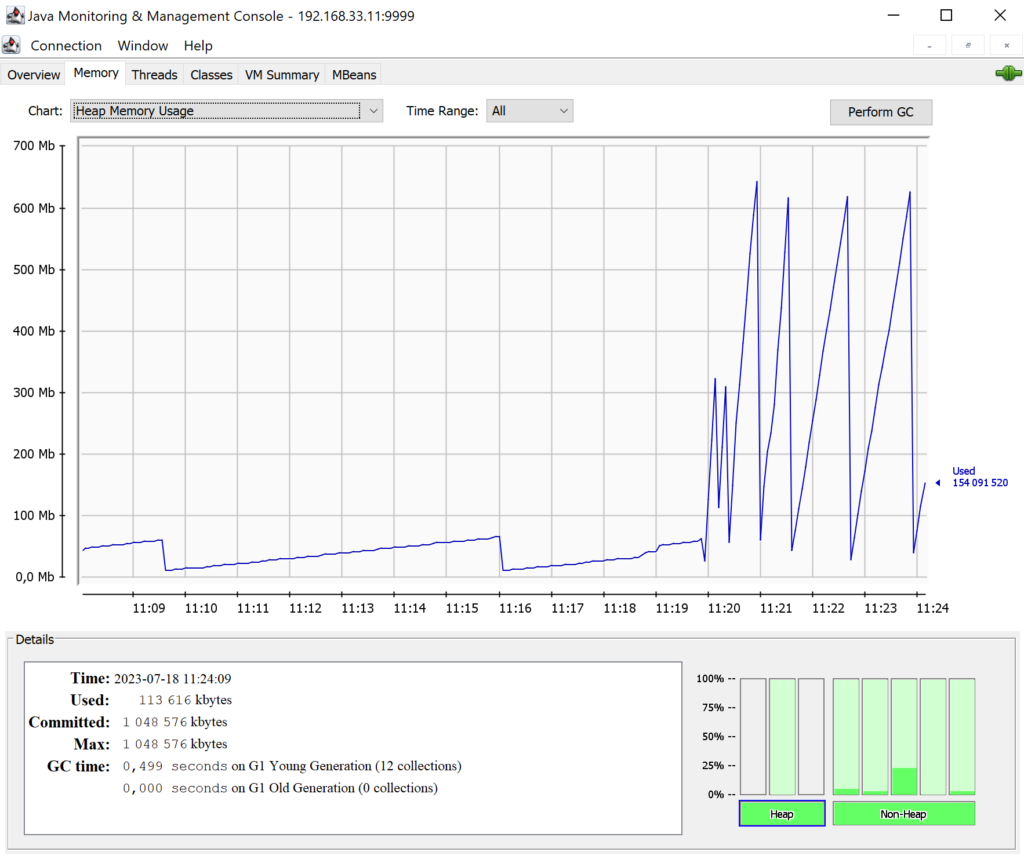
jconsole
jconsole, included with Java, can monitor a JVM, local or distant via JMX in real time. It focuses on memory and threads metrics.
VisualVM
VisualVm has many nice features to monitor JVM in real time and to analyze heap and core dumps. It can also be used to analyze heap dump offline. Additionally, it supports extra feature with plugins like GC information.
For example, the summary view of a heap dump:

SaaS Tools
There are also online tools available like gceasy or heaphero. They are nice and, with help of machine learning, provide results with very interesting advice on memory leaks or JVM parameters tuning, but there is an important downside you should be aware of:
Your JVM memory dump is on the cloud!
So, if you have strict rules on data privacy or sensitivity, you most not use them.
Conclusion
Keep in mind that monitor could add a little CPU load to your application JVM (if not a lot for dumps), but also disk usage, so use it wisely. Increasing heap size is not always the answer to OutOfMemoryError as it can increase GC pauses. In short, there is no quick fix for every situation.
Also note that I did not cover another important part of JVM performance troubleshooting. CPU can also be a limit of JVM performance. In this case, you have to use thread stack which will finger point high consuming threads and possible locks which prevent good performances.
![Thumbnail [90x90]](https://www.dbi-services.com/blog/wp-content/uploads/2022/09/DDI_web-min-scaled.jpg)