A typical web application architecture with a load balancer, two application servers and a database looks like this:
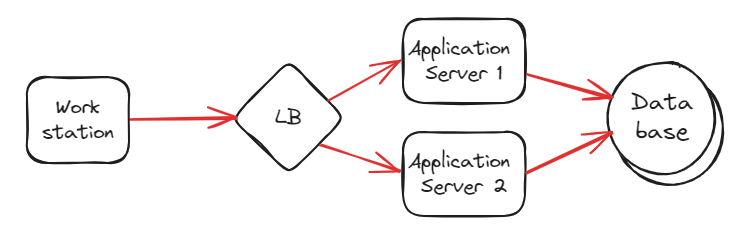
If you run a JMeter, or any load test tool, from one unique server or workstation, the load balancer will most likely route all traffic to only one of the application servers.
Why is that? Mainly because the load balancer uses the incoming IP (the IP of the workstation) as the key to maintain sticky session. Thus, this way of testing application will not be valid compared to real user traffic.
Fortunately, JMeter support remote testing. This will make connection coming from different IP and will improve how the load is balanced between the application servers.
In this blog post, I will explain how to set this up and how to run a scenario.
By the way, to setup these servers in the cloud, which is the ideal solution to have different remote IPs, I used YaK to provision them.
Setup Remote JMeter Server
JMeter uses RMI protocol to pass commands between JMeter controller and servers. To secure this traffic, we must first create a Java Key Store (jks) that will store key and certificate. A script is provided inside bin directory of Apache JMeter to achieve that:
bin# ./create-rmi-keystore.sh
What is your first and last name?
  [Unknown]:  rmi
What is the name of your organizational unit?
  [Unknown]:  OU
What is the name of your organization?
  [Unknown]:  ORG
What is the name of your City or Locality?
  [Unknown]:  Basel
What is the name of your State or Province?
  [Unknown]:  BS
What is the two-letter country code for this unit?
  [Unknown]:  CH
Is CN=rmi, OU=OU, O=ORG, L=Basel, ST=BS, C=CH correct?
  [no]:  yes

Copy the generated rmi_keystore.jks to jmeter/bin folder or reference it in property 'server.rmi.ssl.keystore.file'
Next, we need to copy this file in the bin directory of each remote server, so they can securely connect together with controller server.
In the same directory, I create a file named setenv.sh with following content:
export HEAP="-Xms6g -Xmx6g"
export JVM_ARGS="-Dnashorn.args=--no-deprecation-warning"
First line is to set a bigger JVM size (by default, it is only 1G). The second line is to remove a repeating warning I want to get rid of. You can create this file on each remote server.
Subsequently, we are ready to start server:
./jmeter-server
Created remote object: UnicastServerRef2 [liveRef: [endpoint:[10.0.0.157:43247,SSLRMIServerSocketFactory(host=controller/10.0.0.157, keyStoreLocation=rmi_keystore.jks, type=JKS, trustStoreLocation=rmi_keystore.jks, type=JKS, alias=rmi),SSLRMIClientSocketFactory(keyStoreLocation=rmi_keystore.jks, type=JKS, trustStoreLocation=rmi_keystore.jks, type=JKS, alias=rmi)](local),objID:[2a73d097:18c3wwwbc89:-7fff, 395571412347283568]]]
One important point to keep in mind is that not only does controller need to connect to remote server, but also the reverse way. Remote server needs to send back results to controller. Keep that in mind when opening ports in firewalls.
At this stage, one remote server is set up. Don’t forget to set up more remote server. The more, the better 🙂
Run Scenario
To trigger a scenario, we must run the following command from the controller server (from the bin directory):
./jmeter -n -t scenario.jmx -R server-01,server-02 -j ./test_results/scenario.log -l ./test_results/scenario.jtl
Let go through the list of arguments:
- -n means that we run without graphical user interface
- -t is the test plan path
- -R list of remote servers
- -j is the path to the log file
- -l is the path to the JMeter Test Log
A typical output will look like this (truncated):
Creating summariser <summary>
Created the tree successfully using scenario.jmx
Configuring remote engine: server-01
Configuring remote engine: server-02
Starting distributed test with remote engines: [server-02, server-01] @ 2023 Dec 5 14:56:06 CET (1701784566195)
Remote engines have been started:[server-02, server-01]
Waiting for possible Shutdown/StopTestNow/HeapDump/ThreadDump message on port 4445
summary +   7954 in 00:00:24 =  334.6/s Avg:    49 Min:     0 Max:   275 Err:     0 (0.00%) Active: 23 Started: 351 Finished: 328
summary +  10611 in 00:00:30 =  355.4/s Avg:    46 Min:     0 Max:   249 Err:     0 (0.00%) Active: 26 Started: 793 Finished: 767
summary =  18565 in 00:00:54 =  346.1/s Avg:    47 Min:     0 Max:   275 Err:     0 (0.00%)
summary +  10618 in 00:00:30 =  355.5/s Avg:    58 Min:     0 Max:   291 Err:     0 (0.00%) Active: 26 Started: 1236 Finished: 1210
...
summary = 103949 in 00:04:54 =  353.9/s Avg:    57 Min:     0 Max: 15767 Err:     0 (0.00%)
summary +   2947 in 00:00:09 =  339.4/s Avg:    53 Min:     0 Max:   266 Err:     0 (0.00%) Active: 0 Started: 4454 Finished: 4454
summary = 106896 in 00:05:02 =  353.5/s Avg:    56 Min:     0 Max: 15767 Err:     0 (0.00%)
Tidying up remote @ 2023 Dec 5 15:01:08 CET (1701784868922)
... end of run
The scenario.log contains a bit more information, but the interesting part (from performance measurement point of view) is what you have has command output above.
Another important point is to copy any resource you might need on distant server like, for example, csv files (ie. config element of type “CSV Data Set Config“) as JMeter does not copy it from controller to remote servers.
If you don’t see the “summary” lines, your scenario is probably not running as expected. I recommend having a look at the scenario.log file on the controller as well as jmeter-server.log on the remote servers.
Create Report
The scenario has completed, and you have a scenario.jtl file ready to be analyzed. The command to realize that is:
.\jmeter -g scenario.jtl -o report_results
This generates an html report which gives information about response time, throughput and latency over time.
What Next ?
These steps requires still many manual operation, and, in load test, you want to run many tests with different parameters. We can create an ansible playbook to do setup JMeter remote servers, controller as well as running the test itself.
![Thumbnail [90x90]](https://www.dbi-services.com/blog/wp-content/uploads/2022/09/DDI_web-min-scaled.jpg)