ELK Stack or more recently called Elastic Stack, is a combination of three open-source projects: Elasticsearch, Logstash and Kibana. All these projects have been developed by Elastic and used to store, analyze, discover, and visualize data efficiently! I got the chance to install, configure and maintain Elastic Stack on Kubernetes since more than two years. Today, I would like to share with you a quick journey along the Elastic Stack 😊
Elastic Stack components
Elasticsearch
In fact, everything started with Elasticsearch, which is for me the heart of Elastic Stack! It is a highly scalable open-source full-text search and analytics engine. It allows you to store, and analyze big volumes of data in near real time, whether you have structured or unstructured text, numerical data or geospatial data, Elasticsearch can efficiently store and index it 😉
It provides a distributed system on top of Lucene StandardAnalyzer for indexing and utilizes a JSON based REST API.
LogStash
Logstash is a light-weight, open-source, server-side data processing pipeline that allows you to collect data from a variety of sources, transform them on the fly, and send them to your desired destination. Because of its tight integration with Elasticsearch, powerful log processing capabilities, Logstash is a popular choice for loading data into Elasticsearch.
Kibana
It is your window into the stack! Kibana is a data visualization and exploration tool used for log and time-series analytics, application monitoring, and operational intelligence use cases. It offers powerful and easy-to-use features such as histograms, line graphs, pie charts, heat maps, and built-in geospatial support. Also, it provides tight integration with Elasticsearch, a popular analytics and search engine, which makes Kibana the default choice for visualizing data stored in Elasticsearch.
Beats
It has been introduced in 2015 in the Elastic Stack. It is a family of lightweight, single-purpose data shippers called Beats. They are client applications sending data from hundreds or thousands of machines or containers to Elasticsearch. There are 7 Beats: Filebeat, Metricbeat, Packetbeat, winlogbeat, Auditbeat, Heartbeat, Functionbeat.
I will talk more in deep about each component in next blogs, now let’s understand how all these components work together.
Elastic Stack Architecture
The following is the architecture of ELK Stack which shows the proper order of layer within ELK. Here, the data generated from various sources (Logstash or Beats) are collected and processed based on the provided filter criteria. Logstash and/or Beats then pipes the data to Elasticsearch which then analyzes and searches. Finally, At the outer layer, the closest to the user, you can find Kibana which allow users to visualize and manage data as per the requirements.
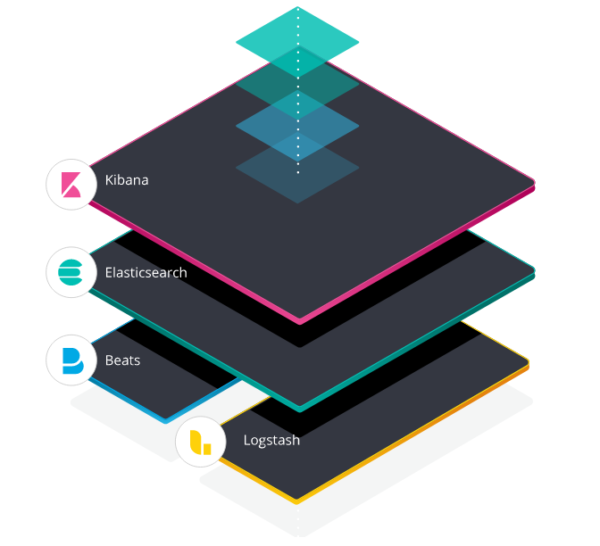
From https://www.elastic.co/elk-stack
This blog is a first quick overview on Elastic Stack, in next blogs I will share with you how I installed and configured each component of Elastic Stack on Kubernetes 🙂 In the meanwhile, please share your experience and use cases, if you don’t have any experience on it give it a try 😉
![Thumbnail [60x60]](https://www.dbi-services.com/blog/wp-content/uploads/2022/09/DDI_web-min-scaled.jpg)