This is part II of the article DctmAPI.awk revisited. See Part I here.
The table presentation can be visually quite rich: it supports row colorization with optional color alternation and gridding, i.e. enclosing the table and data into a grid.
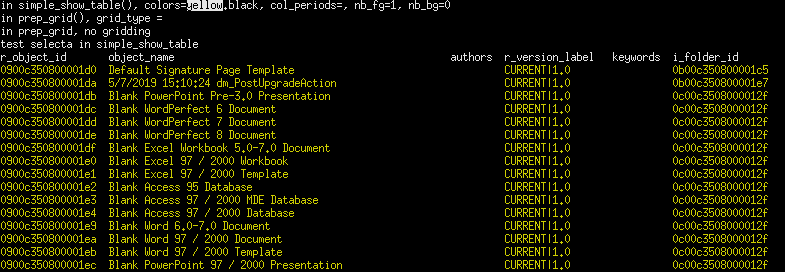
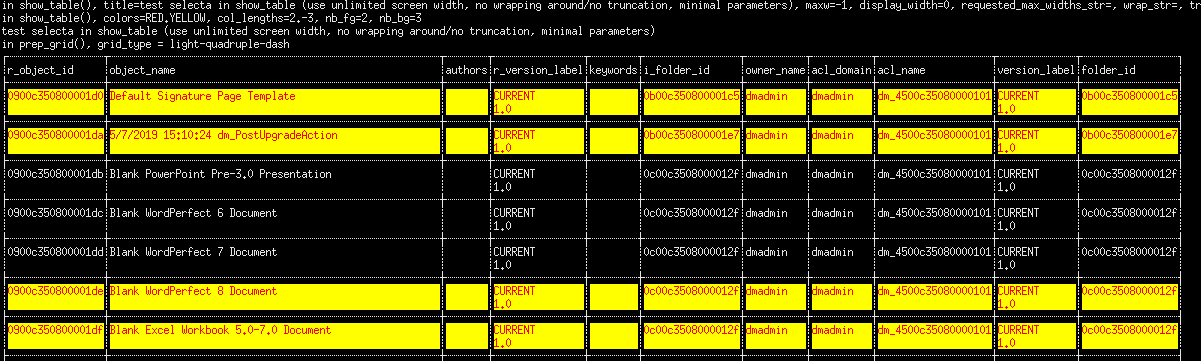
Row colorization allows to colorize the data with a foreground color and an optional background color without alternation, e.g. with a yellow foreground and the default (black) background:
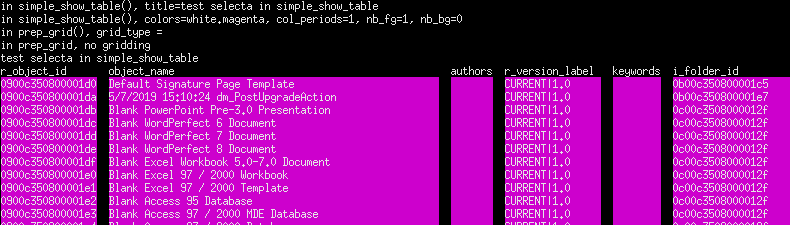
Or with a background, e.g. white on magenta:
Colors are specified through the syntax:
[-]fg[.[-]bg]
where bg is optional, fg and bg can optionally have a leading minus sign and are one of the following colors:
black, red, green, yellow, blue, magenta, cyan, white, BLACK, RED, GREEN, YELLOW, BLUE, MAGENTA, CYAN, WHITE, reset
Lowercase letters are used for normal/dim intensity and uppercase ones for bright intensity, a convenient notation we shamelessly stole from the rlwrap utility (see Enhancing idql/iapi with rlwrap (parts I & II)).
The special color reset means to use the terminal’s default color for the given position, either foreground or background.
A minus sign disables the colorization (i.e. use the terminal’s default) in the respective position. As expected, when both foreground and background colors are negative, no colorization takes place.
Colors use ANSI sequences as presented in ANSI escape code.
The interface’s init_colors() initializes the global associative arrays FG_COLORS and BG_COLORS with the ANSI colore code sequences. Those arrays are indexed by the above color names.
The interface’s function colorize() takes a string and a color with the format fg[.bg] and outputs the string bracketed with the corresponding color’s ANSI sequence.
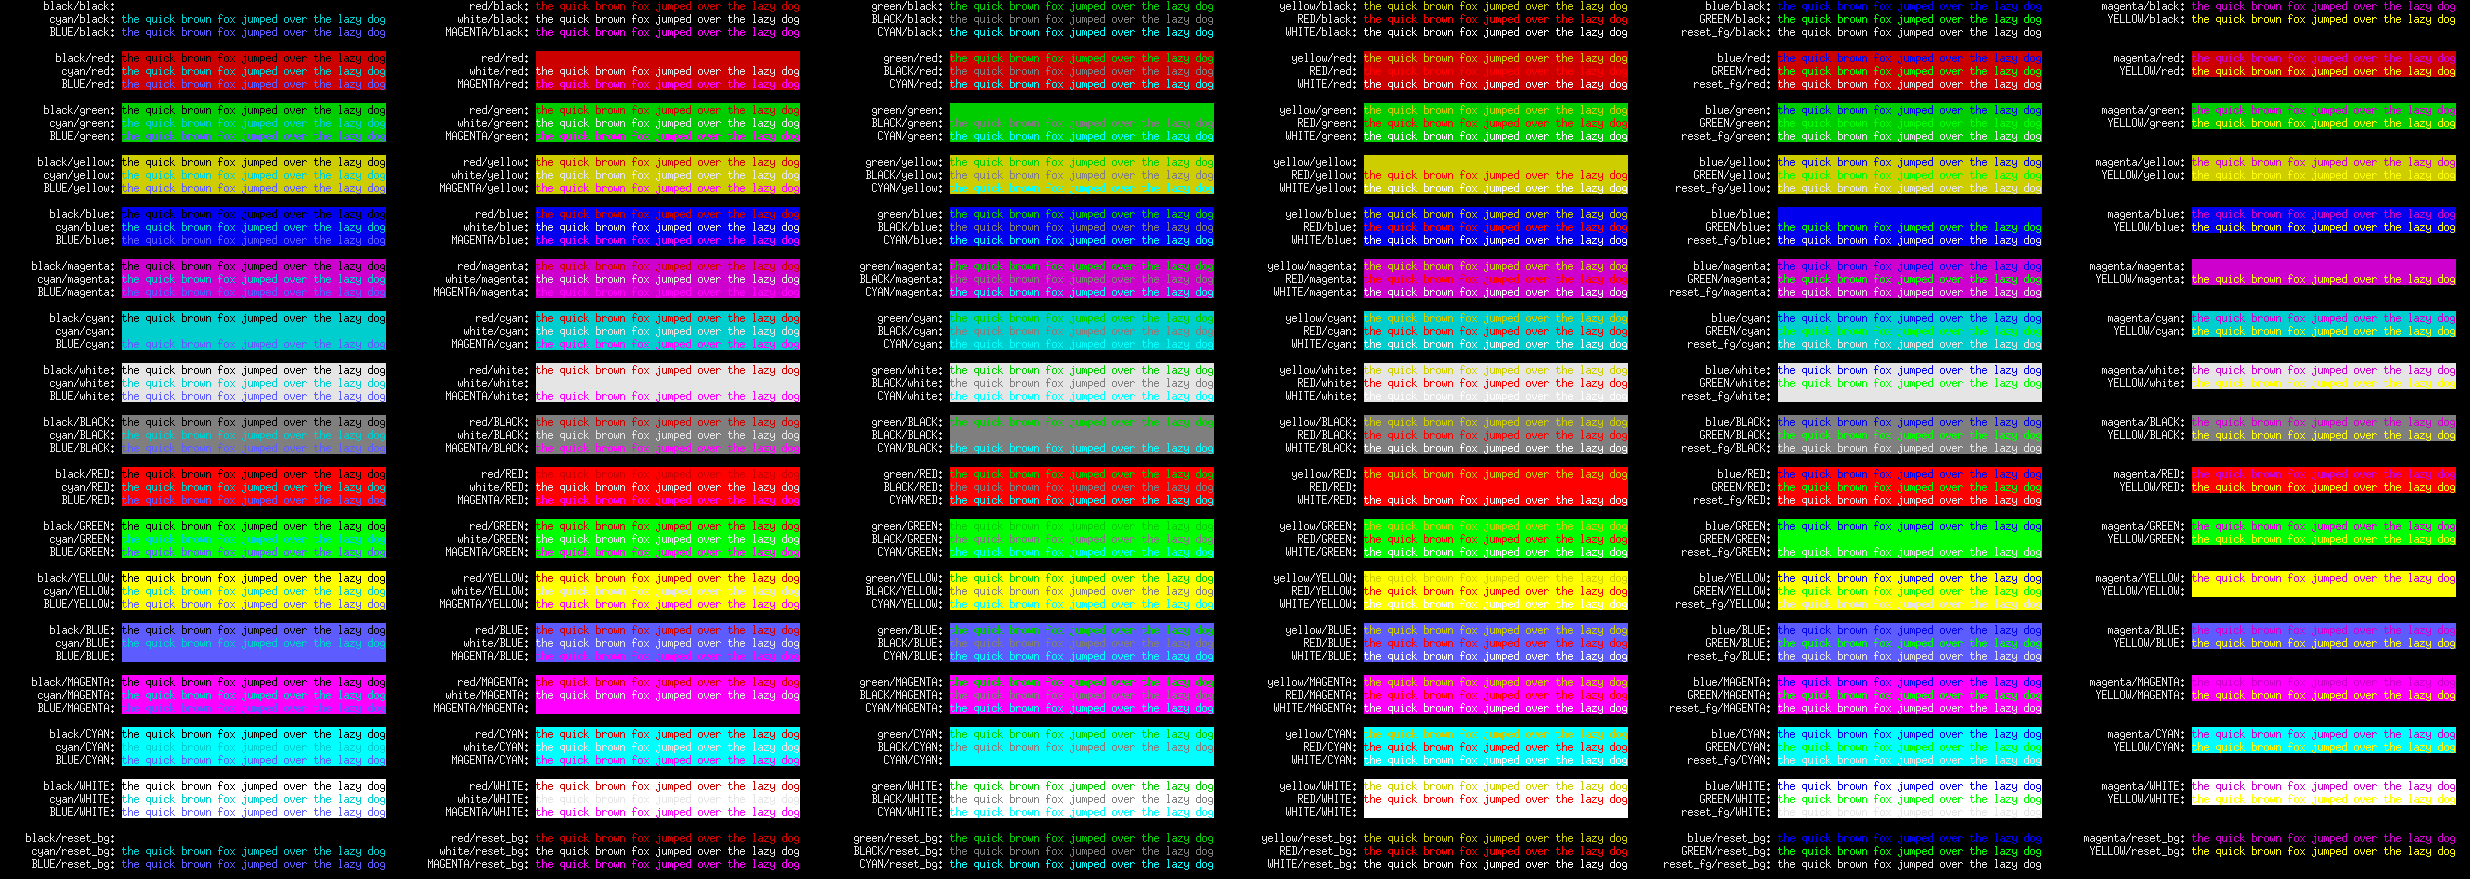
The demo program tdctm.awk includes 2 functions to show how the colors look like on the current terminal, test_colors_8bits() and test_colors(). For one, xterm renders them particularly well, brightly and very distinctively. Result may vary widely across the numerous terminal emulators on Linux.
Usually, modern terminals support 8-bit foreground and background colors, e.g.:
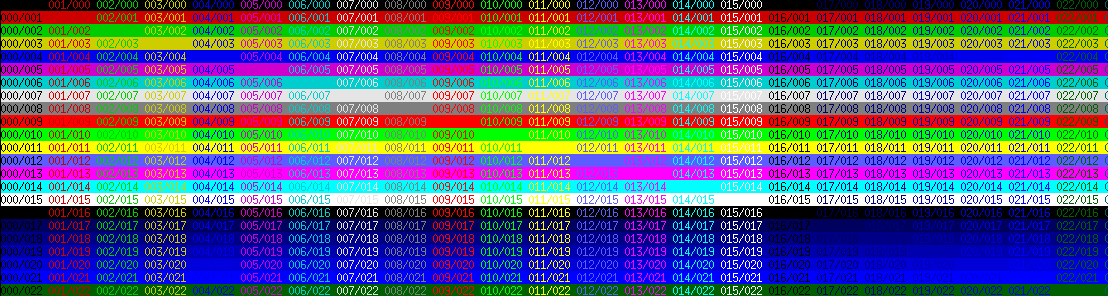
However, to simplify the interface, only the above color names are supported. Although fun, it doesn’t make much sense here to choose a color among its 256 shades.
An optional color alternation period can be specified through the following regular expression:
[-]{0-9}[.[-]{0-9}]
The first group of digits expresses for how many lines the specified foregound/background color should be used before being possibly reversed to background/foregound. If negative, foreground color is disabled and defaults to the terminal’s current default (white).
The second group, optional, expresses for how many lines the specified background/foregound color should be used. If negative, background color is disabled and defaults to the terminal’s current default (black).
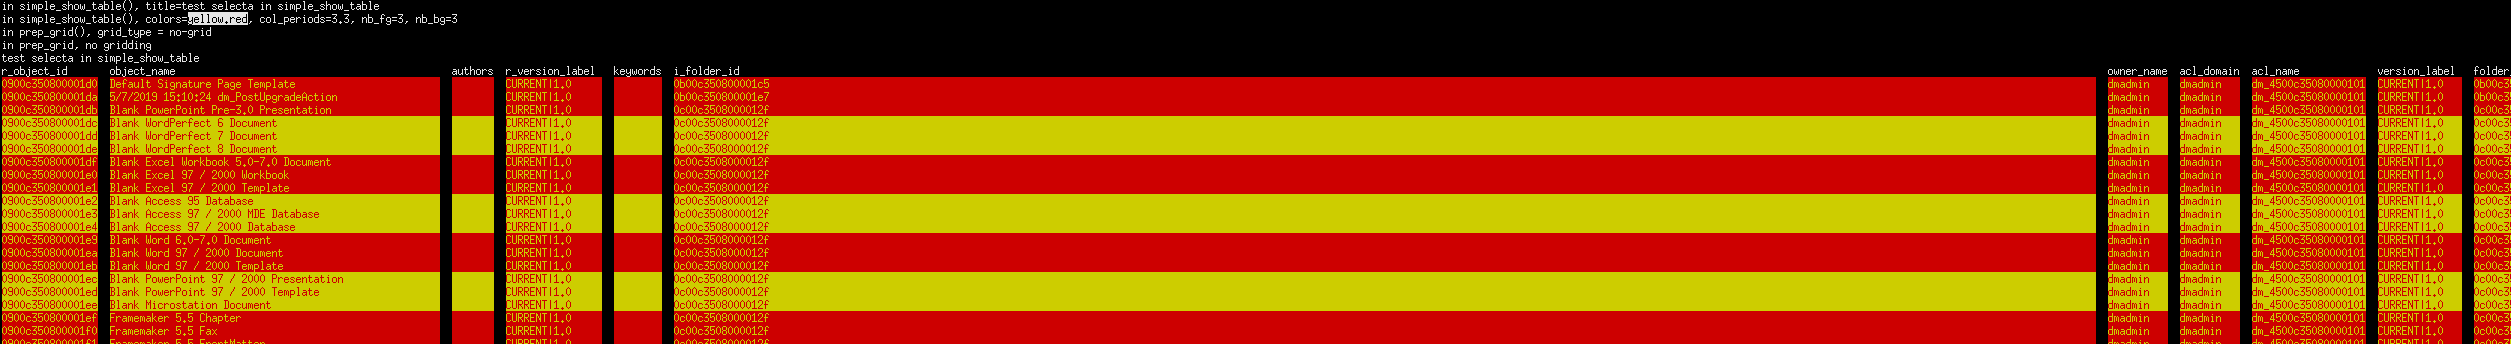
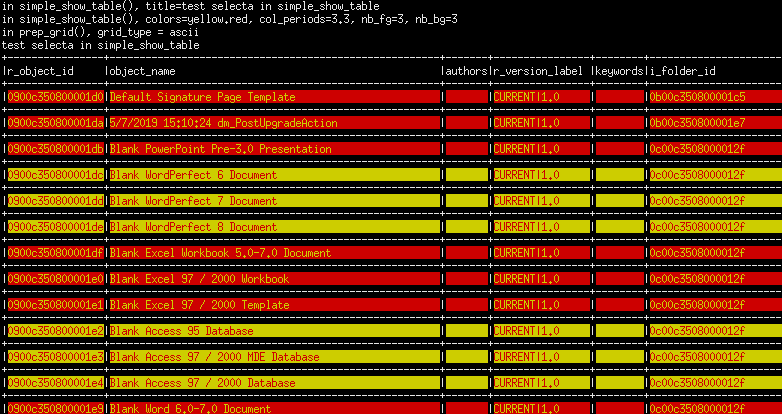
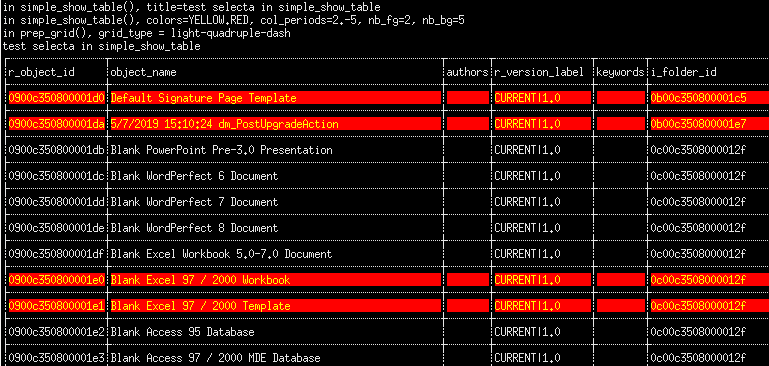
For example, we can request that the rows be displayed in yellow foreground and red background, and that this pattern be reversed every 3 lines, i.e 3 lines of yellow/red followed by 3 lines of red/yellow (set colors to the string “yellow.red” and col_periods to the string “3.3”).
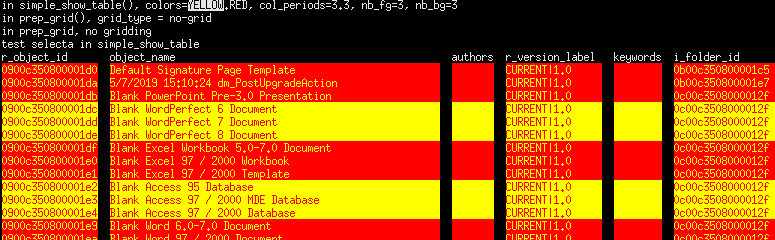
Same using BRIGHT colors:
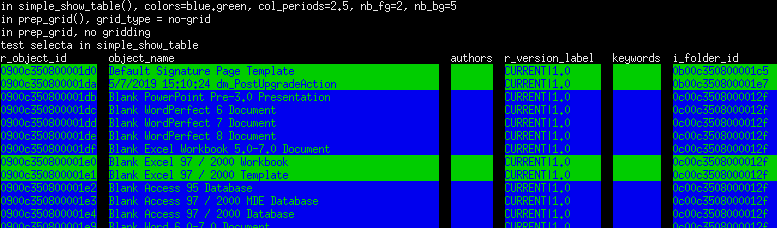
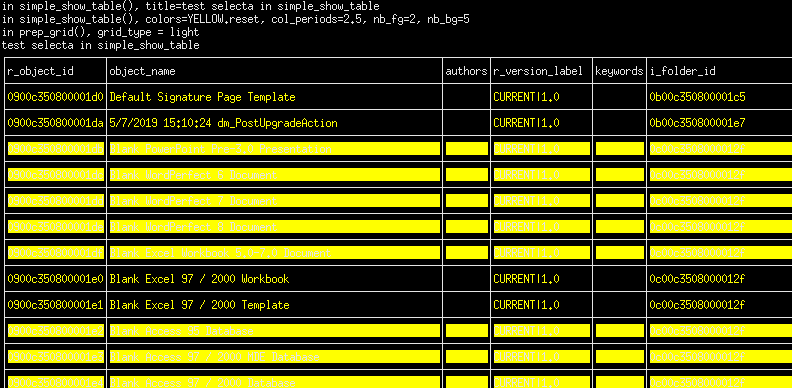
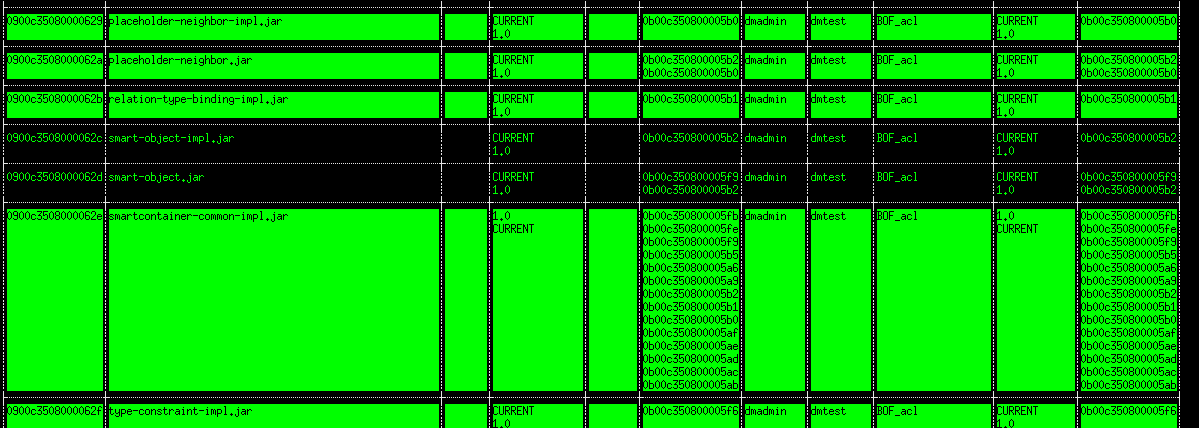
The 2 first lines could be printed in blue/green and the next 5 lines in green/blue (set colors to the string “blue.green” and col_periods to the string “2.5”).
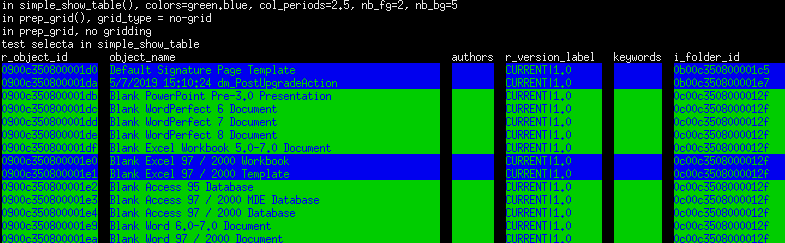
Or the reverse colors first (set colors to the string “green.blue”).
Or the first 2 lines in cyan/white, then the next 4 with the terminal’s default color (set colors to the string “cyan.white” and col_periods to the string “2.-4”).
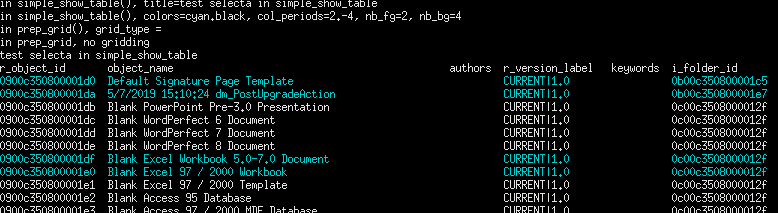
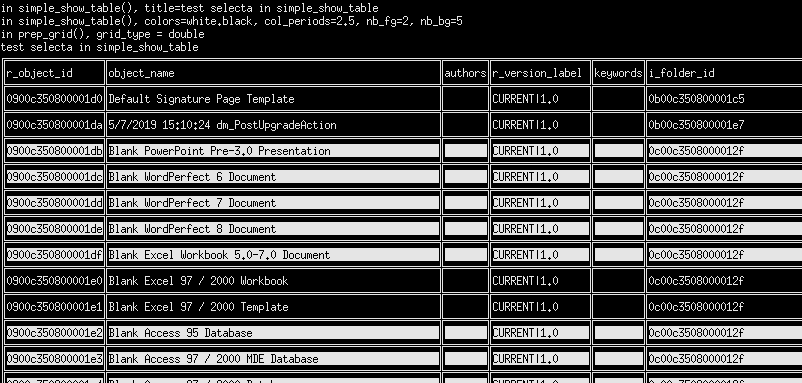
simple_show_table() first prints a line with the column headers. That line is not colorized in order to stand out from the data underneath (just a personal and arbitrary choice, nothing profound herer; it can be changed to something else still personal and arbitrary). If gridding is not wanted, columns are separated by 2 spaces.
The displayed table can also optionally be enclosed in a grid of various styles, currently 16 of them; here they are:
grid_types_str = "light light-double-dash light-triple-dash light-quadruple-dash heavy heavy-double-dash heavy-triple-dash heavy-quadruple-dash double hdouble-vsingle hsingle-vdouble light-with-round-corners ascii no-grid hheavy-vlight hlight-vheavy half-light"
Here is how they look like:
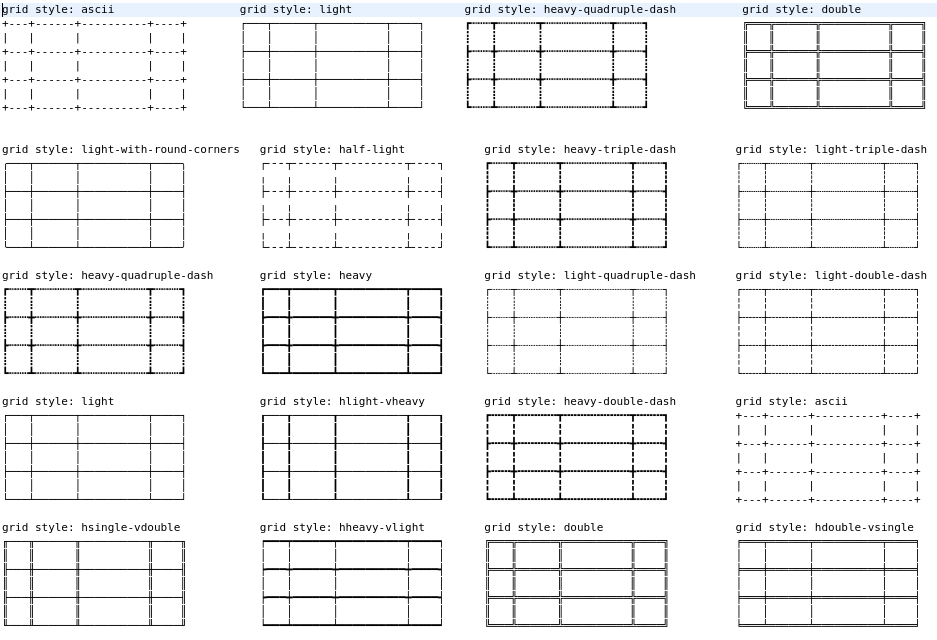
Function test_grid() in the demo program is invoked to show how they all look like, ranging from no-grid, ascii to the ones drawn with UTF-8 symbols, as most terminals support this standard nowadays. “ascii” grid style is the real universal one and doesn’t look that bad. The fancy UTF-8 ones are nice, although a bit too dense for our taste, even the “light” one, but it is a matter of personal preferences.
Here are a few examples of simple_show_table() with gridding:
The symbols’ UTF-8 codepoints are available from here UTF-8 Box Drawing. Only the most obvious ones have been used and there are far more possible combinations of symbols to draw even more eye-catching grids, so feel free to experiment and add new grid types to the above list.
The interface’s function init_grid_symbols() initializes an associative array containing the symbols and is invoked by the aforementioned test_grid() and by prep_grid(), the latter uses that array to initializes a grid’s top, middle and bottom lines subsequently used by the functions [simple_]show_table(); the former produces the output shown above to help chose a style from.
After the header line come the data. 2 nested loops navigate through the rows and the attributes in result[“data”][i][j], plus a third nested loop for multi-valued attributes in result[“data”][i][j][k], if any. Before they are printed, the data are optionally enclosed in cells and colorized. Note how the whole colorization logic previously discussed is implemented:
printf("%s%-s", !grid_type || "no-grid" == grid_type ? (j > 0 ? " " : "") : grid_art["ver_line"], colorize(s, colors && (i % (nb_fg + nb_bg)) >= nb_fg ? (!bno_inverse ? colors : "") : (bno_color ? "" : colors), colors && (i % (nb_fg + nb_bg)) >= nb_fg && !bno_inverse))
Really terse. This is what happens when one has too many drinks; that logic definitively deserves a better implementation.
As stated, simple_show_table() does not limit itself to the screen widths so a lot of wrapping around is expected from the terminal emulator for long lines. In order to still be able to make sense of all the mess on the screen, just pipe the output into the less command; use the -S -R arguments to prevent wrapping and to correctly interpret the ANSI color codes.
show_table()
# flexible tabular presentation of the result set in result;
# title is a string that is printed right before the table, if given;
# result is the associative array coming from dmSelecta(); see there for a description of its structure;
# maxw is the default maximum column width, applied to all columns unless it is superseded by requested_max_widths; if -1, requested_max_widths takes over; see below for precedence;
# if maxw is 0, display_width is used; it is the maximum allowed screen width; if 0, $COLUMNS is used and longer lines get wrapped around by the terminal emulation software; if 0, it is assumed to be unlimited, with possible wrap around;
# it looks like the environment variable $COLUMNS is not exported so child processes don't see it; gawk returns an empty string from ENVIRON["COLUMNS"]; to work around it, just execute an export COLUMNS=$COLUMNS e.g. in a wrapper bash script, before running an awk program that uses DctmAPI;
# requested_max_widths_str is a comma-separated list of explicitely requested positional column widths, possible empty and/or with gaps, superseding maxw, e.g. "10,15,,,8,12,," meaning 1st attribute to be displayed in a 10 character wide column, 2nd attribute in a 15 character wide column, 3rd attribute not limited, etc.. ;
# display_width is the screen width to allocate for the table; must be less or equal to the actual terminal's width to avoid wrapping around by the terminal; if 0, it defaults to the $COLUMNS environment variable;
# individual column widths are selected in this order of precedence:
#   maxw > 0, i.e. same width maxw for all the columns;
#   maxw = 0, display_width > 0: maxw will be set to max(default_min_col, int(screen_width/length(result["medatada"]["nb_cols"]))), with default_min_col = 1;
#   maxw = 0, display_width = 0: $COLUMNS is taken as display_width, same as above; if not set, maxw is set to the locally declared default_min_col variable;
#             when display_width is used, available space is allocated to columns as needed; e.g., if an attribute is empty in all the result set, it will receive no additional space; larger attributes will be allocated larger width; the idea is to minimize wrapping or truncation;
#   maxw = -1: requested_max_widths_str is used if not empty; missing values defaults to their respective result["medatada"]["max_col_length"][0...] value;
#              particular case: empty requested_max_widths_str; max column width defaults to result["medatada"]["max_col_length"][0...], i.e. the widest data of the respective column;
# when result["medatada"]["max_col_length"][0...] is used, obviously no truncation nor wrap around take place (except by the terminal) as the respective column widths are large enough for all their data, particularly for their largest datum;
# wrap_str is string containing a comma-separated list of booleans (value of 0 or 1) indicating if column at respective position has to be wrapped around or not;
# truncate_str is a string containing a comma-separated list of booleans (value of 0 or 1) indicating if column at respective position has to be truncated or not;
# wrapping is the default and has priority over truncating;
#    truncate=0 wrap=0 --> wrapping around;
#    truncate=0 wrap=1 --> wrapping around;
#    truncate=1 wrap=0 --> truncate;
#    truncate=1 wrap=1 --> wrapping around;
#    truncating is therefore only effective when explicitly and unambiguously requested; this is to preserve data integrity whenever possible;
# ellipsis string is only considered when truncating and defaults to '...'; thus, by default, there is always one to warn of truncation;
# that's a lot of fine tuning parameters and at first one may not want to spend time looking for some ideal value; for this reason, it is suggested to start with the following values:
# thus, a lazy and quick invocation is using the current screen width and possible column wrapping: show_table(title, result)
# the table will use up to the screen width as needed, with each attribute using up to result["medatada"]["max_col_length"][0...] characters, and wrapped around if too large;
# use an unlimited screen width, no wrapping, best used with | less -S -R: show_table(title, result, -1)
# further optimization can be done later on as needed;
# fg_color, bg_color are the respective foreground and background color of the displayed rows;
# col_periods (format: fg_period . bg_period) are the number of lines to display in the respective color before switching to bg_color/fg_color for that many lines; i.e. fg_period lines are displayed in fg_color/bf_color and then bg_period lines displayed in bg_color/fg_color, rinse, repeat;
# if fg_color or bg_color, or both, is negative, no respective colorization takes place;
# grid_type can be empty or contain one of the available values such as ascii, half-light, light, light-double-dash, etc...; see function init_grid_symbols();
function show_table(title, result, maxw, display_width, requested_max_widths_str, wrap_str, truncate_str, ellipsis, colors, col_periods, grid_type)
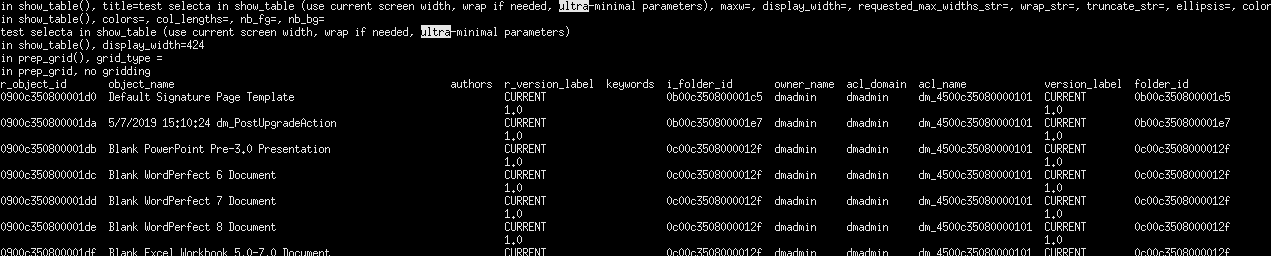
This function also outputs the result set from an in-memory array into a table on the screen with optional colorization and gridding, e.g.:

However, it goes into great lengths in attempting to shrink the table as much as possible to fit the screen size or the requested column widths. As showed by the above comments, it is also quite flexible with a long list of parameters. Fortunately, the parameters’ complexity can be somewhat alleviated by calling it with simple, sensible parameters’ values, or none at all, for a quick display and from there the presentation can be iteratively polished until the final result is found satisfactory.
show_table() takes the data to display from the associative array result, which has the same structure as used by function simple_show_table() above. When maxw is 0 (maxw stands for maximum widths), it checks whether a display_width is given; if so, it uses it, otherwise it uses the $COLUMNS environment variable to determine the screen width (note that $COLUMNS is not exported and therefore not visible in gawk‘s ENVIRON associative array; therefore, it must be explicitly exported with the bash command export $COLUMNS=$COLUMNS). It shares this screen width between all the attributes to display, narrowing the ones that don’t fit or that don’t need that much space, but never narrower than default_min_col (currently set to 5 characters). Still, the resulting line length can exceed the screen width but further optimizations are available, keep reading. So the simplest invocation of the function is:
show_table(title, result)
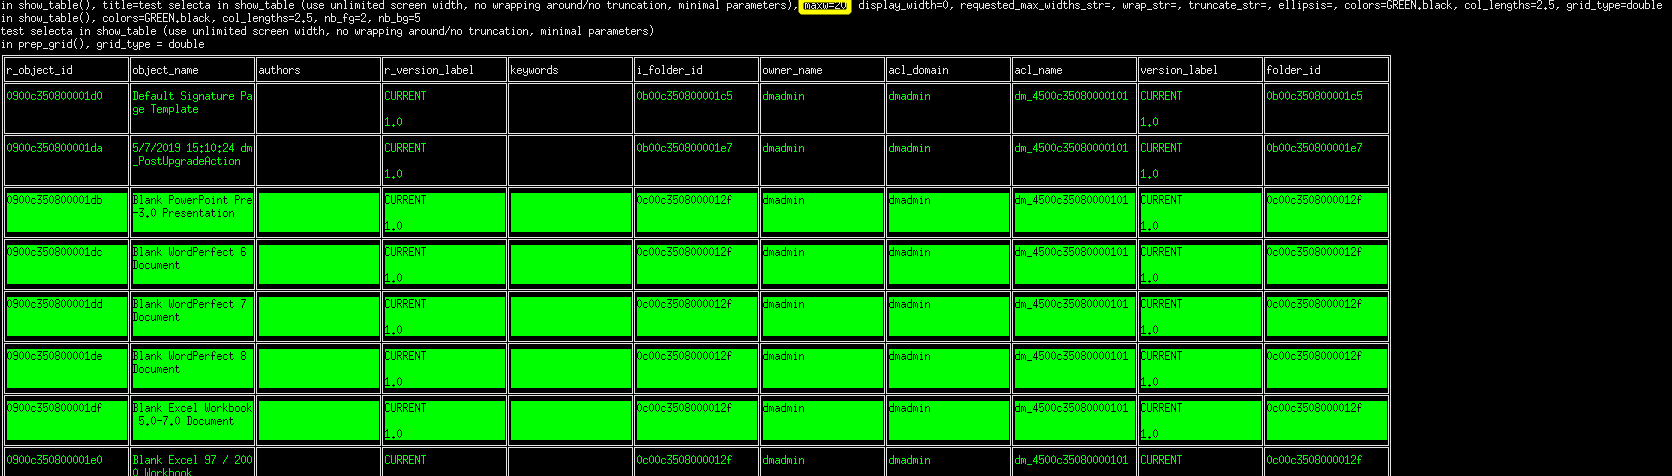
It is also possible to force a common width to be used for each of the attributes by setting maxw to a positive value, e.g.:
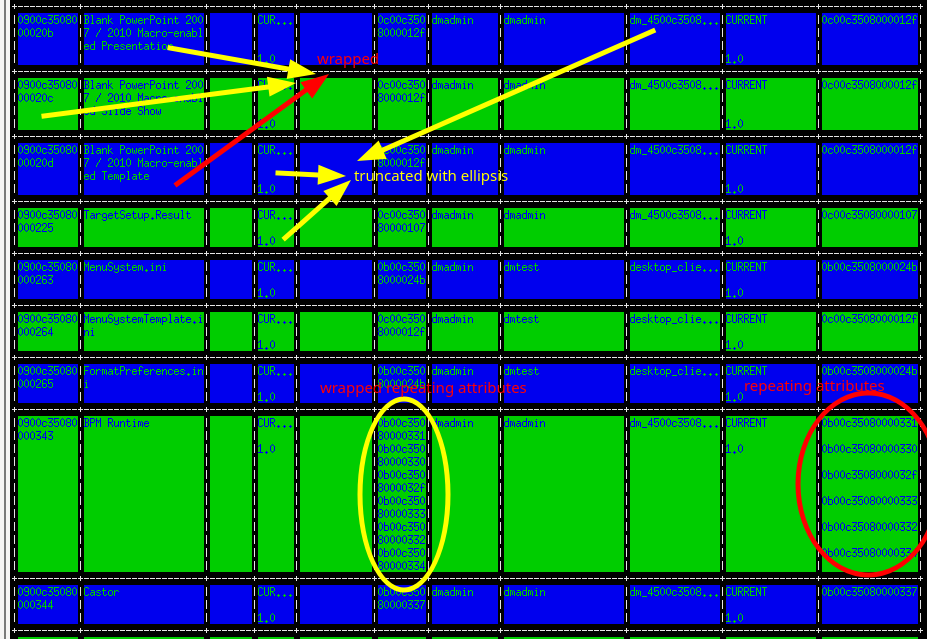
When raw is set -1 and no column sizing is specified in the parameter requested_max_widths_str, like in simple_show_table(), rows can be also printed in very long lines without explicit wrapping nor truncation but show_table() is smarter because it automatically wraps around repeating attributes yielding a tighter output in some cases, e.g.:
Here is a better output showing the call trace and their parameters:
If raw is set -1 and requested_max_widths_str are passed, the function uses them in the respective columns (the values in requested_max_widths_str are positional) and by default wraps around the attributes’ text if too large. Positional strings of values in parameters wrap_str and truncate_str allow to control how text that exceeds the cell width is treated, either wrapped around or truncated. wrap_str mimicks what Oracle’s sqlplus does when using the command col … format Ann, e.g.:
![]()
If the terminal wraps the output into an unreadable mess, just pipe it into less -S -R and consider wrapping or truncating the text. Once in less, use the arrays keys to scroll laterally, optionally preceded by a number of characters to scroll by that amount, e.g. 1➡.
The test program tdctm.awk already includes many examples of calls to both *show_table() functions; it can easily be used to test any parameter combination that best suit a particular result set.
Conclusion
The gawk interface to the Documentum API, DctmAPI for short, just went through some major surgery. It caught up with several enhancements that were presented in separate articles, sometimes implemented first in DctmAPI.py one year ago (see DctmAPI.py revisited), its python counterpart. A lot of attention has been brought to the presentation of result sets, which may seem a bit out of scope, but this makes sense because data get extracted either to be exported somewhere else for further processing or to be visualized on screen or in some report; since it is more convenient to be able to do so from the same place, the interface does both.
There is always room for improvement and this interface is no exception. Its usage will tell what it still lacks and how it will evolve. Any suggestions are welcome.
![Thumbnail [90x90]](https://www.dbi-services.com/blog/wp-content/uploads/2022/08/GME_web-min-scaled.jpg)