In Weblogic it is common to have this warning: ThreadPool has stuck threads. Here we will see a way to determine which can be the cause.
When monitoring Weblogic you can notice that time to time your servers are going in Warning mode. And when clicking on warnings you see this screen:
The reason is presented as “ThreadPool has stuck threads”. So it doesn’t help a lot. But we can have a deeper view and maybe a real cause.
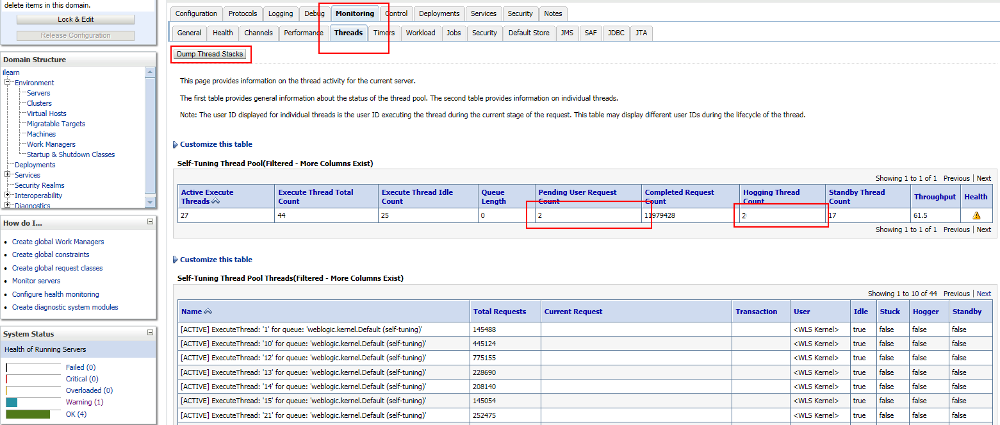
Now click on the server name from your list, then go to Monitoring -> Threads.
The Hogging Thread Count column shows how many threads seems stuck. The Pending User Request Count column shows the number of requests not delivered to the users. If it is different than 0 your users are impacted.
In order to visualize the real state of threads click on Dump Thread Stacks:
Some threads are marked as stuck whereas they aren’t. If the process handled by the thread is too long to achieve then Weblogic will detect it as stuck. By default Weblogic will detect stuck threads after 600 seconds (10 minutes) of waiting (This parameter can be changed).
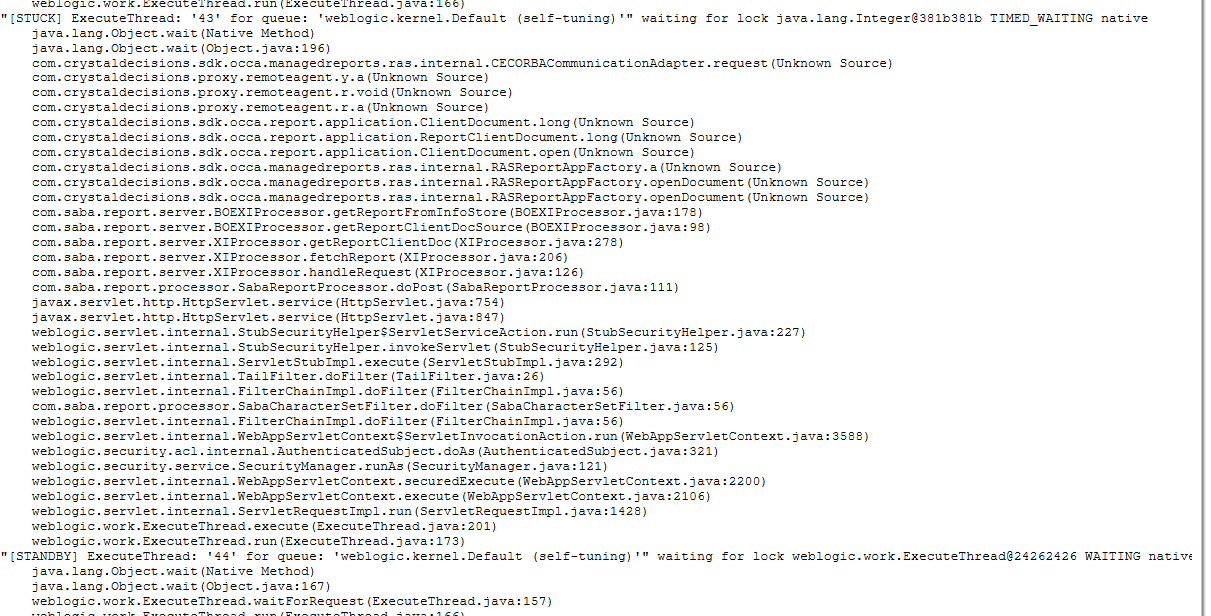
When the thread dump is displayed you can search for thread with STUCK status:
Here you can see that the thread is stuck in java.lang.Object.wait() function. It means that the thread is waiting for a result or another process to end. In this particular case we can see that the function com.crystaldecisions.sdk.occa.managedreports.ras.internal.CECORBACommunicationAdapter.request() was executed just before waiting, so the thread is likely to wait for the result for this “request” function.
As what we thought the issue came from a reporting server that could not deliver the reports anymore. That’s why we had some stuck threads.
Stuck threads are generally generated by the application itself or some other components which do not have to do with weblogic.
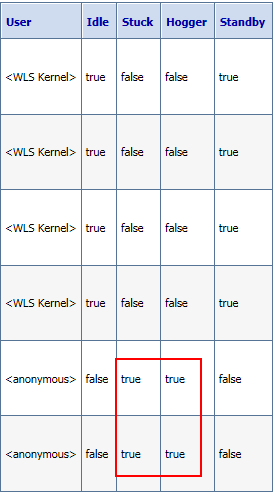
Last point, you can check if the thread is stuck in the previous view like this:


![Thumbnail [90x90]](https://www.dbi-services.com/blog/wp-content/uploads/2022/09/DDI_web-min-scaled.jpg)
![Thumbnail [90x90]](https://www.dbi-services.com/blog/wp-content/uploads/2025/05/JDE_Web-1-scaled.jpg)