
SQL Server 2014 is definitively designed for performance and I will try to demonstrate it during this blog post. I like to talk about hidden performance features because generally it does not require any changes for applications unlike in-memory tables for instance (aka hekaton tables).
Since SQL Server 2005 version some improvements have been made for tempdb. Tempdb caching is one of them and allows to reduce the page allocation contention. Basically to create a table SQL Server must first build the system catalog entries related to system pages. Then, SQL Server has to allocate an IAM page and find a mixed extent in an SGAM page to store data and mark it in the PFS page (as a reminder, by default mixed extent is chosen unless to force uniform extent by using the traceflag 1118). Finally the allocation process must be recorded to system pages. When a table is dropped SQL Server has to revert all it have done for creating the table. It implies some normal locks and latches during all the allocation process, same ones used for creating and dropping a temporary table. However in tempdb tables are created and dropped very quickly and it can generate page allocation contention especially for PFS, SGAM and GAM system pages (the famous PAGELATCH_UP wait type against the concerned pages). The bottom line is that SQL Server can cache some of the metadata and page allocations from temporary objects for easier and faster reuse with less contention.
In addition, to allow a temporary table to be cached it must be first used into a stored procedure but some situations can prevent this caching like:
- Using named constraints
- Using DDL after the temporary table creation
- Create a table in a different scope
- Using a stored procedure with recompile option
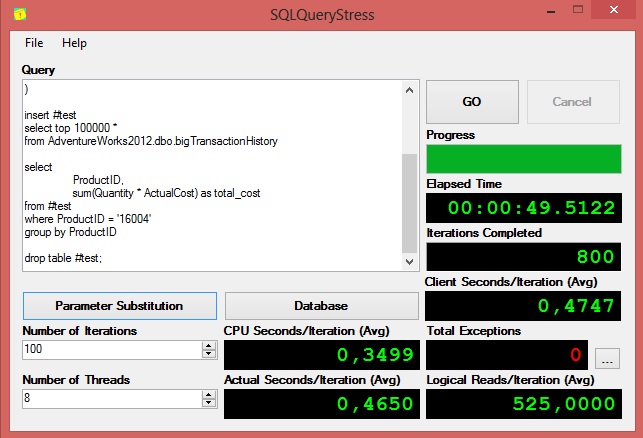
By executing the following T-SQL script with SQLQueryStress we can easily show that temporary tables are not reused by SQL Server.
I used 8 concurrent threads with 100 iterations during this test.
In the same time, I enabled the following perfmon counters:
|
Counter name |
Min value |
avg value |
Max value |
|
Average latch wait time (ms) |
1,043 |
3,327 |
7,493 |
|
Latch wait / sec |
110,014 |
242,468 |
965,508 |
|
Temp tables creation rate / sec |
4,001 |
16 |
21,146 |
|
Cache objects in Use |
0 |
0 |
0 |
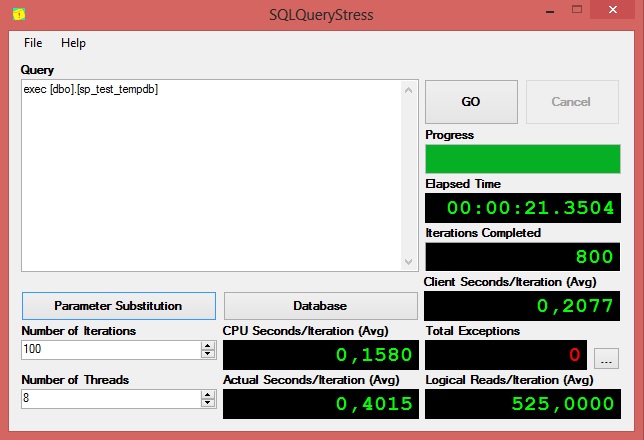
Now if I rewrite the same ad-hoc T-SQL statement into a stored procedure and then I perform the same test we can notice some speed improvements:
|
counter name |
min value |
avg value |
Max value |
|
Average latch wait time (ms) |
0 |
0,855 |
1,295 |
|
Latch wait / sec |
0 |
4405,145 |
5910,304 |
|
Temp tables creation rate / sec |
0 |
0 |
0 |
|
Cache objects in Use |
0 |
7,048 |
8 |
As expected, this improvement is due to the tempdb caching mechanism. We can notice here that SQL Server reuses caching objects (“Cache objects in Use” counter > 0) that are in fact the temporary table into the stored procedure. Using caching objects decrease drastically the temporary table creation rate (Temp Tables creation rate / sec is equal to 0 here).
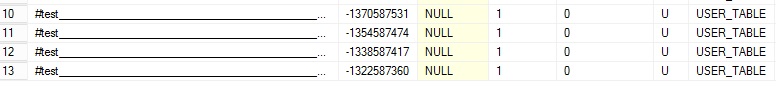
The cached objects themselves are visible by using the system table sys.tables in the tempdb context. For example during the first test we can easily observe that SQL Server does not deallocate completely a temporary table used into a stored procedure. The relationship can be made with the object id column value with a negative number. When SQL Server uses a temporary table the name of table is #test and when SQL Server doesn’t use it without deallocating the associated pages the name is composed of a 8-character hexadecimal string that maps in fact to the object id value. #AF42A2AE is the hexadecimal representation of the #test temporary table with the object id equal to -1354587474.
…
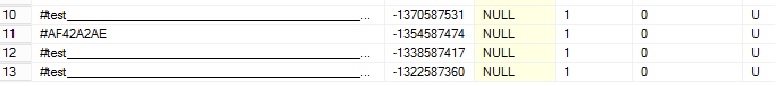
Furthermore we can notice several records in the above results because I used SQLQueryStress with 8 concurrent threads that imply concurrent executions of the stored procedure with separate cached objects in tempdb. We can see 4 records (I didn’t show completely the entire result here) but in fact we retrieved 8 records.
As I said earlier, DDL statements after the creation of the temporary table inhibits the ability to cache the temporary objects by SQL Server and can decrease the global performance of the stored procedure (we can ask here what is a DDL statement .. because DROP TABLE #table is apparently not considered as such because tempdb caching mechanism is not impacted). In my sample, SQL Server proposes to create the following index on the ProductID column to improve the query statement:
Go ahead, we trust SQL Server and we will add the creation of the index after the creation of the temporary table into the stored procedure:
However, the result is not as good as we would expect …
If we take a look at the perfmon counters values:
|
Counter name |
min value |
avg value |
Max value |
|
Average latch wait time (ms) |
0,259 |
0,567 |
0,821 |
|
Latch wait / sec |
0 |
2900 |
4342 |
|
Temp tables creation rate / sec |
3,969 |
5,09 |
8,063 |
|
temp tables for destruction |
0 |
27,02 |
58 |
|
Cache objects in Use |
6 |
7,9 |
8 |
For this test I added a new perfmon counter: temp tables for destruction that indicates clearly that the temporary tables will be destroyed by SQL Server because they cannot be used in this case: the index creation DDL prevents the tempdb caching mechanism.
Here comes a new SQL Server 2014 feature that introduces a new way for declaring nonclustered indexes directly into the table creation DDL which can be a good workaround to the preceding test.
After running the test we can notice that the temp tables creation rate and temp tables for destruction counters value are again equal to zero. SQL Server used the temporary table during the testing as showing the “Cache objects in User” counter.
|
Counter name |
min value |
avg value |
Max value |
|
Average latch wait time (ms) |
0 |
0,262 |
0,568 |
|
Latch wait / sec |
0 |
1369 |
3489 |
|
Temp tables creation rate / sec |
0 |
5,09 |
8,063 |
|
temp tables for destruction |
0 |
0 |
0 |
|
Cache objects in Use |
6 |
7,9 |
8 |
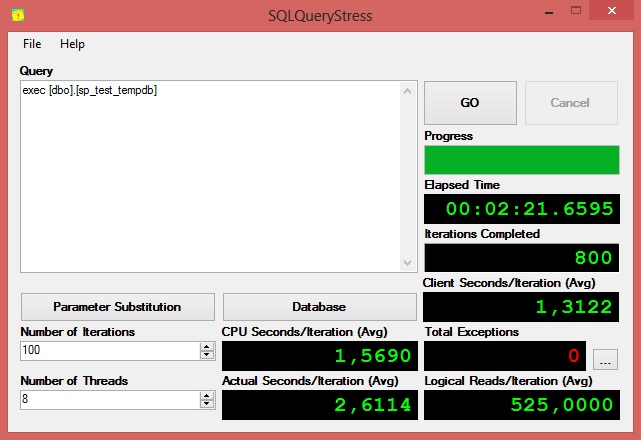
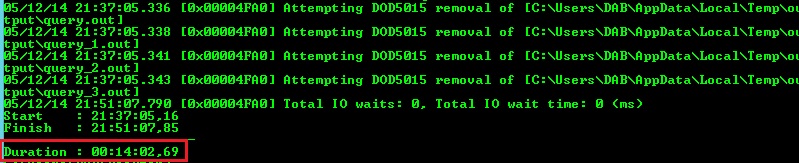
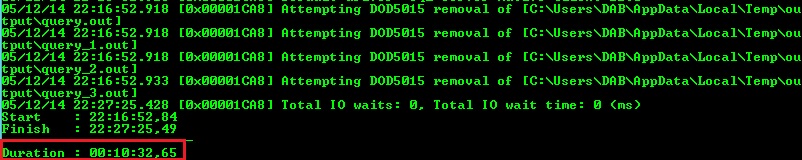
However if we can still use the tempdb caching mechanism with SQL Server 2014 and this new tips the above result is contrasted with the total duration of execution as showed by the following picture:
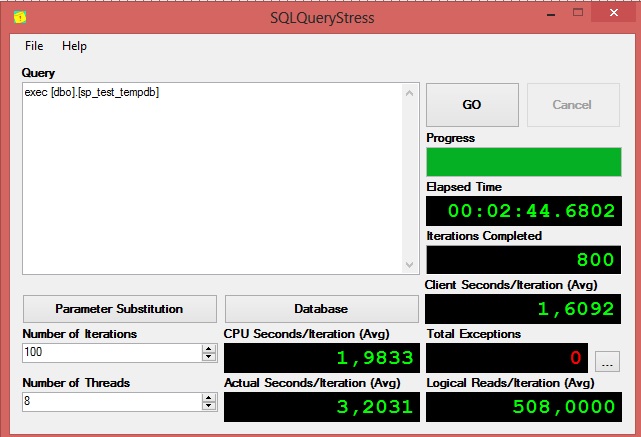
The global execution time is larger than the test first with the stored procedure, the temporary table without any nonclustered index (02:44 vs 00:21) in my case. This is because inserting data into a table with a nonclustered index can take more time than a table without any indexes but in a real production environment we will probably encounter situations where the cost for inserting data into a table with an index would be substantial compared to the gain made for the following readings. If you have some examples please feel free to share with us 😀
Another interesting feature since many versions is the concept of eager writes that prevent flooding the buffer pool with pages that are newly created, from bulk activities, and need to be written to disk. Eager write is another background process that helps to reduce the pressure of the well-known lazy writes and checkpoint background processes as well as increasing the IO performance by gathering pages before writing to disk. Basically, SQL Server tracks these pages into a circular list in memory. When the list is full old entries are removed by writing them to disk if still dirty.
Let me show you with the following T-SQL script on the SQL Server 2012 instance. I used the traceflag 3917 to show eager writes activity (thanks to Bod Dorr for this tip).
Below a sample of the SQL Server error log:
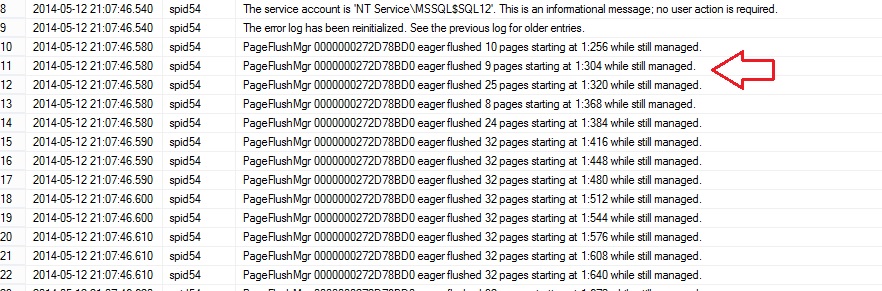
We can notice that SQL Server writes up contiguous 32 dirty pages to disk in my test.
Even if this process is optimized to write pages efficiently to disk, we have still IO activity. SQL Server 2014 enhances this process by relaxing the need to flush these pages to disk as quickly as the older versions. SQL Server recognizes the bulk activity and the concerned pages are loaded, queried and released without any flushing disk activity.
The same test performed on the SQL Server 2014 environment gives the following result:
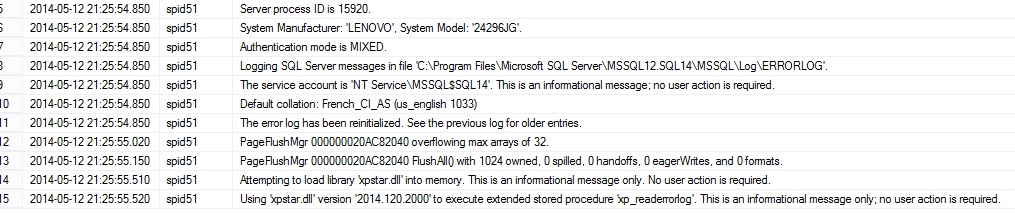
The eager write process was not triggered this time. So let’s compare with a simulating workload by using ostress this time. Ostress is a stress tool provided by the RML utilities. This time I used ostress with 4 threads and 1000 iterations each. SQLQueryStress generated a bunch of ASYNC_IO_NETWORK during my tests which potentially distorts the final result.
So, I used the following script for the both environment (SQL Server 2012 and SQL Server 2014):
“C:Program FilesMicrosoft CorporationRMLUtilsostress.exe” -Slocalhost -dAdventureWorks2012 -Q”exec dbo.sp_test_tempdb_2″ -n4 -r1000 -N –q
SQL Server 2012
… the corresponding io file stats:

… and the corresponding wait types:
|
Wait type |
Total wait ms |
Total wait count |
Avg wait time ms |
|
PAGEIOLATCH_UP |
452737834 |
3333841 |
135 |
|
PAGEIOLATCH_EX |
343071451 |
4696853 |
73 |
|
PREEMPTIVE_OS_ENCRYPTMESSAGE |
929 |
29527 |
0 |
|
PAGELATCH_SH |
603 |
201 |
3 |
SQL Server 2014
…

…
Wait type
Total wait
ms
Total wait count
By David Barbarin
![Thumbnail [60x60]](https://www.dbi-services.com/blog/wp-content/uploads/2022/12/microsoft-square.png)
![Thumbnail [90x90]](https://www.dbi-services.com/blog/wp-content/uploads/2022/09/DDI_web-min-scaled.jpg)