Now that we’ve configured our storage in the last post, it is time to benchmark the system. One popular tool when it comes to benchmarking PostgreSQL is pgbench. This can be used in our setup as well, and if you have installed the CloudNativePG kubectl plugin this is quite easy to use.
Of course the cluster needs to be already deployed for this to work. For your reference here is the latest configuration we’ve used (you will also need to complete the storage configuration for this):
apiVersion: postgresql.cnpg.io/v1
kind: Cluster
metadata:
  name: my-pg-cluster
spec:
  instances: 3

  bootstrap:
    initdb:
      database: db1
      owner: db1
      dataChecksums: true
      walSegmentSize: 32
      localeCollate: 'en_US.utf8'
      localeCType: 'en_US.utf8'
      postInitSQL:
      - create user db2
      - create database db2 with owner = db2
  storage:
    pvcTemplate:
      accessModes:
        - ReadWriteOnce
      resources:
        requests:
          storage: 1Gi
      storageClassName: openebs-lvmpv
      volumeMode: Filesystem
Once the cluster is up and running:
k8s@k8s1:~$ kubectl get cluster
NAME            AGE   INSTANCES   READY   STATUS                     PRIMARY
my-pg-cluster   24m   3           3       Cluster in healthy state   my-pg-cluster-1
… we can ask the kubectl plugin to create a job definition with all the default values (the “–dry-run” switch is what you need if you want to have the definition instead of executing the job directly):
k8s@k8s1:~$ kubectl-cnpg pgbench my-pg-cluster --dry-run
apiVersion: batch/v1
kind: Job
metadata:
  creationTimestamp: null
  labels:
    pbBenchJob: my-pg-cluster
  name: my-pg-cluster-pgbench-499767
  namespace: default
spec:
  template:
    metadata:
      creationTimestamp: null
      labels:
        pbBenchJob: my-pg-cluster
    spec:
      containers:
      - command:
        - pgbench
        env:
        - name: PGHOST
          value: my-pg-cluster-rw
        - name: PGDATABASE
          value: app
        - name: PGPORT
          value: "5432"
        - name: PGUSER
          valueFrom:
            secretKeyRef:
              key: username
              name: my-pg-cluster-app
        - name: PGPASSWORD
          valueFrom:
            secretKeyRef:
              key: password
              name: my-pg-cluster-app
        image: ghcr.io/cloudnative-pg/postgresql:16.3
        imagePullPolicy: Always
        name: pgbench
        resources: {}
      restartPolicy: Never
status: {}
Using this template, we can easily create a modified template which initializes a standard pgbench schema:
apiVersion: batch/v1
kind: Job
metadata:
  creationTimestamp: null
  labels:
    pbBenchJob: my-pg-cluster
  name: initjob
  namespace: default
spec:
  template:
    metadata:
      creationTimestamp: null
      labels:
        pbBenchJob: my-pg-cluster
    spec:
      containers:
      - args:
        - --initialize
        - --scale
        - "10"
        - --user
        - db1
        command:
        - pgbench
        env:
        - name: PGHOST
          value: my-pg-cluster-rw
        - name: PGDATABASE
          value: db1
        - name: PGPORT
          value: "5432"
        - name: PGUSER
          valueFrom:
            secretKeyRef:
              key: username
              name: my-pg-cluster-app
        - name: PGPASSWORD
          valueFrom:
            secretKeyRef:
              key: password
              name: my-pg-cluster-app
        image: ghcr.io/cloudnative-pg/postgresql:16.3
        imagePullPolicy: Always
        name: pgbench
        resources: {}
      restartPolicy: Never
status: {}
Creating this job will result in 1000000 rows in the pgbench_accounts table:
k8s@k8s1:~$ kubectl apply -f pgbench-init.yaml
job.batch/initjob created
k8s@k8s1:~$ kubectl logs jobs/initjob
dropping old tables...
NOTICE:  table "pgbench_accounts" does not exist, skipping
NOTICE:  table "pgbench_branches" does not exist, skipping
NOTICE:  table "pgbench_history" does not exist, skipping
NOTICE:  table "pgbench_tellers" does not exist, skipping
creating tables...
generating data (client-side)...
100000 of 1000000 tuples (10%) done (elapsed 0.04 s, remaining 0.40 s)
200000 of 1000000 tuples (20%) done (elapsed 0.17 s, remaining 0.67 s)
300000 of 1000000 tuples (30%) done (elapsed 0.24 s, remaining 0.56 s)
400000 of 1000000 tuples (40%) done (elapsed 0.92 s, remaining 1.38 s)
500000 of 1000000 tuples (50%) done (elapsed 0.96 s, remaining 0.96 s)
600000 of 1000000 tuples (60%) done (elapsed 1.09 s, remaining 0.73 s)
700000 of 1000000 tuples (70%) done (elapsed 1.28 s, remaining 0.55 s)
800000 of 1000000 tuples (80%) done (elapsed 1.85 s, remaining 0.46 s)
900000 of 1000000 tuples (90%) done (elapsed 2.16 s, remaining 0.24 s)
1000000 of 1000000 tuples (100%) done (elapsed 2.87 s, remaining 0.00 s)
vacuuming...
creating primary keys...
done in 5.97 s (drop tables 0.00 s, create tables 0.20 s, client-side generate 3.87 s, vacuum 0.77 s, primary keys 1.12 s).
Once we have that in place, we can create another job definition which is running a pgbench benchmark against the initialized schema from above:
apiVersion: batch/v1
kind: Job
metadata:
  creationTimestamp: null
  labels:
    pbBenchJob: my-pg-cluster
  name: runjob
  namespace: default
spec:
  template:
    metadata:
      creationTimestamp: null
      labels:
        pbBenchJob: my-pg-cluster
    spec:
      containers:
      - args:
        - --jobs
        - "2"
        - --progress
        - "1"
        - --time
        - "10"
        - --user
        - db1
        command:
        - pgbench
        env:
        - name: PGHOST
          value: my-pg-cluster-rw
        - name: PGDATABASE
          value: db1
        - name: PGPORT
          value: "5432"
        - name: PGUSER
          valueFrom:
            secretKeyRef:
              key: username
              name: my-pg-cluster-app
        - name: PGPASSWORD
          valueFrom:
            secretKeyRef:
              key: password
              name: my-pg-cluster-app
        image: ghcr.io/cloudnative-pg/postgresql:16.3
        imagePullPolicy: Always
        name: pgbench
        resources: {}
      restartPolicy: Never
status: {}
Apply this and then have a look at the numbers pgbench is reporting:
k8s@k8s1:~$ kubectl apply -f pgbench-run.yaml
job.batch/runjob created
k8s@k8s1:~$ kubectl logs jobs/runjob
pgbench (16.3 (Debian 16.3-1.pgdg110+1))
starting vacuum...end.
progress: 1.0 s, 731.0 tps, lat 1.354 ms stddev 0.822, 0 failed
progress: 2.0 s, 902.0 tps, lat 1.108 ms stddev 0.299, 0 failed
progress: 3.0 s, 803.0 tps, lat 1.245 ms stddev 0.496, 0 failed
progress: 4.0 s, 586.0 tps, lat 1.706 ms stddev 4.838, 0 failed
progress: 5.0 s, 878.0 tps, lat 1.139 ms stddev 0.287, 0 failed
progress: 6.0 s, 851.9 tps, lat 1.172 ms stddev 0.423, 0 failed
progress: 7.0 s, 683.0 tps, lat 1.465 ms stddev 1.197, 0 failed
progress: 8.0 s, 911.0 tps, lat 1.097 ms stddev 0.967, 0 failed
progress: 9.0 s, 638.0 tps, lat 1.562 ms stddev 6.578, 0 failed
progress: 10.0 s, 277.0 tps, lat 3.620 ms stddev 8.508, 0 failed
transaction type: <builtin: TPC-B (sort of)>
scaling factor: 10
query mode: simple
number of clients: 1
number of threads: 1
maximum number of tries: 1
duration: 10 s
number of transactions actually processed: 7262
number of failed transactions: 0 (0.000%)
latency average = 1.375 ms
latency stddev = 3.013 ms
initial connection time = 9.886 ms
tps = 726.884434 (without initial connection time)
Compare this against the numbers you get from other environments (virtual machines or bare metal) to get an idea about how well your Kubernetes deployment is performing. This should be your first driver for deciding if your setup is good enough for what you want to achieve.
Another option which comes with the cnpg kubectl plugin is to run a fio benchmark. In very much the same way as above, you can ask the plugin to create a template:
k8s@k8s1:~$ kubectl cnpg fio fio -n default --storageClass openebs-lvmpv --pvcSize 1Gi --dry-run > fio.yaml
… which gives you this definition (the result is a persistent volume claim, a config map which provides the configuration and a deployment, all with the default values):
apiVersion: v1
kind: PersistentVolumeClaim
metadata:
  creationTimestamp: null
  name: fio
  namespace: default
spec:
  accessModes:
  - ReadWriteOnce
  resources:
    requests:
      storage: 1Gi
  storageClassName: openebs-lvmpv
status: {}
---
apiVersion: v1
data:
  job: |-
    [read]
        direct=1
        bs=8k
        size=1G
        time_based=1
        runtime=60
        ioengine=libaio
        iodepth=32
        end_fsync=1
        log_avg_msec=1000
        directory=/data
        rw=read
        write_bw_log=read
        write_lat_log=read
        write_iops_log=read
kind: ConfigMap
metadata:
  creationTimestamp: null
  name: fio
  namespace: default
---
apiVersion: apps/v1
kind: Deployment
metadata:
  creationTimestamp: null
  name: fio
  namespace: default
spec:
  selector:
    matchLabels:
      app.kubernetes.io/instance: fio
      app.kubernetes.io/name: fio
  strategy: {}
  template:
    metadata:
      creationTimestamp: null
      labels:
        app.kubernetes.io/instance: fio
        app.kubernetes.io/name: fio
    spec:
      affinity:
        podAntiAffinity:
          requiredDuringSchedulingIgnoredDuringExecution:
          - labelSelector:
              matchExpressions:
              - key: app
                operator: In
                values:
                - fio
            topologyKey: kubernetes.io/hostname
      containers:
      - env:
        - name: JOBFILES
          value: /job/job.fio
        - name: PLOTNAME
          value: job
        image: wallnerryan/fiotools-aio:latest
        name: fio
        ports:
        - containerPort: 8000
        readinessProbe:
          initialDelaySeconds: 60
          periodSeconds: 10
          tcpSocket:
            port: 8000
        resources:
          requests:
            cpu: "1"
            memory: 100M
        securityContext:
          allowPrivilegeEscalation: false
          capabilities:
            drop:
            - ALL
          readOnlyRootFilesystem: true
          runAsGroup: 10001
          runAsNonRoot: true
          runAsUser: 10001
          seccompProfile:
            type: RuntimeDefault
        volumeMounts:
        - mountPath: /data
          name: data
        - mountPath: /job
          name: job
        - mountPath: /tmp/fio-data
          name: tmp
      securityContext:
        fsGroup: 10001
      volumes:
      - name: data
        persistentVolumeClaim:
          claimName: fio
      - configMap:
          items:
          - key: job
            path: job.fio
          name: fio
        name: job
      - emptyDir: {}
        name: tmp
status: {}
---
If you want to change fio parameters, then do it in the config map. Once you apply this and wait for a few minutes (run time is 60), the status should be this:
k8s@k8s1:~$ kubectl get deployments
NAME   READY   UP-TO-DATE   AVAILABLE   AGE
fio    1/1     1            1           2m18s
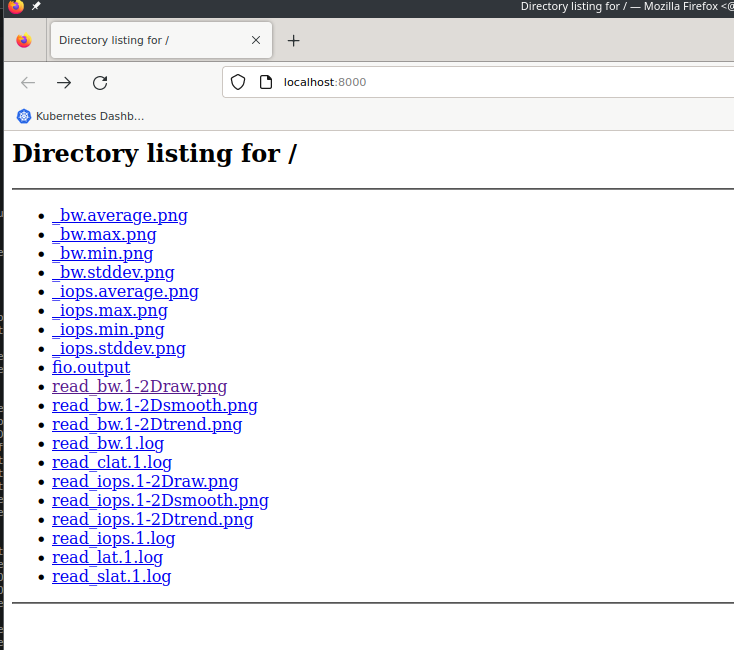
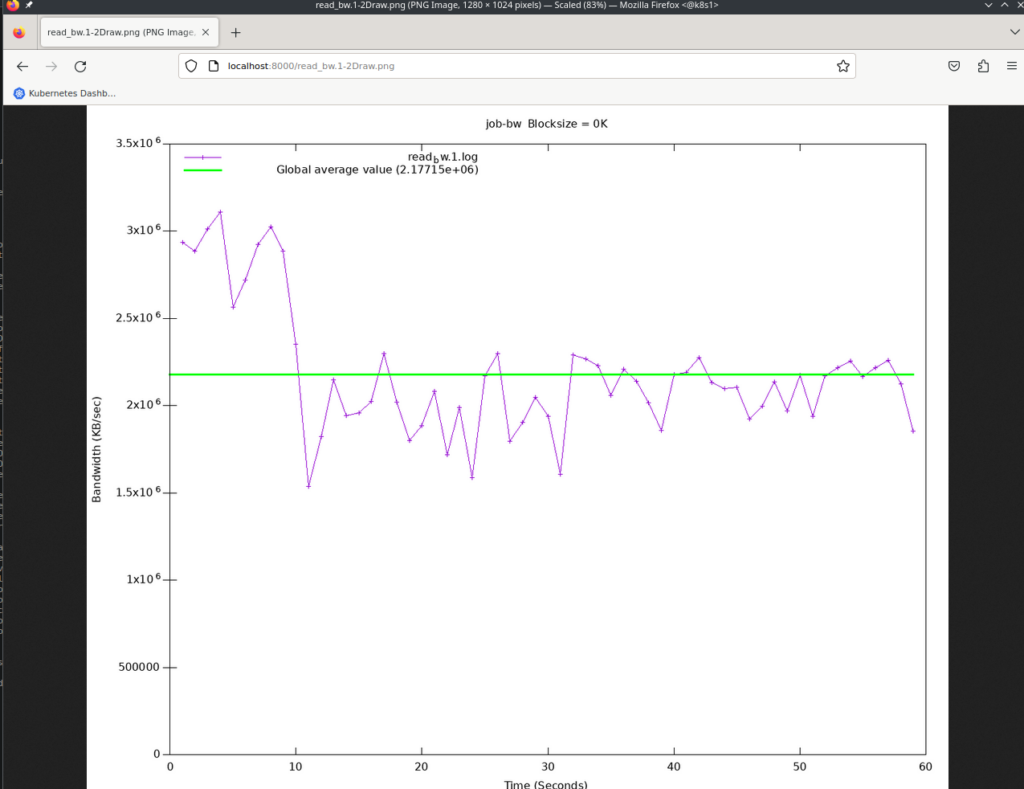
The results of the benchmark can be seen by creating a port forwarding and pointing a browser to http://localhost:8000/.
k8s@k8s1:~$ kubectl port-forward -n default deployment/fio 8000
Forwarding from 127.0.0.1:8000 -> 8000
Forwarding from [::1]:8000 -> 8000


The same applies here: Compare that to the numbers you get from other environments and then decide if you are good enough.
To delete the complete deployment use this command:
k8s@k8s1:~kubectl cnpg fio fio --dry-run | kubectl delete -f - -
persistentvolumeclaim "fio" deleted
configmap "fio" deleted
deployment.apps "fio" deleted
In the next post we’ll look at how you can connect external applications to this PostgreSQL cluster.
![Thumbnail [60x60]](https://www.dbi-services.com/blog/wp-content/uploads/2022/08/DWE_web-min-scaled.jpg)