PostgreSQL, like all other database engines, modifies the table and index blocks in shared buffers. People think that the main goal of buffered reads is to act as a cache to avoid reading from disk. But that’s not the main reason as this is not mandatory. For example PostgreSQL expects that the filesystem cache is used. The primary goal of shared buffers is simply to share them because multiple sessions may want to read a write the same blocks and concurrent access is managed at block level in memory. Without shared buffers, you would need to lock a whole table. Most of the database engines use the shared buffers for caching. Allocating more memory can keep the frequently used blocks in memory rather than accessing disk. And because they manage the cache with methods suited to the database (performance and reliability) they don’t need another level of cache and recommend direct I/O to the database files. But not with Postgres. In order to keep the database engine simple and portable, PostgreSQL relies on the filesystem cache. For example, no multiblock read is implemented. Reading contiguous blocks should be optimized by the filesystem read-ahead.
But this simplicity of code implies a complexity for configuring a PostgreSQL database system. How much to set for the shared_buffers? And how much to keep free in the OS to be used for the filesystem cache?
I am not giving any answer here. And I think there is, unfortunately, no answer. The documentation is vague. It defines the recommended value as a percentage of the available RAM. That makes no sense for me. The cache is there to keep frequently used blocks and that depends on your application workload. Not on the available RAM. There is also this idea that because there is double buffering, you should allocate the same size to both caches. But that makes no sense again. If you keep blocks in the shared buffers, they will not be frequently accessed from the filesystem and will not stay in the filesystem cache. Finally, don’t think the defaults are good. The default shared_buffers is always too small and the reason is that a small value eases the installation on Linux without having to think about SHM size. But you have more, need more, and will need to configure SHM and huge pages for it.
My only recommendation is to understand your workload: what is the set of data that is frequently used (lookup tables, index branches, active customers, last orders,…). This should fit in the shared buffers. And the second recommendation is to understand how it works. For the set of data that is frequently read only, this is not so difficult. You need to have an idea about the postgres cache algorithm (LRU/Clock sweep in shared buffers which is static size) and the filesystem cache (LRU with the variable size of free memory). For the set of data that is modified, this much more complex.
Let’s start with the reads. As an example I have run a workload that reads at random within a small set of 150MB. I used pgio from Kevin Closson for that. I’ve executed multiple runs with warying the shared_buffers from smaller than my work set, 50MB, to 2x larger: 50MB, 100MB, 150MB, 200MB, 250MB, 300MB. Then, for each size of shared buffers, I’ve run with variations in the available RAM (which is used by the filesystem cache): 50MB, 100MB, 150MB, 200MB, 250MB, 300MB, 350MB, 400MB. I ensured that I have enough physical memory so that the system does not swap.
I determined the free space in my system:
[ec2-user@ip-172-31-37-67 postgresql]$ sync ; sync ; sync ; free -hw
              total        used        free      shared     buffers       cache   available
              total        used        free      shared     buffers       cache   available
Mem:           983M         63M        835M        436K          0B         84M        807M
Swap:            0B          0B          0B
I also use https://medium.com/@FranckPachot/proc-meminfo-formatted-for-humans-350c6bebc380
[ec2-user@ip-172-31-37-67 postgresql]$ awk '/Hugepagesize:/{p=$2} / 0 /{next} / kB$/{v[sprintf("%9d MB %-s",int($2/1024),$0)]=$2;next} {h[$0]=$2} /HugePages_Total/{hpt=$2} /HugePages_Free/{hpf=$2} {h["HugePages Used (Total-Free)"]=hpt-hpf} END{for(k in v) print sprintf("%-60s %10d",k,v[k]/p); for (k in h) print sprintf("%9d MB %-s",p*h[k]/1024,k)}' /proc/meminfo|sort -nr|grep --color=auto -iE "^|( HugePage)[^:]*" #awk #meminfo                                                                           33554431 MB VmallocTotal:   34359738367 kB                    16777215
      983 MB MemTotal:        1006964 kB                            491
      946 MB DirectMap2M:      968704 kB                            473
      835 MB MemFree:          855628 kB                            417
      808 MB MemAvailable:     827392 kB                            404
      491 MB CommitLimit:      503480 kB                            245
      200 MB Committed_AS:     205416 kB                            100
       78 MB DirectMap4k:       79872 kB                             39
       69 MB Cached:            71436 kB                             34
       55 MB Active:            56640 kB                             27
       43 MB Inactive:          44036 kB                             21
       42 MB Inactive(file):    43612 kB                             21
       29 MB Slab:              30000 kB                             14
       28 MB AnonPages:         29260 kB                             14
       28 MB Active(anon):      29252 kB                             14
       26 MB Active(file):      27388 kB                             13
       14 MB SUnreclaim:        14876 kB                              7
       14 MB SReclaimable:      15124 kB                              7
       13 MB Mapped:            14212 kB                              6
        4 MB PageTables:         4940 kB                              2
        2 MB Hugepagesize:       2048 kB                              1
        1 MB KernelStack:        1952 kB                              0
        0 MB Shmem:               436 kB                              0
        0 MB Inactive(anon):      424 kB                              0
        0 MB HugePages Used (Total-Free)
        0 MB HugePages_Total:       0
        0 MB HugePages_Surp:        0
        0 MB HugePages_Rsvd:        0
        0 MB HugePages_Free:        0
        0 MB Dirty:                 4 kB                              0
Then in order to control how much free RAM I want to set ($fs_MB) I allocate the remaining as huge pages:
sudo bash -c "echo 'vm.nr_hugepages = $(( (835 - $fs_MB) / 2 ))' > /etc/sysctl.d/42-hugepages.conf ; sysctl --system"
This limits the RAM available for the fileystem cache because huges pages cannot be used for it. And the huges pages can be used for the postgres shared buffers:
sed -i -e "/shared_buffers/s/.*/shared_buffers = ${pg_MB}MB/" -e "/huge_pages =/s/.*/huge_pages = on/" $PGDATA/postgresql.conf
grep -E "(shared_buffers|huge_pages).*=" $PGDATA/postgresql.conf
/usr/local/pgsql/bin/pg_ctl -l $PGDATA/logfile restart
Note that I actually stopped postgres before to be sure that no huge pages are used when resizing them:
for pg_MB in 50 100 150 200 250 300 350 400
do
for fs_MB in 400 350 300 250 200 150 100 50
do
/usr/local/pgsql/bin/pg_ctl -l $PGDATA/logfile stop
# set huge pages and shared buffers
/usr/local/pgsql/bin/pg_ctl -l $PGDATA/logfile restart
# run pgio runit.sh
done
done
100% Read only workload on 150MB
Here is the result. Each slide on the z-axis is a size of shared-buffers allocated by postgres. On the x-axis the size of the available RAM that can be used for filesystem cache by the Linux kernel. The y-axis is the number of tuples read during the run.
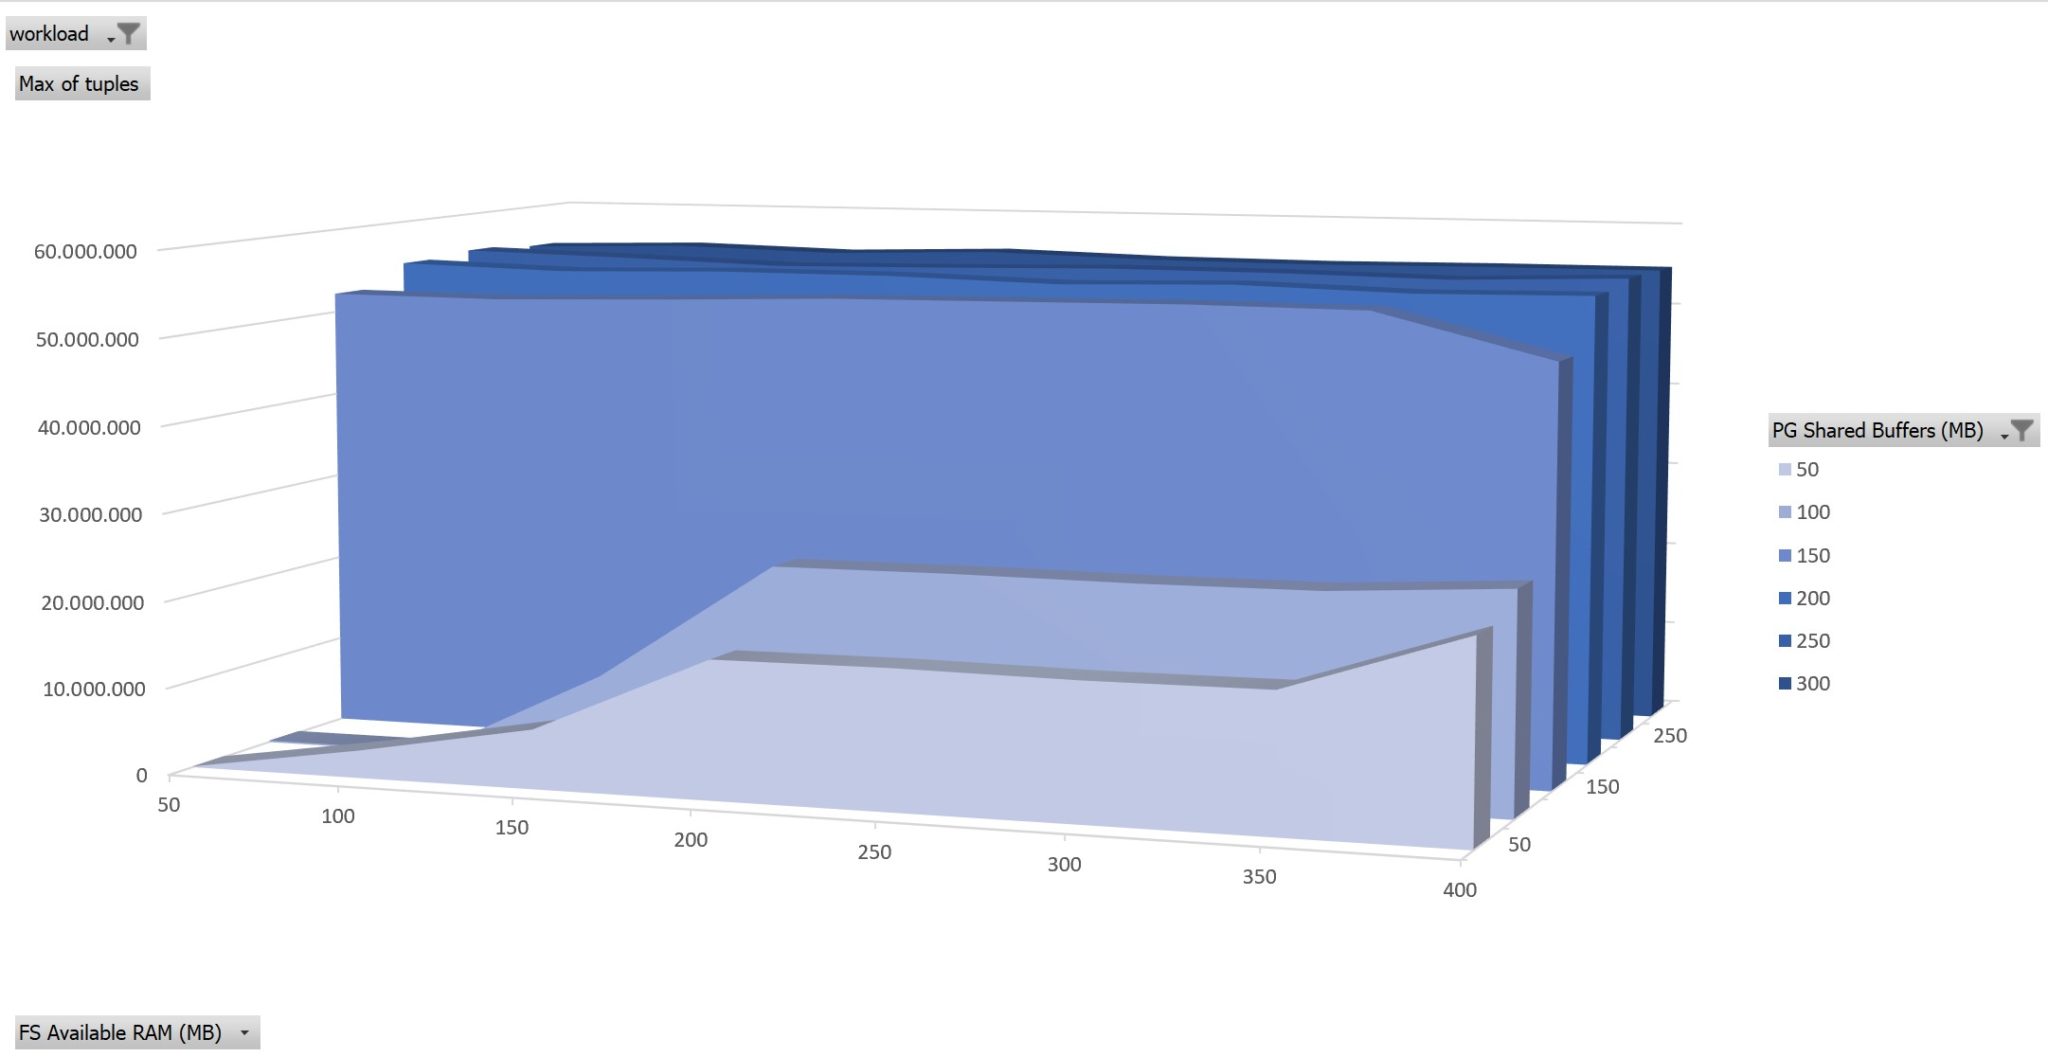
You will never get optimal performance when the frequent read set doesn’t fit in shared buffers. When the read set is larger than the shared buffers, you need more RAM in order to get better performance. The frequently read set of data should fit in shared buffers.
50% updates on 150MB
Here is the same run where I only changed PCT_UPDATE to 50 in pgio.conf
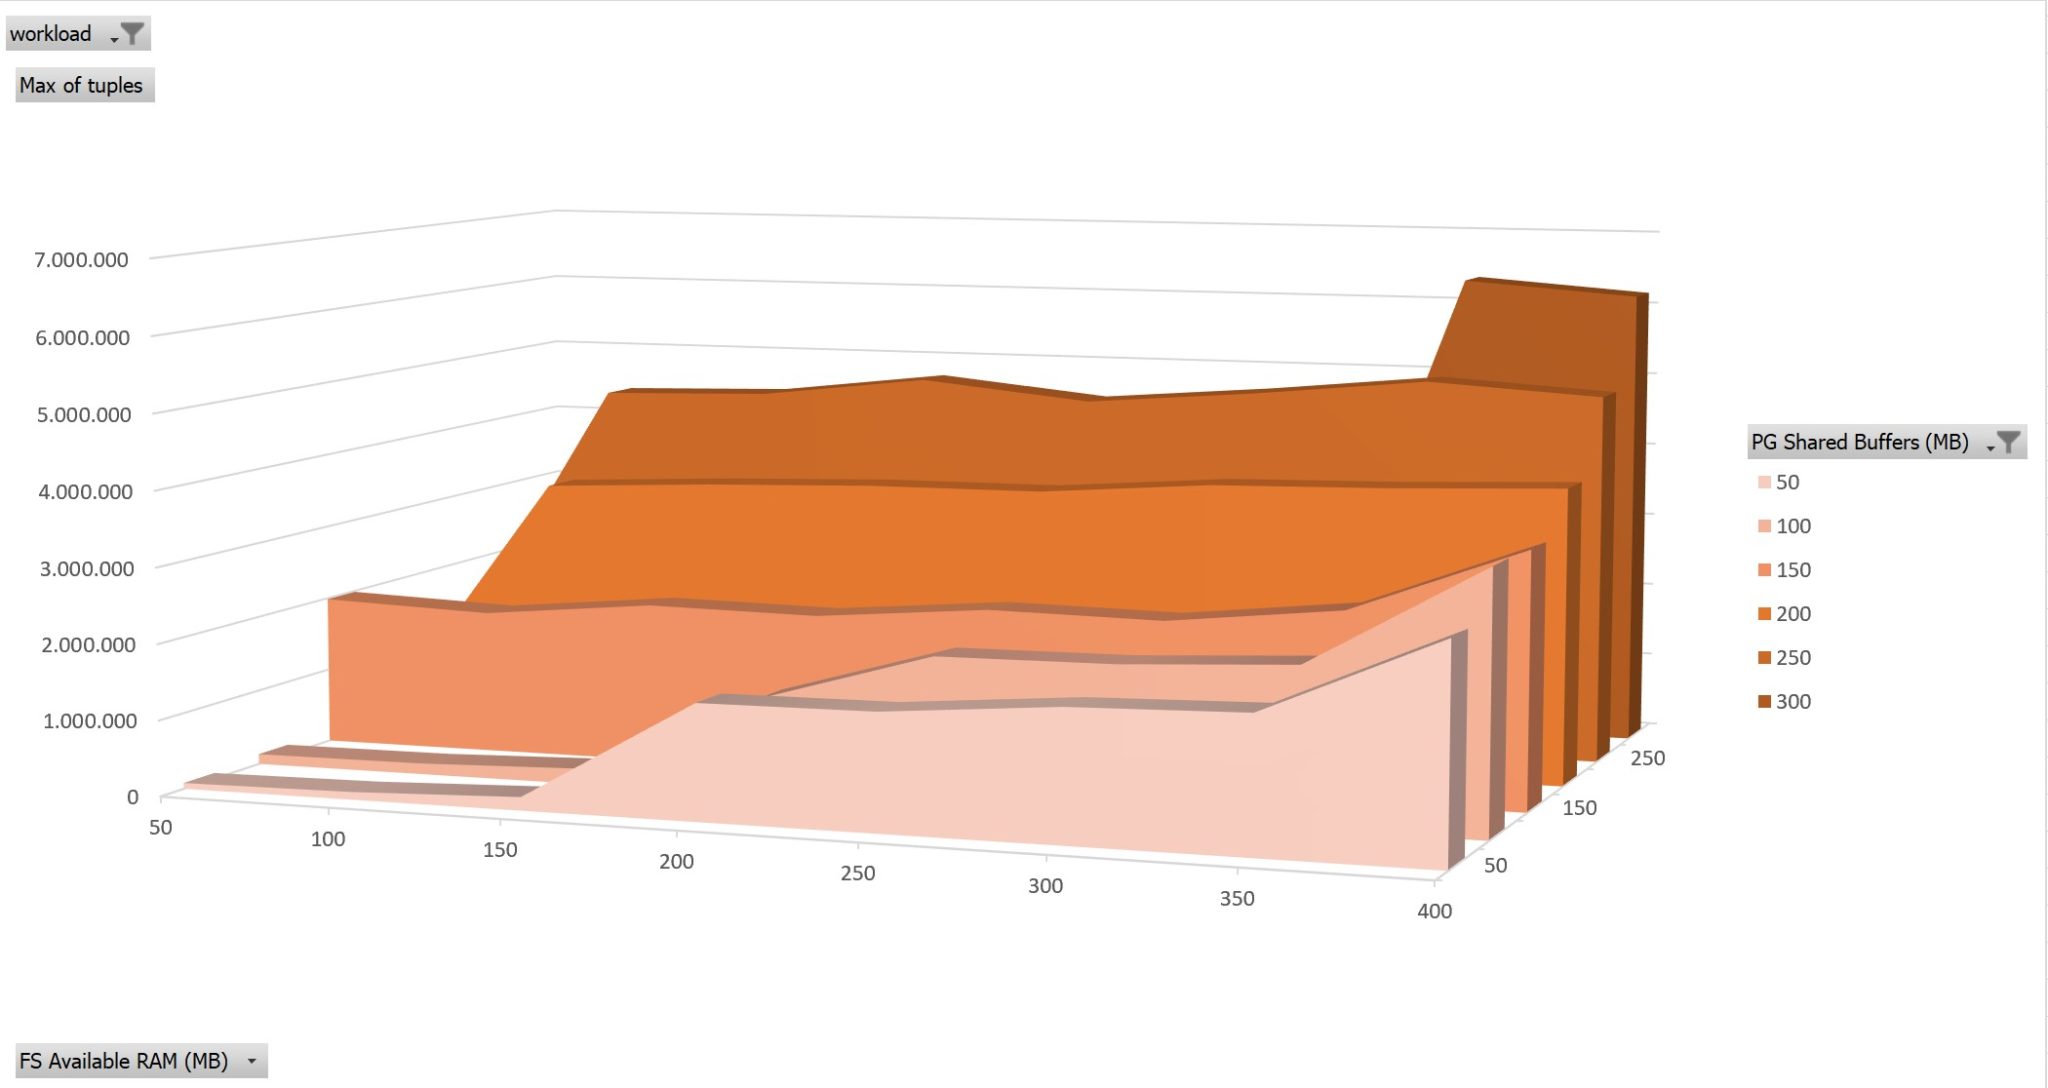
This looks similar but there are two main differences, one visible here and another that is not represented in this graphic because I aggregated several runs.
First, increasing the shared buffers above the set of frequently manipulated data still improves performance, which was not the case with reads. As soon as the shared buffer is above the working set of 150MB the buffer cache hit ratio is at 100%. But that’s for reads. Updates generate a new version of data and both versions will have to be vacuumed and checkpoint.
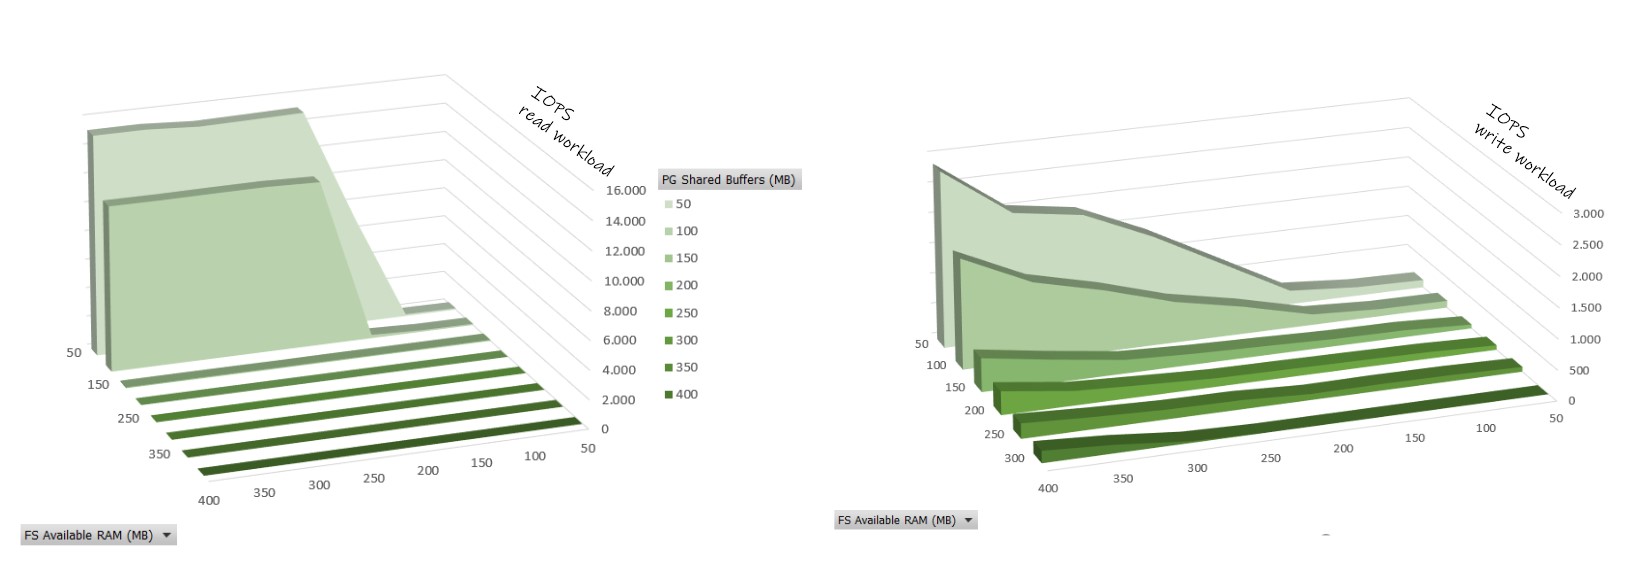
Here is a graph about blks_read/s which shows that for a read-only workload we do not do any physical reads (I/O calls from the database to the filesystem) as soon as the working set fits in shared buffers. When we write, the read calls still improve when we increase the shared buffers a bit above the modified set. And the physical read efficiency is the best when there is as much free RAM as shared buffers.
Second point about the write workload, performance is not homogenous at all. Vacuum and Checkpoint happen at regular intervals and make the performance un-predictable. When showing the tuples/second for the 50% write workload, I aggregated many runs to display the maximum throughput achieved. Having the modified set of data fitting in free RAM helps to lower this variation as it avoids immediate physical write latency. The balance between shared buffers and free RAM is then a balance between high performance and predictability of performance: keep free ram as a performance “buffer” between userspace access and disk reads. There are also many parameters to “tune” this like with the frequency of vacuum and checkpoints. And this makes memory tuning very complex. Note that I changed only the shared_buffers here. When increasing shared_buffers for high write throughput, there are other structures to increase like the WAL segments.
The filesystem cache adds another level of un-predictable performance. For example, you may run a backup that reads all the database, bringing the blocks into the Least Recently Used. And I didn’t do any sequential scans here. They benefit from filesystem buffers with pre-fetching. All theses make any quick recommendation incorrect. Buffer cache hit ratios make no sense to estimate the response time improvement as they are not aware of the filesystem cache hits. But looking at them per relation, tables or indexes may help to estimate which relation is frequently accessed. Because that’s what matters: not the size of the database, not the size of your server RAM, not the general buffer cache hit ratio, but the size of data that is read and written frequently by your application.
![Thumbnail [60x60]](https://www.dbi-services.com/blog/wp-content/uploads/2022/05/open-source-author.png)
![Thumbnail [90x90]](https://www.dbi-services.com/blog/wp-content/uploads/2022/08/FRJ_web-min-scaled.jpg)
![Thumbnail [90x90]](https://www.dbi-services.com/blog/wp-content/uploads/2023/01/APY_web-scaled.jpg)
![Thumbnail [90x90]](https://www.dbi-services.com/blog/wp-content/uploads/2025/03/OBA_web-scaled.jpg)