Setting up Zabbix monitoring over an Elasticsearch cluster is quiet easy as it does not require an agent install. As a matter a fact, the official template uses the Elastic REST API. Zabbix server itself will trigger these requests.
In this blog post, I will quick explain how to setup Elasticsearch cluster, then how easy the Zabbix setup is and list possible issues you might encounter.
Elastic Cluster Setup
I will not go too much in detail as David covered already many topics around ELK. Anyway, would you need any help to install, tune or monitor your ELK cluster fell free to contact us.
My 3 virtual machines are provisioned with YaK on OCI. Then, I install the rpm on all 3 nodes.
After starting first node service, I am generating an enrollment token with this command:
/usr/share/elasticsearch/bin/elasticsearch-create-enrollment-token -node
This return a long string which I will need to pass on node 2 and 3 of the cluster (before starting anything):
/usr/share/elasticsearch/bin/elasticsearch-reconfigure-node --enrollment-token <...>
Output will look like that:
This node will be reconfigured to join an existing cluster, using the enrollment token that you provided.
This operation will overwrite the existing configuration. Specifically:
  - Security auto configuration will be removed from elasticsearch.yml
  - The [certs] config directory will be removed
  - Security auto configuration related secure settings will be removed from the elasticsearch.keystore
Do you want to continue with the reconfiguration process [y/N]
After confirming with a y, we are almost ready to start. First, we must update ES configuration file (ie. /etc/elasticsearch/elasticsearch.yml).
- Add IP of first node (only for first boot strapped) in
cluster.initial_master_nodes: ["10.0.0.x"] - Set listening IP of the inter-node trafic (to do on node 1 as well):
transport.host: 0.0.0.0 - Set list of master eligible nodes:
discovery.seed_hosts: ["10.0.0.x:9300"]
Now, we are ready to start node 2 and 3.
Let’s check the health of our cluster:
curl -s https://localhost:9200/_cluster/health -k -u elastic:password | jq
If you forgot elastic password, you can reset it with this command:
/usr/share/elasticsearch/bin/elasticsearch-reset-password -u elastic
Zabbix Configuration
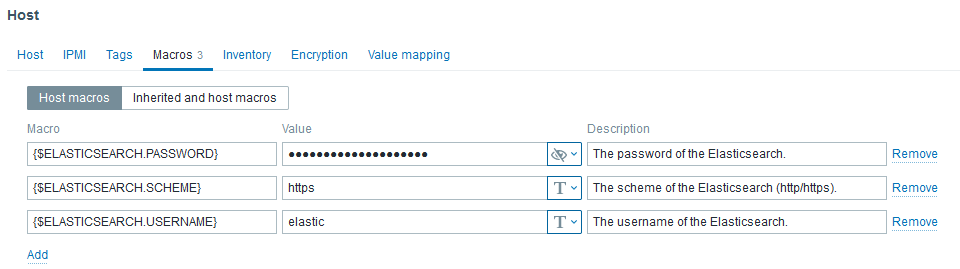
With latest Elasticsearch release, security has drastically increased as SSL communication became the standard. Nevertheless, default MACROS values of the template did not. Thus, we have to customize the followings:
- {$ELASTICSEARCH.USERNAME} to elastic
- {$ELASTICSEARCH.PASSWORD} to its password
- {$ELASTICSEARCH.SCHEME} to https
If SELinux is enabled on your Zabbix server, you will need to allow zabbix_server process to send network request. Following command achieves this:
setsebool zabbix_can_network 1
Next, we can create a host in Zabbix UI like that:
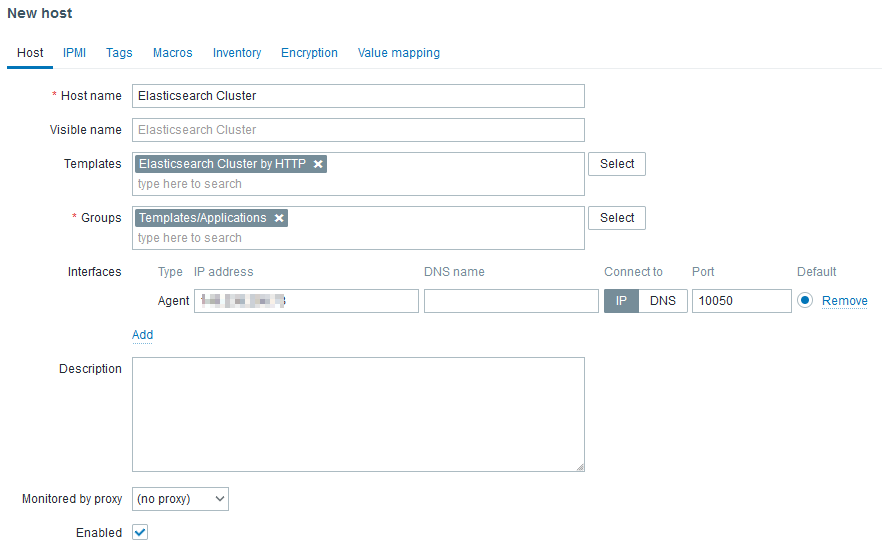
The Agent interface is required but will not be used to reach any agent as there are not agent based (passive or active) checks in the linked template. However, http checks uses HOST.CONN MACRO in the URLs. Ideally, the IP should be a virtual IP or a load balanced IP.
Don’t forget to set the MACROS:
After few minutes, and once nodes discovery ran, you should see something like that:

Problems
What will happen if one node stops? On Problems tab of Zabbix UI:

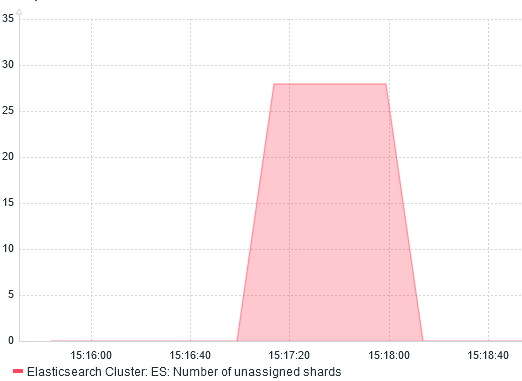
After few seconds, I noticed that ES: Health is YELLOW gets resolved on its own. Why? Because shards are re-balanced across running servers.
I confirm this by graphing Number of unassigned shards:
We can also see the re-balancing with the network traffic monitoring:
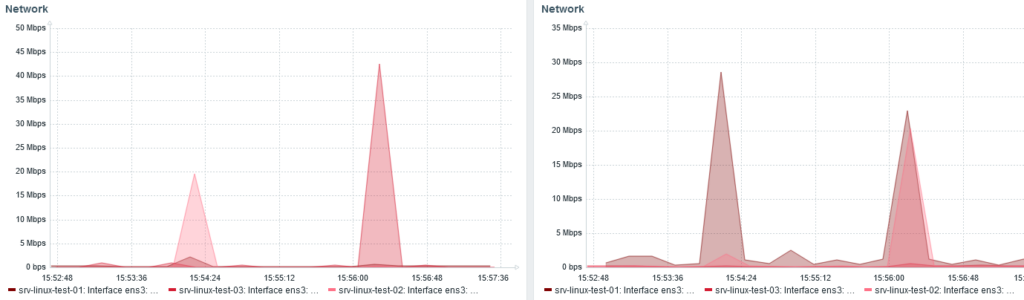
Around 15:24, I stopped node 3 and shards were redistributed from node 1 and 2.
When node 3 start, at 15:56, we can see node 1 and 2 (20 Mbps each) send back shards to node 3 (40 Mbps received).
Conclusion
Whatever the monitoring tool you are using, it always help to understand what is happening behind the scene.
![Thumbnail [90x90]](https://www.dbi-services.com/blog/wp-content/uploads/2022/08/ADE_WEB-min-scaled.jpg)
![Thumbnail [90x90]](https://www.dbi-services.com/blog/wp-content/uploads/2022/08/NME_web-min-scaled.jpg)
![Thumbnail [90x90]](https://www.dbi-services.com/blog/wp-content/uploads/2022/08/GRE_web-min-scaled.jpg)