This blog post draws on the previous article about index seek and gotchas. I encountered another interesting case but it is not so much because of the nature of the problem I decided to write this article but rather the different ways that exist to troubleshoot it.
Firstly, let’s set the scene:
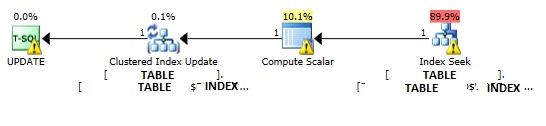
A simple update query and its corresponding execution plan that tend to say the plan is efficient in terms of performance
declare @P0 datetime2
       ,@P1 int,
       @P2 nvarchar(4000)

set @P0 = GETDATE()
set @P1 = 1
set @P2 = '005245'

UPDATE
	[TABLE]
SET
	[_DATE] = @P0
WHERE
	[_ID] = @P1
    AND
    [_IDENTIFIER] = @P2
;
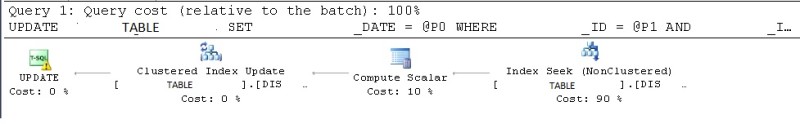
An index Seek – with a cardinality of 1 – and then a clustered index update operation. A simple case as you may notice here. But although the customer noticed a warning icon in the execution plan, he was confident enough about this plan to take care about it.
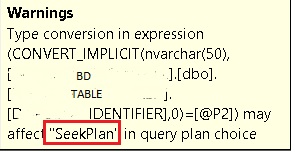
But if we look closer at the warning icon it concerns a CONVERT_IMPLICT operation (meaning hidden operation done by the optimizer) that may affect the SeekPlan as stated by the pop up:
In fact, in the context of this customer, this query became an issue when it was executed a thousand times in a very short period leading to trigger lock time out issues and to consume one entire VCPU of the server as well.
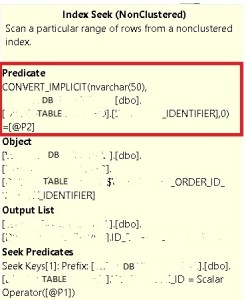
Let’s jump quickly to the root cause and the solution. Obviously the root cause concerned the @P2 parameter type here – NVARCHAR(4000) – that forced the optimizer to use an CONVERT_IMPLICT operation which makes the predicate non sargable and an index seek operation inefficient. This is particularly true when the CONVERT_IMPLICIT operation concerns the column in the predicate rather than the leading parameter. Indeed in this case @P2 type is NVARCHAR(4000) whereas the _IDENTIFIER column type is VARCHAR(50) and the optimizer has to convert first the _IDENTIFIER column (with lower precedence type) to match with the @P2 parameter (with the higher precedence type). Let’s say also that the @P1 parameter is not selective enough to prevent a range scan operation in this case.
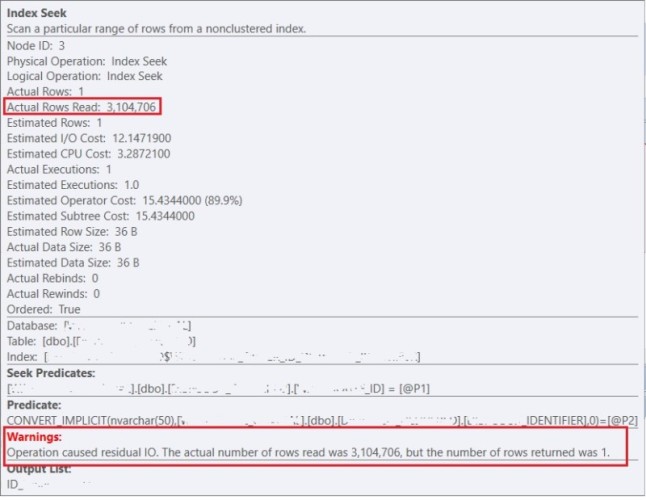
Although the actual execution plan is showing index seek with a cardinality of 1, I was able to confirm quickly to my customer that the real number was completely overshadowed by using IO and TIME statistics.
  CPU time = 0 ms,  elapsed time = 0 ms.
Table 'TABLE'. Scan count 1, logical reads 17152, physical reads 0, read-ahead reads 0, lob logical reads 0, lob physical reads 0, lob read-ahead reads 0.

SQL Server Execution Times:
   CPU time = 609 ms,  elapsed time = 621 ms.
Well, do you really think that a true index seek may lead to read such number of pages and to consume this amount of CPU per execution? 🙂 … I let you image how intensive this query may be in terms of CPU when executed a lot of times in a very short period …
Another point that puts us quickly on the right track is that the comparison is done in the predicate section of the index seek operation meaning it will be checked after the seek predicate. Thus, the index seek operator acts as an index scan by starting at the first page and keeps running until satisfying the seek predicate.
Referring to the IO statistics output above we may notice the operator read 17152 pages and a quick look at the corresponding index physical stats allowed us to assume safely the storage engine read a big part of the index in this case.
SELECT
	index_id,
	partition_number,
	index_level,
	page_count
FROM sys.dm_db_index_physical_stats(DB_ID(), OBJECT_ID('TABLE'), NULL, NULL, 'DETAILED')
WHERE index_id = 10
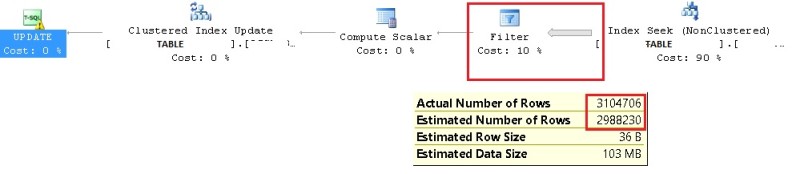
Ultimately, we may also benefit from an undocumented trace flag 9130 that highlights in an obvious way how to address this issue by showing a filter operator (predicate section of index seek operator pop up) after the index seek operator itself (reading from the right to the left). From a storage perspective we are far from the first exposed reality.
SQL Server Execution Times:
   CPU time = 0 ms,  elapsed time = 0 ms.
Table 'table'. Scan count 1, logical reads 6, physical reads 1, read-ahead reads 0, lob logical reads 0, lob physical reads 0, lob read-ahead reads 0.

SQL Server Execution Times:
   CPU time = 0 ms,  elapsed time = 1 ms.
Ok my problem was fixed but let’s jump quickly to another interesting point. Previously I used different tools / tricks to identify the “residual” seek operation. But shall I go through all this stuff to identify this kind of issue? Is there an easier way for that? The good news is yes if you run on SQL Server 2012 SP3+ / SQL Server 2014 SP2+ or SQL Server 2016+ because the SQL Server team added runtime information to showplan.
In my context, it may simplify drastically the analysis because runtime statistics are directly exposed per operator. I got interesting information as ActualRowsRead (3104706 rows) and ActualLogicalReads (17149 pages).
Note that if we refer to the IO statistics from the first query where I got 17152 pages for the table TABLE, the missing 3 pages are in fact on the update index operator.
<RelOp AvgRowSize="36"
						   EstimateCPU="3.28721"
						   EstimateIO="12.1472"
						   EstimateRebinds="0"
						   EstimateRewinds="0"
						   EstimatedExecutionMode="Row"
						   EstimateRows="1"
						   LogicalOp="Index Seek"
						   NodeId="3"
						   Parallel="false"
						   PhysicalOp="Index Seek"
						   EstimatedTotalSubtreeCost="15.4344"
						   TableCardinality="5976470">
                      <OutputList>
                        <ColumnReference
							Database="[DB]"
							Schema="[dbo]"
							Table="[TABLE]"
							Column="_DELIVERED" />
                      </OutputList>
                      <RunTimeInformation>
                        <RunTimeCountersPerThread Thread="0"
												  ActualRows="1"
												  ActualRowsRead="3104706"
												  ActualEndOfScans="1"
												  ActualExecutions="1"
												  ActualElapsedms="1209"
												  ActualCPUms="747"
												  ActualScans="1"
												  ActualLogicalReads="17149"
												  ActualPhysicalReads="1"
												  ActualReadAheads="17141"
												  ActualLobLogicalReads="0"
												  ActualLobPhysicalReads="0"
												  ActualLobReadAheads="0" />
                      </RunTimeInformation>
Finally, if you’re an enthusiastic of the famous Plan Explorer tool like me in order to troubleshoot execution plans, the addition of runtime statistics was also included to this tool accordingly. The warning icons and corresponding popups alert us very quickly about the residual IO issue as shown below:
Happy troubleshooting!
By David Barbarin
![Thumbnail [60x60]](https://www.dbi-services.com/blog/wp-content/uploads/2022/12/microsoft-square.png)
![Thumbnail [90x90]](https://www.dbi-services.com/blog/wp-content/uploads/2022/08/STH_web-min-scaled.jpg)
![Thumbnail [90x90]](https://www.dbi-services.com/blog/wp-content/uploads/2024/03/AHI_web.jpg)