This is my first blog of this new year and since a while by the way. Indeed, last year, I put all my energy to realign my Linux skills with the new Microsoft’s strategy that opens SQL Server to Open Source world. But at the same time, I did a lot of interesting stuff at customers shops and I decided to write about one of them to begin this new year 2018.

In this blog post, I will highlight a distinctive approach, according to me, to optimize an update statistics operation for one particular and big table. I already had to manage such maintenance tasks in one of my previous jobs as DBA and I continue to learn more about it but from a different position now. The fact is as consultant, I usually try to provide to my customer the best approach regarding both the issue and the context. In reality, from my experience, the latter is much more important than you may think and sometimes we have to consider different other ways to get the expected outcome. I think this is not a necessarily a bad thing because following a different path (not the best) may reveal different other interesting options we may consider to make our final recipe.
Let’s go back to my customer case and let set the context. One big database (1.7TB) on SQL Server 2014 SP2 and an update statistics operation that is part of a global database maintenance strategy and takes a very long time (roughly 30h in the best-case scenario). We identified the biggest part of the execution time is related to one big and non-partitioned table (let’s say dbo.bigtable) with the following figures: 148 millions of rows / 222GB in size / 119 columns / 94 statistics / 14 indexes. Regarding the two last figures, the majority of statistics we re in fact auto-generated by the SQL Server engine over the time and from different application release campaigns. Furthermore, it is worth mentioning that the DBA had to use a customized sample value (between 10 and 50 percent) to minimize the impact of update statistics operation for this particular table regarding the table size and the configured maintenance windows timeframe.
My first and obvious approach
My first approach consisted in warning the database administrator about the number of statistics on this table (probably a lot of them are not in use anymore?) as well as the development team about the bad designed table. In addition, the number of rows in this table may also indicate that it contains a lot of archive data and we may reduce the global size by using archiving processes (why not built-in partitioning features and incremental statistics because we’re running with enterprise edition?). However, reviewing the model was not an option for my customer because it will require a lot of work and the DBA wasn’t keen on the idea of archiving data (business constraints) or removing auto generated statistics on this specific table. So, what I considered a good approach was not a success for adoption and the human aspect was definitely a big part of it. In a nutshell, at this stage a standby situation …
When a high-performance storage comes into rescue …
In parallel my customer was considering to replace his old storage by a new one and Pure Storage was in the loop. Pure Storage is one of the flash storage providers on the market and the good news is I already was in touch with @scrimi78 (Systems Engineer at Pure Storage) in Switzerland. During this project, we had a lot of interesting discussions and interaction s about Pure Storage products and I appreciated his availability to provide technical documentation and explanation. At the same time, they lent us generously a Pure Storage to play with snapshot volumes that will be used for database refresh between a production and dev environments.
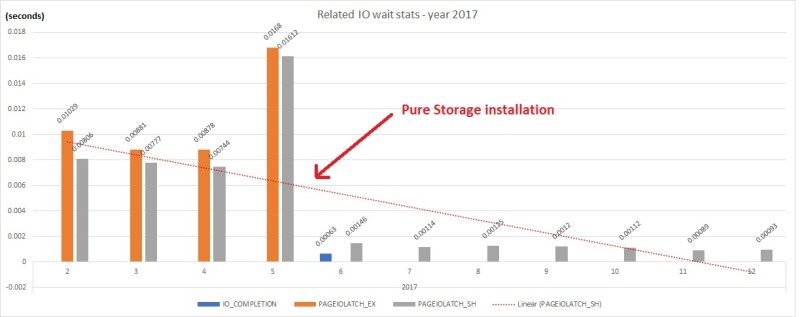
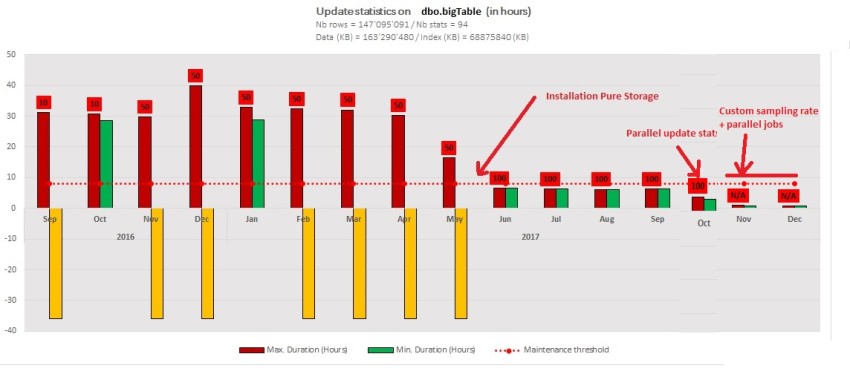
In the context of my customer, we already were aware of the poor performance capabilities of the old storage and the replacement by a Pure Storage // M20 model was very beneficial for the database environments as shown by the following figures:
I only put the IO-related statistics of the production environment we had during the last year and we may notice a significant drop of average time after moving the production database files on the new storage layout. Figures are by year and month.
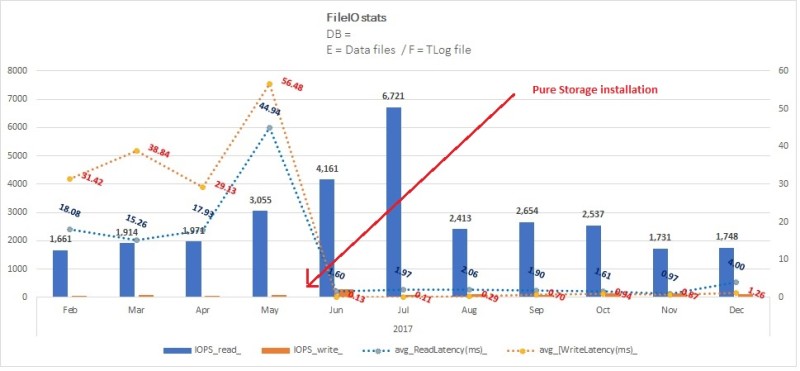
We noticed the same from file IO statistics figures about the concerned database.
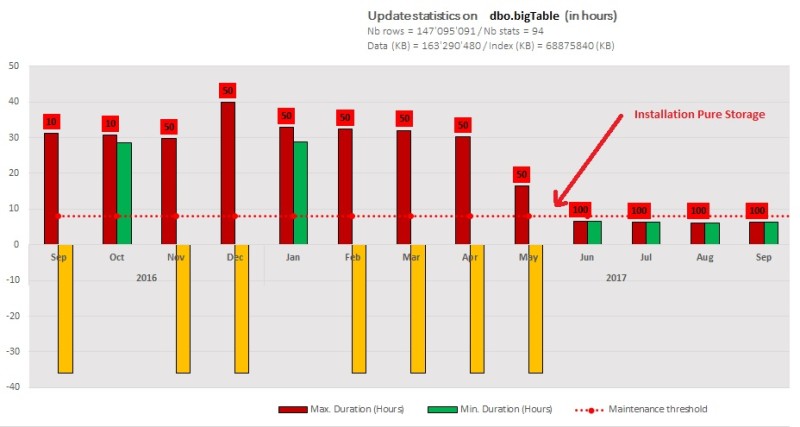
Very impressive isn’t it? But what about our update statistics here? We naturally observed a significant drop in execution time to 6 hours (80% of improvement) because generally speaking this an IO-bound operation and especially in our case. The yellow columns represent operations we had to stop manually to avoid impacting the current application workload (> 35hours of execution time). You may also notice we changed the sample value to 100 percent after installing the Pure Storage // 20 model compared to previous runs with a sample value of 50 percent.
Changing the initial way to update statistics for this table …
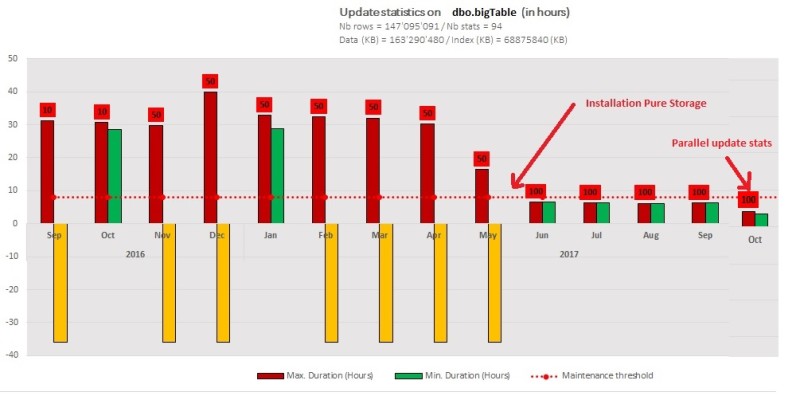
The point here is we know that we may now rely on the storage performance to update statistics efficiently and why not to push the limit of the storage by changing the way of running our update statistics operation – basically sequentially by default with one statistic at time. So, we decided to write a custom script to carry out the update operation in parallel to boost the overall execution performance. Since SQL Server 2014 SP1 CU6 we may benefit from an improved support for parallel statistics by using the trace flag 7471 that changes the locking behavior such that SQL Server engine no longer acquires X LOCK on UPDSTATS resource on this table. The script consists in creating a pool of parallel SQL jobs that update one particular statistic on a single table. I put it below if you want to use it but in a meantime, let’s say it is also possible to go through an interesting smart alternative solution based on the service broker capabilities here. What is certain is we will integrate one or other version – with some adjustments – to you DMK management kit tool. Here my proposal based on concurrent SQL jobs (feel free to comment):
SET NOCOUNT ON;

DECLARE
	@database_name sysname = N'AdventureWorks2012', -- Target database
	@table_name sysname = N'bigTransactionHistory', -- Target table
	@schema_name sysname = N'dbo',                  -- Target schema
	@batch_upd_stats INT = 3,                       -- Number of simultaneous jobs
	@stat_sample INT = 0, 					        -- 0 = default sample rate value | 100 = FULLSCAN | Otherwise WITH SAMPLE @stat_sample PERCENT
	@debug BIT = 1									-- 0 = debug mode disabled -| 1 - Debug mode | 99 - Verbose mode


-- @stats_sample variable table
-- Will contains statistics with custom sampling rate value
-- Otherwise will use the default sample rate value from SQL Server
-- You may also use an user table for more flexibility that that will
-- be used from this script
DECLARE @stats_sample TABLE
(
	column_name sysname,
	stats_name sysname,
	sample_stat tinyint
);

INSERT @stats_sample VALUES ('TransactionID', '_WA_Sys_00000001_4CC05EF3', 100),
						    ('ProductID', '_WA_Sys_00000002_4CC05EF3', 100);


-- working parameters
DECLARE
	@nb_jobs_running INT = 0,
	@count INT = 0,
	@i INT,
	@j INT,
	@max INT,
	@sqlcmd NVARCHAR(MAX) = N'',
	@job_name_pattern sysname,
	@start_date DATETIME2(0),
	@end_date DATETIME2(0),
	@stats_name sysname,
	@sample_stat int
	;


-- Creation of update stat jobs
IF OBJECT_ID('tempdb..#update_stats_tt', 'U') IS NOT NULL
	DROP TABLE #update_stats_tt;

SELECT
	id = IDENTITY(INT, 1,1),
	s.name AS [schema_name],
	t.name AS table_name,
	st.name AS stats_name,
	sample_stat,
	'USE [msdb]

	DECLARE @jobId BINARY(16);

	EXEC  msdb.dbo.sp_add_job @job_name=N''UPDATE_STATS_' + @schema_name + '_' + @table_name + '_' + st.name + ''',
			@enabled=1,
			@notify_level_eventlog=0,
			@notify_level_email=2,
			@notify_level_netsend=2,
			@notify_level_page=2,
			@delete_level=0,
			@category_name=N''[Uncategorized (Local)]'',
			@owner_login_name=N''sa'', @job_id = @jobId OUTPUT
	--select @jobId

	EXEC msdb.dbo.sp_add_jobserver @job_name=N''UPDATE_STATS_' + @schema_name + '_' + @table_name + '_' + st.name + ''', @server_name = N''' + @@SERVERNAME + '''

	EXEC msdb.dbo.sp_add_jobstep @job_name=N''UPDATE_STATS_' + @schema_name + '_' + @table_name + '_' + st.name + ''', @step_name=N''UPDATE STATS'',
		@step_id=1,
		@cmdexec_success_code=0,
		@on_success_action=1,
		@on_fail_action=2,
		@retry_attempts=0,
		@retry_interval=0,
		@os_run_priority=0, @subsystem=N''TSQL'',
		@command=N''UPDATE STATISTICS ' + QUOTENAME(s.name) + '.' + QUOTENAME(t.name) + ' ' + st.name + CASE COALESCE(sample_stat, @stat_sample, 0)
																											WHEN 0 THEN ' '
																											WHEN 100 THEN ' WITH FULLSCAN'
																											ELSE ' WITH SAMPLE ' + CAST(COALESCE(sample_stat, @stat_sample, 0) AS VARCHAR(15)) + ' PERCENT'
																										END + ''',
		@database_name=N''' + @database_name + ''',
		@flags=0

	EXEC msdb.dbo.sp_update_job @job_name=N''UPDATE_STATS_' + @schema_name + '_' + @table_name + '_' + st.name + ''',
			@enabled=1,
			@start_step_id=1,
			@notify_level_eventlog=0,
			@notify_level_email=2,
			@notify_level_netsend=2,
			@notify_level_page=2,
			@delete_level=0,
			@description=N'''',
			@category_name=N''[Uncategorized (Local)]'',
			@owner_login_name=N''sa'',
			@notify_email_operator_name=N'''',
			@notify_netsend_operator_name=N'''',
			@notify_page_operator_name=N''''
	' AS upd_stats_cmd
INTO  #update_stats_tt
FROM
	sys.stats AS st
JOIN
	sys.tables AS t ON st.object_id = t.object_id
JOIN
	sys.schemas AS s ON s.schema_id = t.schema_id
LEFT JOIN
	@stats_sample AS ss ON ss.stats_name = st.name
WHERE
	t.name =  @table_name
	AND s.name = @schema_name
ORDER BY
	stats_id;

IF @debug = 99
	SELECT * FROM #update_stats_tt;

-- Enable traceflag 7471 to allow U lock while stat is updating
PRINT '--> Enable trace flag 7471 during update stats operation';

SET @sqlcmd = N'DBCC TRACEON(7471, -1);' + CHAR(13)
EXEC sp_executesql @sqlcmd;

PRINT '-----------------------------------';

SET @start_date = CURRENT_TIMESTAMP;

SET @max = (SELECT MAX(id) FROM #update_stats_tt);
SET @i = 0;

IF @debug = 99
	SELECT 'DEBUG -->  @max (nb stats) : ' + CAST(@max AS VARCHAR(15));

-- Entering to the loop ...
WHILE (@i <= @max OR @nb_jobs_running <> 0)
BEGIN

	SET @j = @i + 1;

	IF @debug = 99
	BEGIN
		SELECT 'DEBUG -->  @i : ' + CAST(@i AS VARCHAR(15));
		SELECT 'DEBUG --  @j = @i + 1 : ' + CAST(@j AS VARCHAR(15));
	END

	-- Computing number of update stats jobs to create
	-- regarding both the max configured of simulataneous jobs and current running jobs
	SET @count = @batch_upd_stats - @nb_jobs_running;

	IF @debug = 99
		SELECT 'DEBUG --  @count : ' + CAST(@count AS VARCHAR(15));

	-- Here we go ... creating update stats sql_jobs
	WHILE (@j <= @i + @count)
	BEGIN

		SET @sqlcmd = '';
		SET @stats_name = NULL;
		SET @sample_stat = NULL;
		SET @sqlcmd = NULL;

		SELECT
			@stats_name = stats_name,
			@sample_stat = sample_stat,
			@sqlcmd = upd_stats_cmd + CHAR(13) + '---------------------' + CHAR(13)
		FROM
			#update_stats_tt
		WHERE
			id = @j;

		IF @debug = 99
		BEGIN
			SELECT 'DEBUG --  @j loop : ' + CAST(@j AS VARCHAR(15));
			SELECT @stats_name, @sample_stat
		END

		IF @debug = 1
			PRINT 'UPDATE STATISTICS ' + QUOTENAME(@schema_name) + '.' + QUOTENAME(@table_name) + ' ' + @stats_name + CASE COALESCE(@sample_stat, @stat_sample, 0)
																															WHEN 0 THEN ' '
																															WHEN 100 THEN ' WITH FULLSCAN'
																															ELSE ' WITH SAMPLE ' + CAST(COALESCE(@sample_stat, @stat_sample, 0) AS VARCHAR(15)) + ' PERCENT'
																														  END + '';
		IF @debug IN (0,1)
		BEGIN
			PRINT '--> Create SQL job UPDATE_STATS_' + @schema_name + '_' + @table_name + '_' + @stats_name + '';

			EXEC sp_executesql @sqlcmd;
		END

		SET @j += 1;

	END

	-- We need to rewind by 1 to target the next stat to update
	SET @j -= 1;

	PRINT '-----------------------------------';

	-- Start all related update stats jobs
	SET @sqlcmd = N'';

	SELECT @sqlcmd += 'EXEC msdb.dbo.sp_start_job @job_name = ''UPDATE_STATS_' + @schema_name + '_' + @table_name + '_' + stats_name + ''';' + CHAR(13)
	FROM #update_stats_tt
	WHERE id BETWEEN (@i + 1) AND (@i + @count);

	IF @debug = 1
		PRINT @sqlcmd;

	IF @debug IN (0,1)
	BEGIN
		PRINT '--> Starting UPDATE_STATS_' + @schema_name + '_' + @table_name + ' jobs';
		EXEC sp_executesql @sqlcmd;
		PRINT '-----------------------------------';
	END

	-- Waiting 10 seconds before checking running jobs
	WAITFOR DELAY '00:00:10';

	-- Construction job pattern to the next steps - check running jobs and stop terminated jobs
	SET @job_name_pattern = 'UPDATE_STATS_' + @schema_name + '_' + @table_name + '_';

	IF @debug = 99
		SELECT 'DEBUG - @job_name_pattern = ' + @job_name_pattern

	SELECT
		@nb_jobs_running = COUNT(*)
	FROM
		msdb.dbo.sysjobactivity ja (NOLOCK)
	LEFT JOIN
		msdb.dbo.sysjobhistory jh (NOLOCK) ON ja.job_history_id = jh.instance_id
	JOIN
		msdb.dbo.sysjobs j  (NOLOCK) ON ja.job_id = j.job_id
	JOIN
		msdb.dbo.sysjobsteps js  (NOLOCK) ON ja.job_id = js.job_id AND ISNULL(ja.last_executed_step_id,0)+1 = js.step_id
	WHERE
		ja.session_id = (
							SELECT TOP 1 session_id
							FROM msdb.dbo.syssessions  (NOLOCK)
							ORDER BY agent_start_date DESC)
		AND start_execution_date is not null
		AND stop_execution_date is NULL
		AND j.name LIKE @job_name_pattern + '%';

	IF @debug = 99
		SELECT 'DEBUG --  @nb_jobs_running : ' + CAST(@nb_jobs_running AS VARCHAR(15));

	IF @nb_jobs_running = @batch_upd_stats
		PRINT '--> All SQL jobs are running. Waiting for 5s ...';

	-- Waiting until at least one job is terminated ...
	WHILE (@nb_jobs_running = @batch_upd_stats)
	BEGIN

		-- Count nb of running jobs only
		SELECT
			@nb_jobs_running = COUNT(*)
		FROM
			msdb.dbo.sysjobactivity ja (NOLOCK)
		LEFT JOIN
			msdb.dbo.sysjobhistory jh (NOLOCK) ON ja.job_history_id = jh.instance_id
		JOIN
			msdb.dbo.sysjobs j  (NOLOCK) ON ja.job_id = j.job_id
		JOIN
			msdb.dbo.sysjobsteps js  (NOLOCK) ON ja.job_id = js.job_id AND ISNULL(ja.last_executed_step_id,0)+1 = js.step_id
		WHERE ja.session_id = (
								SELECT TOP 1 session_id
								FROM msdb.dbo.syssessions  (NOLOCK)
								ORDER BY agent_start_date DESC)
			AND start_execution_date is not null
			AND stop_execution_date is NULL
			AND j.name LIKE @job_name_pattern + '%'

		WAITFOR DELAY '00:00:05';

	END

	PRINT '-----------------------------------';

	-- Delete terminated SQL jobs
	SET @sqlcmd = '';

	SELECT
		@sqlcmd += 'EXEC msdb.dbo.sp_delete_job  @job_name = ''' + j.name + ''';' + CHAR(13)
	FROM
		msdb.dbo.sysjobactivity ja (NOLOCK)
	LEFT JOIN
		msdb.dbo.sysjobhistory jh (NOLOCK) ON ja.job_history_id = jh.instance_id
	JOIN
		msdb.dbo.sysjobs j  (NOLOCK) ON ja.job_id = j.job_id
	WHERE
		j.name LIKE @job_name_pattern + '%'
		AND start_execution_date is not null
		AND stop_execution_date is not null

	IF @debug = 1
		PRINT @sqlcmd;

	IF @debug IN (0,1)
	BEGIN
		PRINT '--> Removing terminated UPDATE_STATS_' + @schema_name + '_' + @table_name + '_XXX jobs'
		EXEC sp_executesql @sqlcmd;
		PRINT '-----------------------------------';
	END

	SET @i = @j;

	IF @debug = 99
		SELECT 'DEBUG --  @i = @j : ' + CAST(@j AS VARCHAR(15));

END

-- Disable traceflag 7471 (only part of the update stats maintenance
PRINT '-----------------------------------';
PRINT '--> Disable trace flag 7471';
SET @sqlcmd = N'DBCC TRACEOFF(7471, -1);' + CHAR(13)
EXEC sp_executesql @sqlcmd;

SET @end_date = CURRENT_TIMESTAMP;

-- Display execution time in seconds
SELECT DATEDIFF(SECOND, @start_date, @end_date) AS duration_S;
We initially run the test on a QA environment with 4 VCPUs and 22GB of RAM – that was pretty close to the production environment. We noticed when we began to increase the number of parallel jobs over 3 we encountered RESOURCE_SEMAPHORE waits. This is because of memory grants required for each update statistics command . Unfortunately, no chance here to increase the amount of memory to push the limit further but we noticed a factor improvement of 1.5 in average (with still a sample of 100 percent).
At this point I asked myself if we may rely only on the storage layout performance to update statistics. After all, we managed to reduce the execution time below to the maximum windows maintenance timeframe – fixed to 8 hours in your context.
Analyzing further the data distribution
Relying on the storage performance and the new SQL Server capabilities was a good thing for us but however I kept in mind that updating 94 statistics was probably not a smart idea because I was convicted a big part of them was pretty useless. There is no easy way to verify it because we had a mix of stored procedures and ad-hoc statements from different applications that refer to this database (let’s say we also have super users who run queries directly from SSMS). So I decided to put the question differently: If we may not remove some auto-generated statistics, do we have necessarily to update all of them with FULLSCAN for this specific table? What about data distribution for columns involved by auto generated statistics? In the context of the dbo.bigTable and regarding the number of rows we may easily run into cardinality estimation issues if the data distribution is not correctly represented especially in case of skewed data. Nevertheless, analyzing manually histogram steps of each statistic may be cumbersome and we decided to go through the stored procedures provided by Kimberly Tripp here. However, the version we got did not support analyzing columns not involved in an index as mentioned below:
-- Considering for v2
--	, @slowanalyze	char(5) = 'FALSE'
-- No index that exists with this column as the
-- high-order element...analyze anyway.
-- NOTE: This might require MULTIPLE table scans.
-- I would NOT RECOMMEND THIS. I'm not even sure why I'm allowing this...
We had to update a little bit of code to fix it but don’t get me wrong, the Kimberly’s recommendation still makes sense because in the background SQL Server order data from the concerned column to get a picture of the data distribution. Without any indexes on this concerned column, analyzing data distribution may be a very time and resource-consuming (including tempdb for sorting data) task especially when the table becomes big in size as illustrated by the following sample of code executed by SQL Server while updating statistics.
SELECT StatMan([SC0])
FROM
(
	SELECT TOP 100 PERCENT [TransactionID] AS [SC0]
	FROM [dbo].[bigTransactionHistory] WITH (READUNCOMMITTED)
	ORDER BY [SC0]
) AS _MS_UPDSTATS_TBL  OPTION (MAXDOP 16)
This was the case for my dbo.bigTable and I had to cut the operation into small pieces spread within several windows maintenance timeframes.
So, we have to add to the sp_SQLskills_AnalyzeColumnSkew stored procedure the creation of temporary index on the concerned column before analyzing data. This compromise allowed us to gain a lot of time and was validated on the QA environment.
We tried different combinations of parameters and we finally finished by using the following ones (@difference = 10000, @numofsteps = 5) according to our background when we faced query performance and cardinality estimation issues on this specific table. We got an interesting output as shown below:
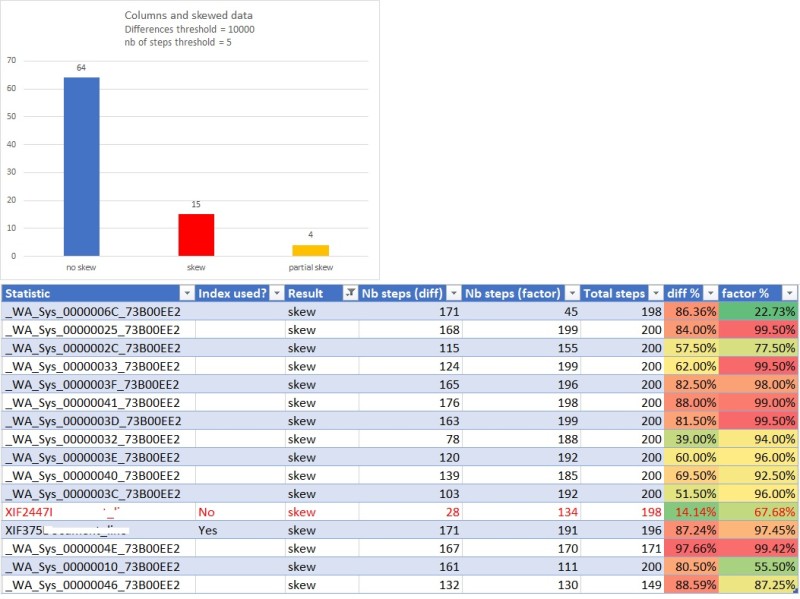
The number of columns with skewed data are low compared to those with data distributed uniformly. [Partial skew] value means we got only differences from the column [Nb steps (factor)] => 2.5 by default.
That was a pretty good news because for columns with no skew data we were able to consider updating them by either using the default sampling rate used by SQL Server (nonlinear algorithm under the control of the optimizer) or to specify a custom sampling rate value to make sure we are not scanning too much data. Regarding my context, mixing parallel jobs and a default sampling rate value for column statistics with no skewed data seems to be good enough (no query plan regression at this moment) but we will have probably to change in the future. Anyway, we managed to reduce the execution time to one hour as shown below:
For columns with skewed data we are still keeping the FULLSCAN option and we plan to investigate filtered statistics to enhance further cardinality estimations in the future.
The bottom line of this story is that I probably never thought to go through all the aforementioned options if the customer accepted to follow my first proposal (who knows?). Technically and humanly speaking it was a good learning experience. Obviously, you would think it was not the best or the simplest approach and you would be right. Indeed, there are drawbacks here as adding overhead and complexity to write custom scripts and maintaining ndividual statistics over the time as well. But from my experience in a consulting world everything is not often black or white and we also have to compose with a plenty of customer’s context variations to achieve not necessarily what we consider the best but one satisfactory outcome for the business.
Happy new year 2018!
By David Barbarin
![Thumbnail [60x60]](https://www.dbi-services.com/blog/wp-content/uploads/2022/12/microsoft-square.png)
![Thumbnail [90x90]](https://www.dbi-services.com/blog/wp-content/uploads/2022/08/STH_web-min-scaled.jpg)
![Thumbnail [90x90]](https://www.dbi-services.com/blog/wp-content/uploads/2024/03/AHI_web.jpg)