Introduction
The second pre-conf I attended was about tuning Power BI.
I was curious to hear and learn from Nikola Ilic, who presented the session, what his experience and technique are dealing to solve Power BI performance issues
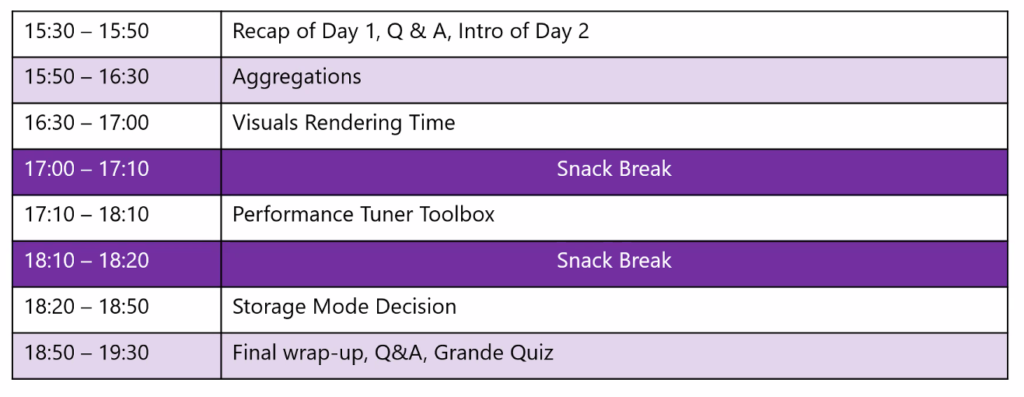
The agenda was the following over the 2 half days
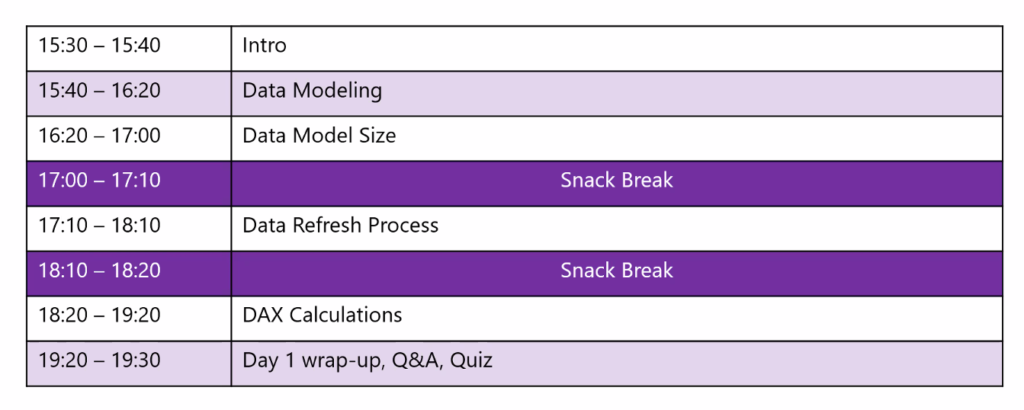
Data Modelling
Nikola first explain why data modelling is so important and especially why a star schema is so useful and adequate for analyzing your data.
Even if sometime a star schema is not performing as well as flat table it remains an exception, and a star-schema model will always to be privileged.
Having so many year of experience in data warehousing and BI modelling, I was of course alreay aware of that and could only agree with Nikola on that point, but it is always good to hear that the fundamental rules must be applied first.
The more time you spend in your data model the less DAX complexity you will have.
It is also important to avoid
- one-to-one relationship
- Bi-directional relationship:
You can easily avoid such this one applying not blank filter to filter out data in other visuals with related data
Use CROSSFILTER function iso bi-directional relationship especially for dimension to dimension cross analysis
A clear knowledge of the Vertipaq engine is also necessary to understand that you need to reduce the cardinality of the column at a minimum and to keep the model to a minimum size to get the best possible performances.
So keep in mind to always reduce you model to the granularity you need and remove all the information need necessary.
There are some techniques to reduce easily the size of the model, for instance to separate the time and the date in separate column to reduce heavily the cardinality of a sing datetime column.
Some techniques to have in mind
Auto Date/time
The auto date/time feature seems to be very practical at first.
But it can destroy your data model. It generate a lot of hidden data table for each your date/time columns and depending of the range you have can be very huge amount of data generated.
And it can be ugly when using slow changing dimensions.
So avoid definitely to use it a make your own date dimension that you can control.
Data Shaping
Best practice is always to shape your data, transformation and calculation as upstream as possible and as downstream as necessary. I other word it is better to do it before landing data in Power BI if possible.
Query folding
Query folding is the ability to translate the query in a query that can be interpreted by the source system. This avoid the Power Query Engine to work locally on the data. So the data can be delivered more quickly.
Check always when defining the query if it is folding or if the steps applied break the query folding. This is very important especially in DirectQuery mode. But consider it as well in import mode. The data import might perform much quicker if the query folds.
DAX calculations
When you use DAX calculations in your model, it is also important to know how they behave.
You can use the Power BI desktop Query Analyzer to capture the DAX formula applied in your visual an copy it in DAX Studio to analyze it further and understand if you can optimize it.
Understanding what is the Formula Engine (FE) and the Storage Engine (SE) of Power BI helps to optimize the DAX queries, especially to avoid the CallbackDataID slowing down the execution of the query.
Here are the steps to follow in for DAX calculation optimization:

Aggregations
Aggregation tables can be define only if in case of DirectQuery mode.
You have to make Power BI aware of the aggregated tables. It can speed up considerably the query when you defined aggregated table on column frequently used in your visuals.
It enables Power BI to pre-aggregate the data you detailed table and keep it in memory.
But be careful using the aggregation it might lead to inconsistency of your report result when visuals can grab the data from the aggregated tables and some other must query the source system to get the needed data.
Visual rendering time
Interesting was the see that each visual is waiting for the other to render the result. This is due to the single-threaded Formula Engine.
Replacing individual Cards visuals by a Matrix with the same measures can improve the rendering time.
Of course limiting the number of visual will also improve the performance of your report.
Sync Slicer can be as well a cause of a low performing report.
Performance tuner toolbox
To analyze the performances of your Power BI report there are some tools to know that can be of a great help.
First tool is the performance analyzer available in the Power BI desktop. It is the first step to identify element responsible of slow performance. It enables to capture information in real-time when you report is executing.
You will get information about times needed for:
- DAX Query
- Visual display
- Other: wait time for other visuals to finish
- Evaluated parameters
Outside the Power BI desktop there are a lot of external tools that are develop by third-party contributor but not officially supported by Microsoft.
- DAX studio: https://daxstudio.org
It very good tool to analyze your data model, it give you the size of the data, table, columns, give you information about the relationships and partitions. You can also analyze your data queries in order to see the query plan and find the potential optimization.
- Tabular editor: https://www.sqlbi.com/tools/tabular-editor/
- There is a free version and a commercial one
- Best Practice Analyzer is an additional module that you can use
Conclusion
Very good session. I learn a lot about Power BI optimization especially on the DAX optimization part where I had the less know-how. Attending such event is proves always that we need to stay aware of all the new techniques and tools and gives you a flavor how to work with them and to be keen to try them and use them.
I thanks also again Nikola for the great session and his enthusiasm as a presenter.
![Thumbnail [60x60]](https://www.dbi-services.com/blog/wp-content/uploads/2022/09/CHC_web-min-min-scaled.jpg)
![Thumbnail [90x90]](https://www.dbi-services.com/blog/wp-content/uploads/2025/11/LTO_WEB.jpg)
![Thumbnail [90x90]](https://www.dbi-services.com/blog/wp-content/uploads/2022/10/STS_web-min-scaled.jpg)
![Thumbnail [90x90]](https://www.dbi-services.com/blog/wp-content/uploads/2024/03/AHI_web.jpg)