By Franck Pachot
.
This month we started to give our Oracle Tuning Workshop. And with a new workshop comes new questions. We advise to give to the optimizer the most accurate statsistics that we can have. That suggests that WORKLOAD statistics are better than NOWORKLOAD ones because they gather the average number of blocks read in multiblock read, rather than using default values. But then, the question is: which time period do you choose to gather workload statistics, and with which interval duration?
The best answer we can give is probably Chris Antognini’s one (TOP Edition 2 – Chapter 7 – Workload Statistics). Either you gather them over several days, or you build a chart from short periodes and you set manually the average values that seem to be relevant.
The point is that the gathered values may be very irregular. I’ve always seen very irregular values.
In order to illustrate the problem I’ll show the graph about a production databases over 8 days. It’s a typical OLTP database with an average load.
get statistics from AWR
I’ll not run dbms_stats but I will get the same statistics from AWR. And this post is the occasion to share the query I use for that. I’ll not detail here how the WORKLOAD statistics are gathered, and how I’ve figured out the formulas. That’s for a longer article.
Just the summary:
- SREADTIM and MREADTIM comes from V$FILESTAT. And they are set only when more than 10 i/o calls are done.
- MBRC don’t use only V$FILESTAT but also the ‘physical read’ and ‘physical read direct’ from V$SYSSTAT. Yes, direct-path reads are not counted as multiblock reads for the MBRC system statistic.
- It’s from V$ views and not GV$, so the workload of one instance will set system statistics for the whole database.
However the example below comes from a 4 nodes RAC and my query sums all instances.
Ok, here is the query which show the estimated values on 1 hour intervals from AWR.
select to_char(begin_interval_time,'dd-mon') DAY,to_char(begin_interval_time,'hh24:mi')||'-'||to_char(end_interval_time,'hh24:mi') INTERVAL
 -- don't count the time when we have less than 10 i/o calls
 , round(case when SBLKRDS>10 then SBLKRDTIM/SBLKRDS end,3) SREADTIM
 , round(case when MBLKRDS>10 then MBLKRDTIM/MBLKRDS end,3) MREADTIM
 -- don't count the MBRC when we have less that 1000 blocks read
 , round(case when (MBRTOTAL-SBLKRDS)>100 and MBLKRDS>10 then (MBRTOTAL-SBLKRDS)/MBLKRDS end,2) MBRC
 , round(case when MBLKBLKS>100 and MBLKRDS>10 then MBLKBLKS/MBLKRDS end,3) "MBRC-incl-direct-path"
from
(
  select
     trunc(begin_interval_time,'hh24') begin_interval_time,trunc(end_interval_time,'hh24') end_interval_time,
     sum(singleblkrds) SBLKRDS,10*sum(singleblkrdtim) SBLKRDTIM, -- in milliseconds
     sum(phyrds-singleblkrds) MBLKRDS,10*sum(readtim-singleblkrdtim) MBLKRDTIM,  -- in milliseconds
     sum(phyblkrd-singleblkrds) MBLKBLKS,
     sum(physical_read-physical_read_direct) MBRTOTAL
  from (
    select dbid,instance_number,snap_id,begin_interval_time,end_interval_time
     ,singleblkrds-lag(singleblkrds)over(partition by dbid,instance_number,startup_time order by snap_id) singleblkrds
     ,singleblkrdtim-lag(singleblkrdtim)over(partition by dbid,instance_number,startup_time order by snap_id) singleblkrdtim
     ,phyrds-lag(phyrds)over(partition by dbid,instance_number,startup_time order by snap_id) phyrds
     ,readtim-lag(readtim)over(partition by dbid,instance_number,startup_time order by snap_id) readtim
     ,phyblkrd-lag(phyblkrd)over(partition by dbid,instance_number,startup_time order by snap_id) phyblkrd
     ,physical_read-lag(physical_read)over(partition by dbid,instance_number,startup_time order by snap_id) physical_read
     ,physical_read_direct-lag(physical_read_direct)over(partition by dbid,instance_number,startup_time order by snap_id) physical_read_direct
    from (
     -- file stats summed
     select dbid,instance_number,snap_id
      ,sum(singleblkrds) singleblkrds
      ,sum(singleblkrdtim) singleblkrdtim
      ,sum(phyrds) phyrds
      ,sum(readtim) readtim
      ,sum(phyblkrd) phyblkrd
     from dba_hist_filestatxs where dbid=(select dbid from v$database)
     group by dbid,instance_number,snap_id
    )
    join (select dbid,instance_number,snap_id,value physical_read from dba_hist_sysstat where stat_name='physical reads' and dbid=(select dbid from v$database) ) using(dbid,instance_number,snap_id)
    join (select dbid,instance_number,snap_id,value physical_read_direct from dba_hist_sysstat where stat_name='physical reads direct' and dbid=(select dbid from v$database) ) using(dbid,instance_number,snap_id)
    join dba_hist_snapshot using(dbid,instance_number,snap_id)
  )
  where begin_interval_time>sysdate-8
  group by
   dbid,snap_id,trunc(begin_interval_time,'hh24'),trunc(end_interval_time,'hh24')
) s
;
The output shows exactly what would have been gathered by dbms_stats except that I’ve summed all instances. I’ve verified that it matches what dbms_stats collects in 11.2.0.3 and 12.1.0.2.
I’ve put the result in excel in order to show the following graphs.
Database load over the week
Here is the load over the week (displayed with Orachrome Lighty – my favorite tool for that). You can note that I’ve some periods of time without any i/o (in blue), so it will be interresting to see which i/o statistics will be calculated.
SREADTIM and MREADTIM
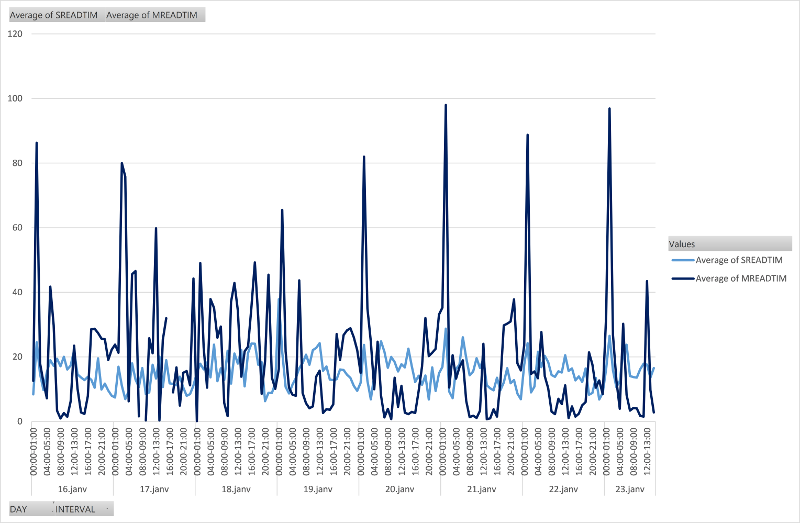
Here is the graph about the SREADTIM and MREADTIM output of my query above.
The first observation is the irregularity. Single block reads (SREADTIM) take between 4 and 30 milliseconds. The multiblock reads (MREADTIM) can go up to 100 milliseconds, but are some times very low.
Another observation is that sometimes the MREADTIM is lower than SREADTIM. That makes no sense. It cannot be faster to do larger i/o. This is a side effect of something.
Probably, some large direct-path reads are more subject to caching at filesystem or storage level. Especially for the blocks that were in the buffer cache and have been checkpointed just before the serial direct-path read. However the small reads are issued only when the block is not found in buffer cache, because they have not been read recently, then there is a low probability to find them in other caches. And in addition to that, when tempfiles are used for sorts or hash joins, they are probably cached at lower level as well.
But direct-path reads is a major partof multiblock reads i/o since the introduciton of serial direct-path read in 11g.
When you see that graph, you realize that you can’t run dbms_stats workload statistics just once because there is no relevant single period that is representative of the i/o workload.
MBRC
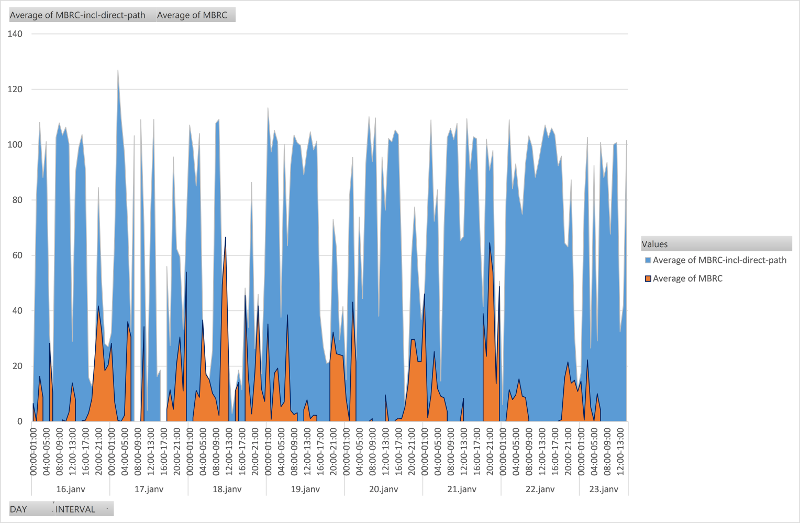
Here is the graph about the MBRC output of my query above. The orange value is the one calculated with the same formula as dbms_stats – not counting the blocks from direct.path reads.
And I’ve added the blue includes the direct-path reads, just to compare. You see that most of the time the actual number of block read is the maximum size set by db_file_multiblock_read_count:
We immediately notice that the value that will comes from the dbms_stats formula and will be used by the optimizer is very small. And the value that measures all multiblock reads is high and reaches the maximum set by db_file_multiblock_read_count.
Which one is good then? Do you want that the CBO costs full table scan with that small value that is acurate only for buffered reads?
There are good reasons for it. Afterall, the CBO costs execution plan with a model that do not include several parameters such as the fact that blocks may be in cache, or that because of concurrency some blocks bust have lot of undo applied. So we can accept that the model do not include the fact that we can do serial direct path reads – which is a decision that depends on the same parameters (blocks in buffer cache and blocks modified).
And, by the way, all the physical reads done to tempfiles must not me accounted into the average MBRC because they have nothing to do with full table scans. They count to evaluate MREADTIM but not for MBRC. This is probably the main reason why dbms_stats do not consider ‘physical direct path read’.
Conclusion
What I wanted to proove here is that the SREADTIM, MREADTIM and MBRC, as they are gathered by dbms_stats WORKLOAD statistics, is not constant at all and depend a lot on the kind of workload that is occuring. Then you must at least check the value that were gathered. And better: check from the AWR history and set a relevant value manually. And keep in mind that there are a lot of improvements for multiblock reads that the CBO is not aware of: serial direct-path reads and – when in exadata – smart scans.
This is all about costing full table scans (and index fast full scans) vs. index access. That has always been difficult to handle (see my opinion about optimizer_index_cost_adj). Having relevant system statistics is of major importance.


![Thumbnail [60x60]](https://www.dbi-services.com/blog/wp-content/uploads/2022/12/oracle-square.png)
![Thumbnail [90x90]](https://www.dbi-services.com/blog/wp-content/uploads/2025/05/JDE_Web-1-scaled.jpg)
![Thumbnail [90x90]](https://www.dbi-services.com/blog/wp-content/uploads/2022/08/DWE_web-min-scaled.jpg)