Among the different packages provided by Zabbix, one arouse my curiosity: Proxy. What is its purpose? When to use it? How to install it? I will cover these in this blog post.
Intention
There are multiple reasons to use a zabbix proxy in a monitoring infrastructure. The first and foremost is to offload main server from pulling data. Indeed, to collect data from zabbix agent, zabbix server must poll each host and wait for the result (with Agent in passive mode). This could take time and is obviously adding load to the server which have other tasks to do (just look at ps -ef | grep zabbix_server output to have an idea). Among them, there are alerter, trapper, preprocessing, http, self-monitoring, etc.
In terms of processes, a proxy server is very similar to Zabbix server without a user interface. Zabbix server delegates a part of the work to the proxy server.
Proxy also requires a database which, then, is used as a buffer in case of connectivity issues between server and proxy.
Zabbix proxy can be used to monitor distant locations as it collects data from all hosts oversees and then send the “package” to the zabbix server. It acts as an active agent (default mode) by pushing data to zabbix server.
Setup
I will follow the steps provided by Zabbix web site which consist of:
- Add Zabbix repository.
- Install Zabbix package.
- Configure the database.
- Enable service.
Once this part is completed, we must add proxy in Zabbix server configuration. To do that, we go in Administration, Proxies:
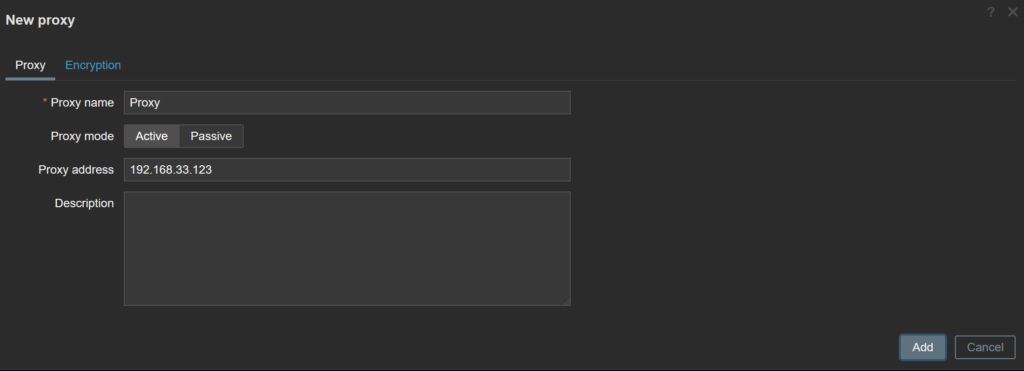
Proxy name must match Hostname value (which is uniq) set in /etc/zabbix/zabbix_proxy.conf on proxy host:
Hostname=Zabbix proxy
If not, you will see this message in /var/log/zabbix/zabbix_proxy.log:
12903:20230711:125607.693 cannot send proxy data to server at "192.168.33.122": proxy "Zabbix proxy" not foundOnce I fixed this, I see messages like that:
12896:20230711:125613.433 received configuration data from server at "192.168.33.122", datalen 4995Now, proxy is ready to monitor a host.
Host Monitoring
As of now, your freshly installed proxy does not monitor anything. To assign a proxy to a host, you simply need to edit it and change the “Monitored by proxy” field:

As soon as change has been done, zabbix server will stop pulling data and proxy will tell us from the log:
sending configuration data to proxy "Zabbix proxy" at "192.168.33.123", datalen 33197, bytes 5593 with compression ratio 5.9Thus, if we do not do the last step, proxy will not be allowed to collect data and agent on the monitored host (my WildFly server) will refuse it:
failed to accept an incoming connection: connection from "192.168.33.123" rejected, allowed hosts: "192.168.33.122".122 is the zabbix server and .123 is the proxy.
To fix it, I can update Server setting in /etc/zabbix/zabbix_agent2.conf from monitored host by either adding proxy IP or update existing IP:
Server=192.168.33.122,192.168.33.123Followed by a service restart (systemctl restart zabbix-agent2.service).
You might wonder how to change “Monitored by proxy” on many hosts: The answer is Mass Update.
Proxy Monitoring
To do meta-monitoring (monitoring of monitoring), we go in Hosts section and add one server:
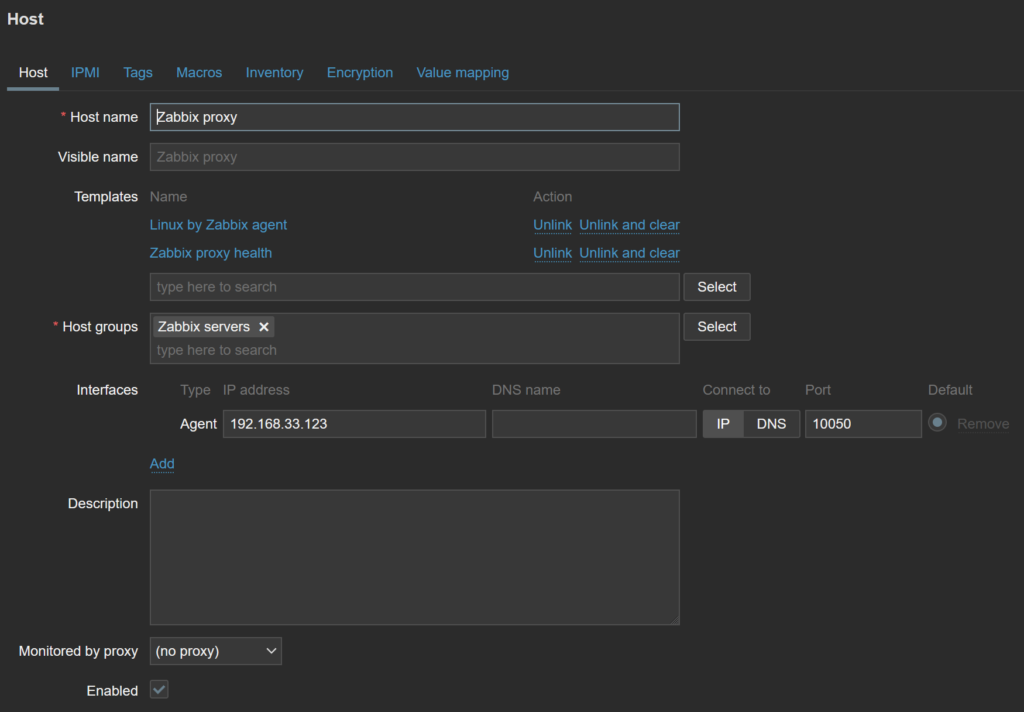
As you can see, I associated two templates:
- Linux by Zabbix agent which requires zabbix agent to be installed on proxy server to achieve OS self-monitoring. More info on how-to in this blog post.
- Zabbix proxy health which includes items, triggers and dashboards.
At this step, we must decide whether we want to monitor this agent from proxy or server. There are pros and cons.
- Pros for choosing proxy: Benefit from existing connection between proxy and server. No need to open any additional port in firewall.
- Pros from choosing server (no proxy): Agent monitoring is independent of proxy status and will continue to work even if proxy service is stopped or crashed.
![Thumbnail [90x90]](https://www.dbi-services.com/blog/wp-content/uploads/2022/08/GRE_web-min-scaled.jpg)
![Thumbnail [90x90]](https://www.dbi-services.com/blog/wp-content/uploads/2022/09/DDI_web-min-scaled.jpg)