Oracle WebLogic Server continues to be a backbone for enterprise Java applications. With version 14, it brings improved Java compatibility, stronger security defaults, and better clustering. But while the platform is robust, monitoring it effectively remains a challenge.
Introduction
Within WebLogic 14, out-of-the-box tools such as the Remote Console and WLST scripts provide some visibility, but they are limited when it comes to real-time metrics, historical analysis, or predictive monitoring.
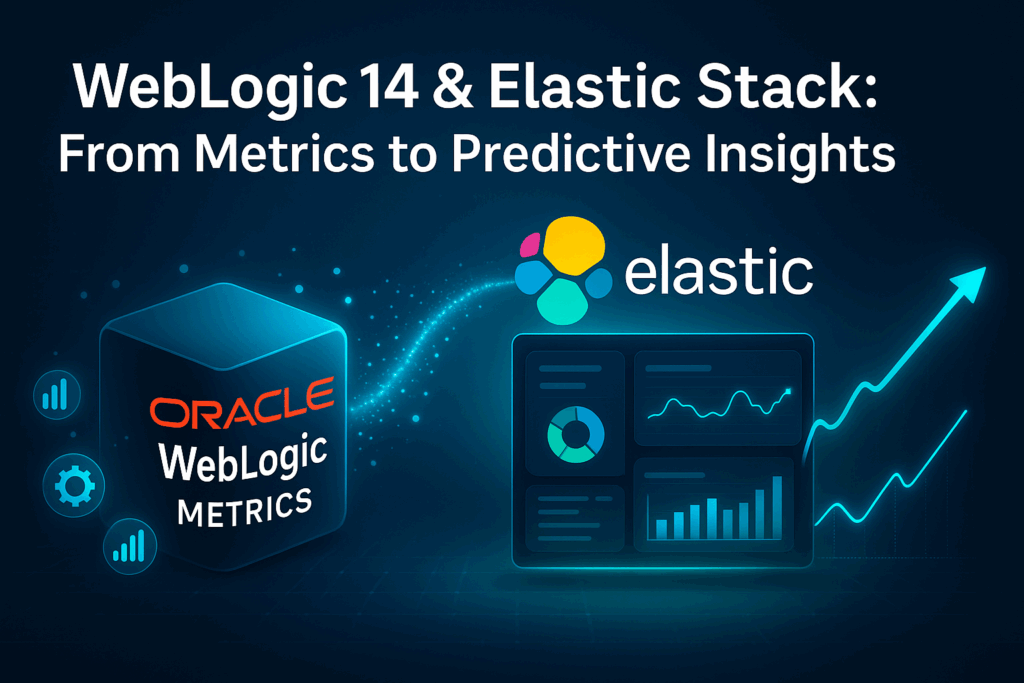
This is where the Elastic Stack (Elasticsearch, Logstash, Beats, Elastic Agent, Kibana, and Elastic Machine Learning) delivers real value. By integrating WebLogic 14 logs, traces and metrics with Elastic Stack, you can build a unified platform that provides:
- Real-time observability of servers, threads, JDBC pools, and JVM health.
- Powerful visualization and analysis in Kibana.
- Predictive monitoring through anomaly detection and forecasting.
In this blog, we’ll walk through the integration of metrics step by step.
Step 1: Export WebLogic 14 Metrics
WebLogic does not natively expose metrics in formats suitable for Elastic or Prometheus. The solution is the WebLogic Monitoring Exporter, which translates JMX metrics into Prometheus-style output.
Download the exporter:
wget https://github.com/oracle/weblogic-monitoring-exporter/releases/download/v2.3.0/weblogic-monitoring-exporter.jar
Configure it (config.yaml):
domains:
  - name: mydomain
    url: t3://localhost:7001
    username: monitoruser
    password: XXXXXXXXXX
    metrics:
      - name: ServerHealth
      - name: ThreadPool
      - name: JDBCConnectionPool
      - name: JVMRuntime
Start the exporter:
java -jar weblogic-monitoring-exporter.jar --config=config.yamlVerify metrics are exposed at:
http://localhost:8080/metricsStep 2: Collect Metrics with Metricbeat
Elastic provides Metricbeat with a Prometheus module, making it easy to scrape WebLogic exporter metrics and send them to Elasticsearch.
Enable and configure the module:
metricbeat modules enable prometheusprometheus.yml configuration:
- module: prometheus
  period: 10s
  hosts: ["http://localhost:8080"]
  metrics_path: /metrics
Start Metricbeat:
sudo metricbeat setup
sudo service metricbeat start
Now WebLogic metrics are flowing into Elasticsearch.
Step 3: Collect WebLogic Logs with Filebeat or Elastic Agent
Metrics give you system health, but logs provide context. To correlate performance issues with application errors, you should ingest WebLogic logs into Elasticsearch.
Option A: Using Filebeat
Install and configure Filebeat on the WebLogic server.
Example configuration (filebeat.yml):
filebeat.inputs:
  - type: log
    enabled: true
    paths:
      - /u02/app/weblogic/domains/mydomain/servers/*/logs/*.log
    fields:
      application: weblogic
    multiline.pattern: '^\<'
    multiline.negate: true
    multiline.match: after

output.elasticsearch:
  hosts: ["http://localhost:9200"]

And start Filebeat.
Option B: Using Elastic Agent (Recommended)
Elastic Agent simplifies deployment by combining logs, metrics, and security data collection into a single agent managed centrally via Kibana Fleet.
Steps:
- Enroll the agent from Kibana – Fleet.
- Attach the System + Custom Log integration.
- Configure the WebLogic log path.
- Deploy the agent on your WebLogic server.
This approach reduces operational overhead and centralizes configuration.
Next steps & Conclusion
Next steps:
- Build Observability Dashboards in Kibana
- Add APM for Transaction-Level Visibility
- Enable Machine Learning for Predictive Monitoring
- Configure Alerts
While WebLogic 14 provides essential administrative tooling, it does not offer full observability capabilities out of the box.
By integrating it with the Elastic Stack, you gain:
- Real-time operational insight
- Deep log and metric correlation
- Predictive monitoring with machine learning
- Actionable alerting
- Transaction-level visibility
This approach scales from a single WebLogic instance to enterprise clusters and hybrid cloud deployments.
In short: you move from reactive troubleshooting to proactive performance management.
![Thumbnail [60x60]](https://www.dbi-services.com/blog/wp-content/uploads/2022/09/DDI_web-min-scaled.jpg)