SQL Server: why can’t I read the full table in parallel???
Why SQL Server keeps a full SELECT * serial: I/O cost is never divided across threads. Forcing parallelism burned 3x the CPU.

Why SQL Server keeps a full SELECT * serial: I/O cost is never divided across threads. Forcing parallelism burned 3x the CPU.

There is no tuning possible without a proper monitoring in place to measure the impact of any changes. Thus, before trying to tune an Apache httpd server, I will explain how to monitor it with Zabbix. Setup Zabbix Monitoring Apache httpd template provided by Zabbix uses mod_status which provides metrics about load, processes and connections. Before enabling this module, we…

The DUAL table is automatically created by Oracle and contains one column (DUMMY) and one row (x value). This table is often used by SQL developer in PL/SQL code (Package, Functions, Trigger) to initialize variables storing technical information such as for example SYSDATE, USER or HOSTNAME. Querying DUAL table is generally faster as we can see below: SQL> select sysdate…
By Franck Pachot . For an Oracle DBA, we are used to join active sessions (from V$SESSION where status=’ACTIVE) with active statements (from V$SQL where users_executing>0) on the SQL_ID. V$ACTIVE_SESSION_HISTORY also displays the TOP_LEVEL_SQL_ID to get the entrypoint of the usercall if we need it. With Postgres it is a bit more difficult because it seems that PG_STAT_ACTIVITY do not…

This is my first blog of this new year and since a while by the way. Indeed, last year, I put all my energy to realign my Linux skills with the new Microsoft’s strategy that opens SQL Server to Open Source world. But at the same time, I did a lot of interesting stuff at customers shops and I decided…

By Franck Pachot . On datawarehouse databases, I frequently recommend increasing the level of dynamic sampling because: Queries have complex predicates with AND, OR, IN(), ranges and correlated values for which the optimizer cannot estimate the cardinality properly Queries are long anyway (compared to OLTP) and can afford more parse time to get an optimized execution plan However, there’s a…
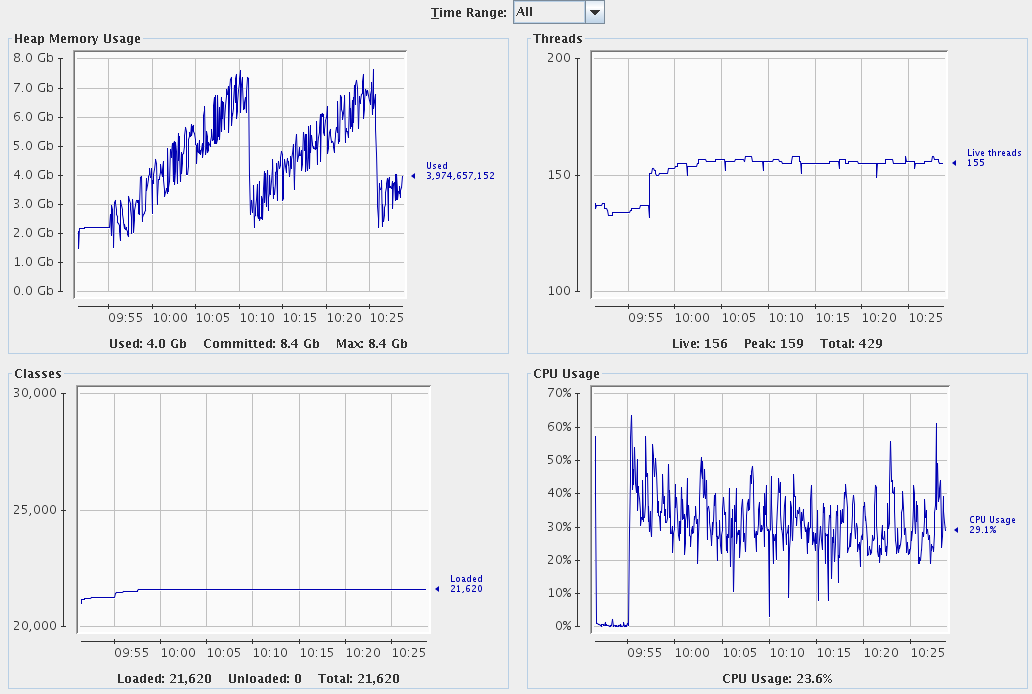
Sometimes you have java processes or even jboss servers using a lot of CPU. In my example I had an xPlore dsearch server using like 98% of the cpu. When using jconsole and jvisualvm I figured out the garbage collector was using 50 to 60% of the cpu time. This was because the server was indexing and accessing the internal…