By Franck Pachot
.
For an Oracle DBA, we are used to join active sessions (from V$SESSION where status=’ACTIVE) with active statements (from V$SQL where users_executing>0) on the SQL_ID. V$ACTIVE_SESSION_HISTORY also displays the TOP_LEVEL_SQL_ID to get the entrypoint of the usercall if we need it. With Postgres it is a bit more difficult because it seems that PG_STAT_ACTIVITY do not show the active statement but only the top-level one. But pg_stat_statement collects statistics for the final statements.
Here is an example where I’ve run pgio (the SLOB method for Postgres by Kevin Closson) in a Bitnami Postgres Compute service on the Oracle Cloud. pgio runs all statements from a PL/pgSQL function MYPGIO. This function runs the SELECT statements and some UPDATE statements depending on UPDATE_PCT. Most of the time is spend in those statements and very few in PL/pgSQL itself, which is the goal of pgio – measuring logical and physical I/O without the noise of other application components.
I have added the pg_stat_statements extension by setting the following in postgresql.conf and installing postgresql10-contrib
shared_preload_libraries = 'pg_stat_statements'
pg_stat_statements.track = all
I’ve reset the statistics before running pgio:
select pg_stat_reset();
select pg_stat_statements_reset();
The I’ve run the runit.sh with 4 schemas and 20 threads.
pg_stat_activity
Here is what I can see in PG_STAT_ACTIVITY when it is running:
postgres=# select substr(query,1,100) query,backend_type,application_name,query_start,wait_event_type,wait_event,state from pg_stat_activity where datid=17021;

                                                query                                                 |   backend_type    |    application_name    |          query_start          | wait_event_type |  wait_event   | state
------------------------------------------------------------------------------------------------------+-------------------+------------------------+-------------------------------+-----------------+---------------+--------
 select query,backend_type,application_name,query_start,wait_event_type,wait_event,state from pg_stat | client backend    | PostgreSQL JDBC Driver | 2018-06-27 20:15:11.578023+00 | Client          | ClientRead    | idle
 autovacuum: VACUUM ANALYZE public.pgio3                                                              | autovacuum worker |                        | 2018-06-27 20:01:19.785971+00 |                 |               | active
 autovacuum: VACUUM ANALYZE public.pgio4                                                              | autovacuum worker |                        | 2018-06-27 20:02:19.811009+00 |                 |               | active
 autovacuum: VACUUM ANALYZE public.pgio1                                                              | autovacuum worker |                        | 2018-06-27 20:08:19.864763+00 |                 |               | active
 SELECT * FROM mypgio('pgio1', 10, 300, 131072, 255, 8);                                              | client backend    | psql.bin               | 2018-06-27 20:14:55.915761+00 | Lock            | transactionid | active
 SELECT * FROM mypgio('pgio1', 10, 300, 131072, 255, 8);                                              | client backend    | psql.bin               | 2018-06-27 20:14:55.925117+00 | Lock            | transactionid | active
 SELECT * FROM mypgio('pgio1', 10, 300, 131072, 255, 8);                                              | client backend    | psql.bin               | 2018-06-27 20:14:55.934903+00 | Lock            | transactionid | active
 SELECT * FROM mypgio('pgio2', 10, 300, 131072, 255, 8);                                              | client backend    | psql.bin               | 2018-06-27 20:14:55.931038+00 | Lock            | transactionid | active
 SELECT * FROM mypgio('pgio1', 10, 300, 131072, 255, 8);                                              | client backend    | psql.bin               | 2018-06-27 20:14:55.9269+00   | Lock            | transactionid | active
 SELECT * FROM mypgio('pgio1', 10, 300, 131072, 255, 8);                                              | client backend    | psql.bin               | 2018-06-27 20:14:55.923288+00 | Lock            | transactionid | active
 SELECT * FROM mypgio('pgio2', 10, 300, 131072, 255, 8);                                              | client backend    | psql.bin               | 2018-06-27 20:14:55.95252+00  | LWLock          | WALWriteLock  | active
 SELECT * FROM mypgio('pgio3', 10, 300, 131072, 255, 8);                                              | client backend    | psql.bin               | 2018-06-27 20:14:55.96237+00  |                 |               | active
 SELECT * FROM mypgio('pgio1', 10, 300, 131072, 255, 8);                                              | client backend    | psql.bin               | 2018-06-27 20:14:55.951347+00 | Lock            | transactionid | active
 SELECT * FROM mypgio('pgio1', 10, 300, 131072, 255, 8);                                              | client backend    | psql.bin               | 2018-06-27 20:14:55.962725+00 | Lock            | transactionid | active
 SELECT * FROM mypgio('pgio4', 10, 300, 131072, 255, 8);                                              | client backend    | psql.bin               | 2018-06-27 20:14:55.985567+00 | Lock            | transactionid | active
 SELECT * FROM mypgio('pgio1', 10, 300, 131072, 255, 8);                                              | client backend    | psql.bin               | 2018-06-27 20:14:55.98943+00  | Lock            | transactionid | active
 SELECT * FROM mypgio('pgio2', 10, 300, 131072, 255, 8);                                              | client backend    | psql.bin               | 2018-06-27 20:14:55.976483+00 | Lock            | transactionid | active
 SELECT * FROM mypgio('pgio4', 10, 300, 131072, 255, 8);                                              | client backend    | psql.bin               | 2018-06-27 20:14:56.032111+00 | Lock            | transactionid | active
 SELECT * FROM mypgio('pgio4', 10, 300, 131072, 255, 8);                                              | client backend    | psql.bin               | 2018-06-27 20:14:55.998013+00 | Lock            | transactionid | active
 SELECT * FROM mypgio('pgio4', 10, 300, 131072, 255, 8);                                              | client backend    | psql.bin               | 2018-06-27 20:14:56.043566+00 | Lock            | transactionid | active
(20 rows)
My client sessions are active on the MYPGIO function. This is the top-level statement which runs some SELECT and UPDATE and there is a very small chance to get samples with the session active on the controller procedural code rather than one of those statements. However, that’s the only thing I can see here.
pg_stat_statements
Now looking at PG_STAT_STATEMENTS:
postgres=# create extension pg_stat_statements;
CREATE EXTENSION

postgres=# select substr(query,1,100) query,calls,total_time/1e6 seconds,total_time/calls/1e6 "sec./call",rows from pg_stat_statements where dbid=17021 order by total_time desc;
                                                query                                                 | calls |       seconds       |      sec./call       | rows
------------------------------------------------------------------------------------------------------+-------+---------------------+----------------------+-------
 UPDATE pgio1 SET scratch = scratch + $1 WHERE mykey BETWEEN $2 AND $3                                |  2081 |   0.583796520366999 | 0.000280536530690533 | 18729
 UPDATE pgio4 SET scratch = scratch + $1 WHERE mykey BETWEEN $2 AND $3                                |  2076 |      0.565067778457 | 0.000272190644728805 | 18684
 UPDATE pgio2 SET scratch = scratch + $1 WHERE mykey BETWEEN $2 AND $3                                |  2229 |      0.412313896512 | 0.000184977073356662 | 20061
 SELECT sum(scratch) FROM pgio3 WHERE mykey BETWEEN $1 AND $2                                         | 19199 |   0.317597650247998 | 1.65424058673888e-05 | 19199
 UPDATE pgio3 SET scratch = scratch + $1 WHERE mykey BETWEEN $2 AND $3                                |  2202 |   0.304893281095001 | 0.000138461980515441 | 19818
 SELECT sum(scratch) FROM pgio2 WHERE mykey BETWEEN $1 AND $2                                         | 19500 |       0.29686205481 | 1.52236951184615e-05 | 19500
 SELECT sum(scratch) FROM pgio1 WHERE mykey BETWEEN $1 AND $2                                         | 17873 |      0.285481468151 | 1.59727783892464e-05 | 17873
 SELECT sum(scratch) FROM pgio4 WHERE mykey BETWEEN $1 AND $2                                         | 17889 |      0.273855678533 | 1.53086074421711e-05 | 17889
 SELECT pgio_get_random_number($6, v_scale - v_select_batch_size)                                     | 83129 | 0.00134782461999997 | 1.62136513130192e-08 | 83129
 select blks_read from pg_stat_database where datname = $1                                            |     1 |       1.0456142e-05 |        1.0456142e-05 |     1
 create table pgio_audit_table ( c1 numeric , c2 numeric,  c3  numeric  , c4 numeric, c5 numeric, c6  |     1 |        7.636071e-06 |         7.636071e-06 |     0
 CREATE OR REPLACE FUNCTION mypgio(                                                                  +|     1 |        6.425742e-06 |         6.425742e-06 |     0
 v_mytab                 varchar,                                                                    +|       |                     |                      |
 v_pctupd                int,                                                                        +|       |                     |                      |
 v_runtime_secs          bigint,                                                                     +|       |                     |                      |
 v_scal                                                                                               |       |                     |                      |
 select substr(query,$1,$2) query,calls,total_time/$3 seconds,total_time/calls/$4 "sec./call",rows fr |     9 |        5.017752e-06 |          5.57528e-07 |   139
 CREATE OR REPLACE FUNCTION pgio_get_random_number(BIGINT, BIGINT) RETURNS BIGINT AS $$              +|     1 |        4.217947e-06 |         4.217947e-06 |     0
 DECLARE                                                                                             +|       |                     |                      |
     v                                                                                                |       |                     |                      |
 drop table pgio_audit_table                                                                          |     1 |        3.337471e-06 |         3.337471e-06 |     0
 DROP TYPE pgio_return CASCADE                                                                        |     1 |        2.451694e-06 |         2.451694e-06 |     0
 CREATE TYPE pgio_return AS (                                                                        +|     1 |        1.746512e-06 |         1.746512e-06 |     0
 mypid int,                                                                                          +|       |                     |                      |
 loop_iterations bigint ,                                                                            +|       |                     |                      |
 sql_selects bigint,                                                                                 +|       |                     |                      |
 sql_updates                                                                                          |       |                     |                      |
 select query,backend_type,application_name,query_start,wait_event_type,wait_event,state from pg_stat |     3 |        1.312499e-06 | 4.37499666666667e-07 |   172
 SELECT pg_backend_pid()                                                                              |    80 |         6.10539e-07 |        7.6317375e-09 |    80
 select pg_stat_statements_reset()                                                                    |     1 |          1.8114e-07 |           1.8114e-07 |     1
 select datname, blks_hit, blks_read,tup_returned,tup_fetched,tup_updated from pg_stat_database where |     1 |         1.60161e-07 |          1.60161e-07 |     1
 select blks_hit from pg_stat_database where datname = $1                                             |     1 |         1.48597e-07 |          1.48597e-07 |     1
 select pg_stat_reset()                                                                               |     1 |          5.3776e-08 |           5.3776e-08 |     1
 SET application_name = 'PostgreSQL JDBC Driver'                                                      |     2 |          5.2967e-08 |          2.64835e-08 |     0
 SET extra_float_digits = 3                                                                           |     2 |          3.7514e-08 |           1.8757e-08 |     0
 show shared_buffers--quiet                                                                           |     1 |          2.1151e-08 |           2.1151e-08 |     0
(26 rows)
Here I can see that the main activity is on UPDATE and SELECT. There’s even no mention of the MYPGIO function except for its creation. I don’t even see the calls for it. We can see the same graphically from Orachrome Lighty for Postgres where only the top-level statement is displayed:
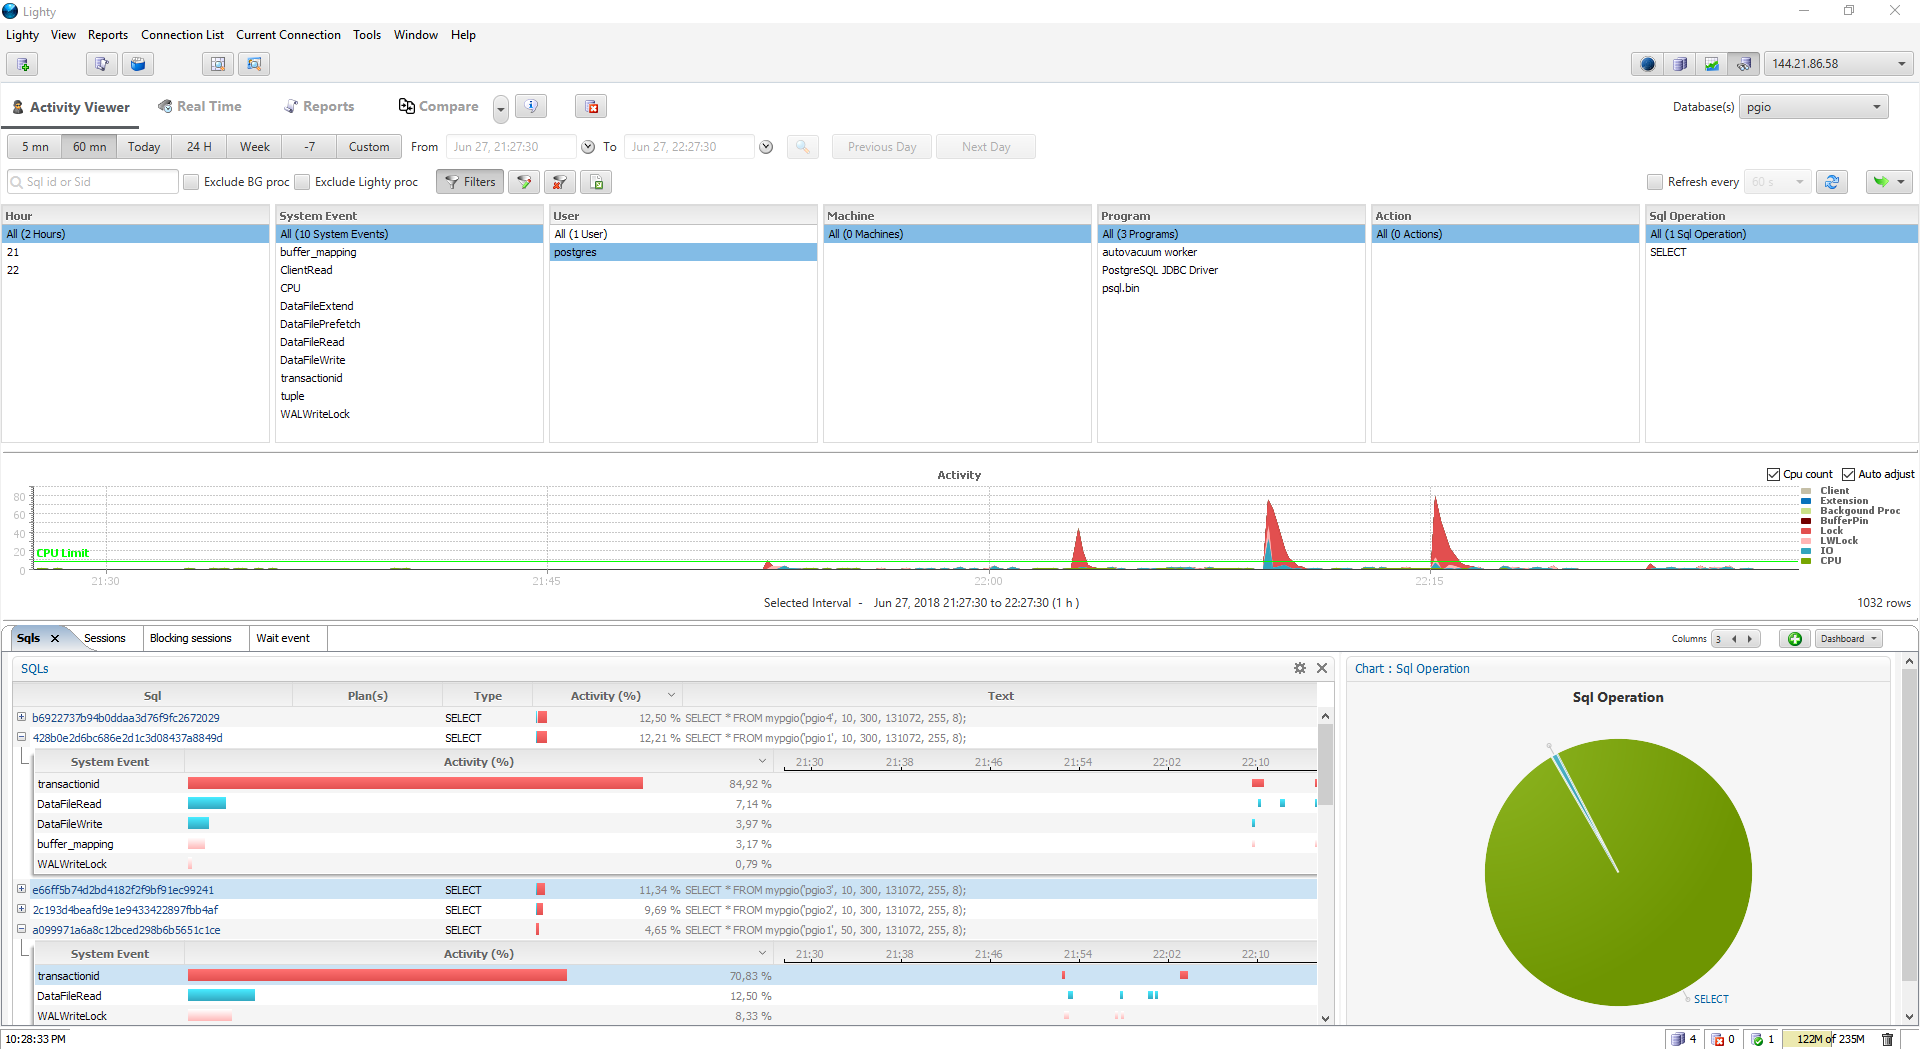
This makes it very difficult to match those two views. From PG_STAT_ACTIVITY I know that I spend time on MYPGIO function call and its system activity (here lot of locks waiting for vacuum sessions and some latch contention on WAL). We have sampling information, but nothing about database time and read/write measures. From PG_STAT_STATEMENT we have all measures, but with no link to the sampling activity, and then no link with the wait events. Coming from Oracle databases, the most important in Oracle tuning is the DB time which can be detailed from the system point of view (wait events, CPU, I/O) and from the user point of view (time model, SQL statements, Segments). And it can be a cumulative measure (each session measuring the time in a call or an operation) or a sampling one (counting the sessions active and on which operation). And ASH makes the link between all those dimensions. With this, we can directly address the user response time with our actions on the system, digging from the end-user perceived problem to the internal application or system root cause.
With current Postgres statistics, it seems that we can look at SQL statements on one side and at the system on the other side. But can we ensure that we really address the user problems? Especially when calling the statements from a function, which is the optimized way to avoid useless roundtrips and context switches? Postgres is evolving a lot from the community. I hope that more and more information will be available in PG_STAT_ACTIVITY to be sampled and link all dimensions related to the system and the users. Like with any analytic query, we need all dimensions at the same level of granularity.
![Thumbnail [60x60]](https://www.dbi-services.com/blog/wp-content/uploads/2022/12/oracle-square.png)
![Thumbnail [90x90]](https://www.dbi-services.com/blog/wp-content/uploads/2022/08/MAW_web-min-scaled.jpg)
![Thumbnail [90x90]](https://www.dbi-services.com/blog/wp-content/uploads/2022/08/FRJ_web-min-scaled.jpg)
![Thumbnail [90x90]](https://www.dbi-services.com/blog/wp-content/uploads/2025/05/JDE_Web-1-scaled.jpg)